
Among America’s dozen most populous cities, the five with the lowest unemployment rates, according to the latest (i.e., for November 2021) ‘household survey’ conducted by the Bureau of Labor Statistics (BLS), are Atlanta (2.2% not seasonally adjusted/NSA), Phoenix (2.8%), Washington (3.6%), Miami (3.7%) and San Francisco (3.8%).
A low unemployment rate is only half the story, however, when it comes to evaluating whether a city has a vibrant labor market. At least as important is a healthy record of jobs creation.
 On that score, Atlanta and Phoenix fare well, with the latter slightly outperforming the former. Jobs growth in Phoenix is currently +5.6% year over year; by comparison, Atlanta is +5.1%.
Miami and San Francisco can also boast of hiring success. Employment in the former is +5.3% y/y, while in the latter, it’s +5.0% y/y.
Washington’s y/y staffing increase of +4.1% is a little below the national ‘all jobs’ rate of +4.5% y/y.
Table 1 takes the labor market analysis beyond just the biggest 12 cities in the nation. Table 1 is based on the results for all 50-plus U.S. metropolitan statistical areas (MSAs) that have populations of at least a million residents.
The 50-plus cities are ranked according to employment growth, from fastest to slowest, and by unemployment rates, from lowest to highest. Only the best 33 cities in each category are shown in Table 1. Otherwise, the size of the table would become unmanageable for posting to social media.
A composite ranking of the cities that combines where they place for both jobs growth and unemployment rates reveals a dozen best list comprised of Phoenix, Salt Lake City, Atlanta, Austin, Portland, Seattle, Nashville, Raleigh, Orlando, Birmingham, Kansas City and Minneapolis-St. Paul.
How Did 2021 Construction Stack Up in those 12 U.S. Cities?
What was the record of construction activity in those 12 cities last year? With respect to total dollar volume of starts, 2021 versus 2020, Phoenix was the leader, at $25.5 billion and +50.4% year over year. The standout project among groundbreakings in Phoenix in 2021 was Intel’s giant computer chipmaking complex.
In second and third spots for total dollar volume starts last year, among the 12 best city labor markets, were Atlanta ($14.8 billion, but -7.6% y/y) and Austin ($13.1 billion and +8.4% y/y).
Focusing on strictly nonresidential building starts in 2021, Phoenix (of course) was again first, at $13.2 billion and +139.9% y/y. Next in line were Atlanta ($4.1 billion, but -33.8%), Kansas City ($3.7 billion and +13.8%), Austin ($3.3 billion, but -31.8% y/y) and Orlando ($2.7 billion and +8.6%).
In 2021’s engineering/heavy civil starts, Austin was the leader ($2.1 billion and +65.4% y/y), chased by Minneapolis-St. Paul ($1.9 billion, but -2.6%), Atlanta ($1.5 billion, but -18.1%) and Phoenix ($1.3 billion and +17.0%).
In residential, it was Phoenix riding point ahead of Atlanta, $10.9 billion to $9.2 billion, although Atlanta’s y/y percentage gain was greater, +15.0% to +6.1%.
Canada’s City Labour Markets & Construction Activity
Canada lays claim to only six census metropolitan areas (CMAs) with populations exceeding a million people. Among that half dozen, the nation’s capital, Ottawa-Gatineau, has the lowest unemployment rate, 4.1%, followed by Montreal, 5.3%, and Vancouver, 5.7%. (Unless adjusted for the different methodological approach to the calculation of the figures between the two countries, reported Canadian U rates generally run higher than their U.S. counterparts.)
The other biggest-city U rates in Canada presently are 6.6%, Edmonton; 7.2%, Toronto; and 8.2%, Calgary.
Leading in year-over-year jobs growth among the six, though, is Edmonton, +9.5%, followed by Toronto, +6.3%; Vancouver, +5.5%; Montreal, +4.3%; Ottawa-Gatineau, +3.5%; and Calgary, +1.5%.
Total dollar-volume construction starts activity in those six cities in 2021 was led by Toronto ($11.8 billion, but -26.0% y/y), with Montreal as the runner-up ($8.9 billion, but -6.8% y/y).
The other 2021 total starts performances among the biggest six cities were: Vancouver, $7.2 billion, but -20.1% y/y; Calgary, $4.8 billion and +98.9%; Edmonton, $3.0 billion and +8.2%; and Ottawa-Gatineau, also $3.0 billion, but -55.7%.
Toronto led in engineering starts, $2.6 billion and +37.0% y/y, but both Vancouver and Montreal beat TO (as Toronto is known locally) in nonresidential building starts. Vancouver’s figure was $4.8 billion and +235.1% y/y, while Montreal’s was $3.6 billion and +17.0%. The outsized gain of +235.1% for Vancouver was largely due to the initiation of work on a new St. Paul’s hospital.
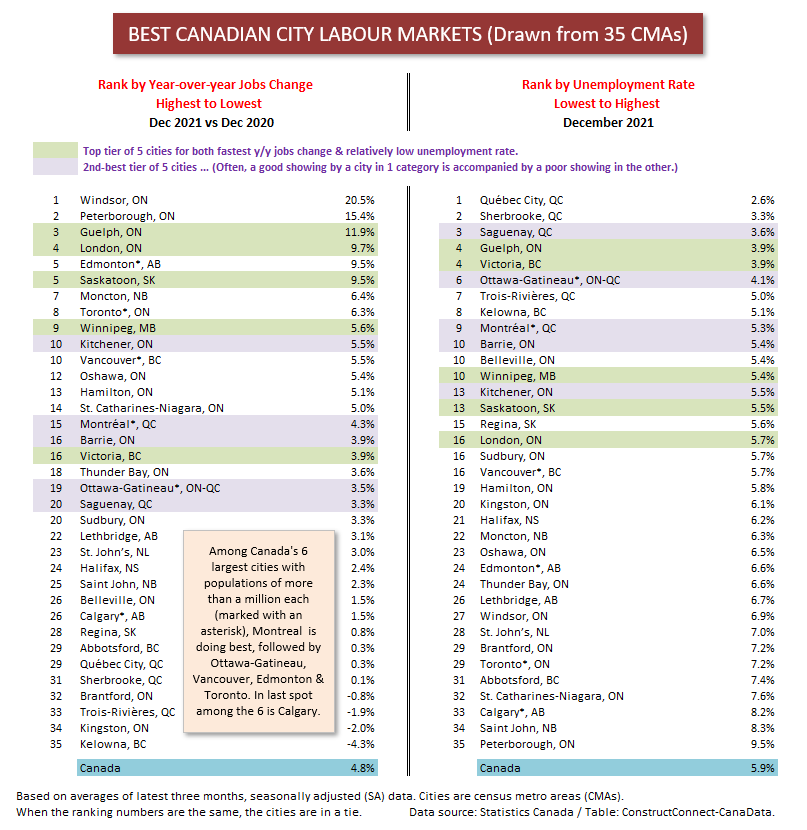
Table 2, like Table 1 for the U.S., extends the labor market coverage to many more Canadian cities beyond just the six most populous.
Once again, a behind-the-scenes composite ranking has been developed based on each city’s positioning according to jobs growth (fastest to slowest) and unemployment rate (lowest to highest).
Based on the composite ranking, the leading city labour markets among all 35 of Canada’s CMAs are Guelph, Saskatoon, Winnipeg, London, Victoria, Kitchener, and Saguenay.
Graph 1
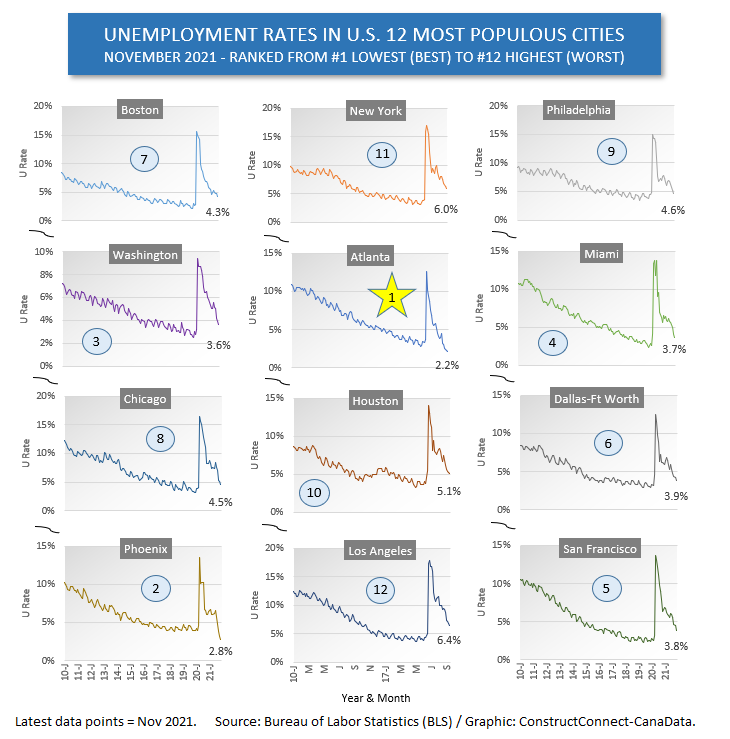
Table 1

Graph 2
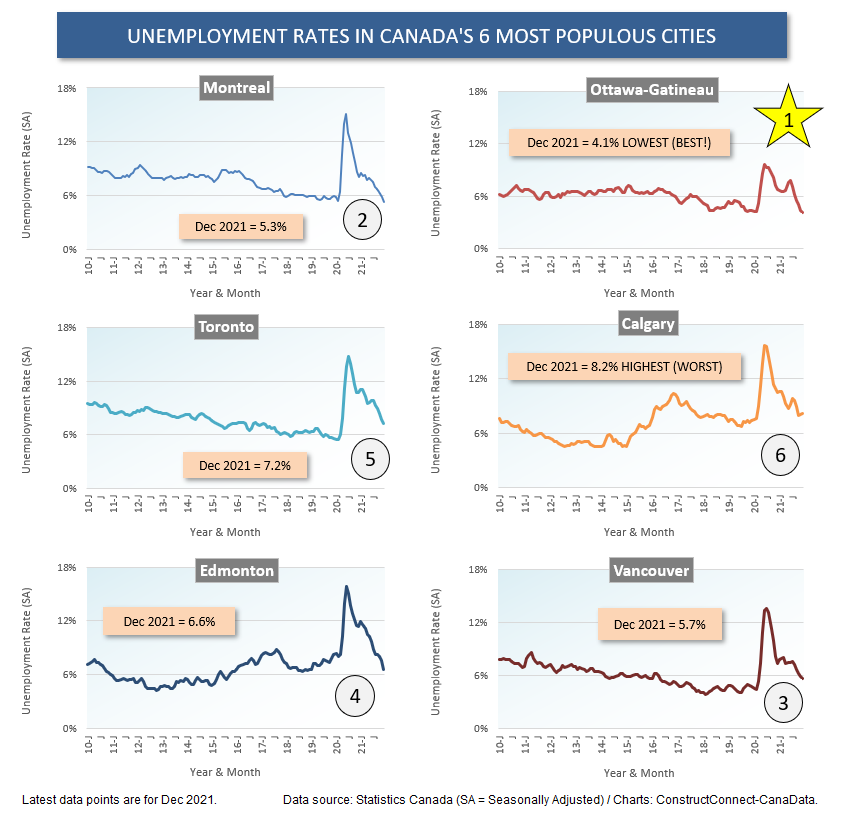
Table 2
Alex Carrick is Chief Economist for ConstructConnect. He has delivered presentations throughout North America on the U.S., Canadian and world construction outlooks. Mr. Carrick has been with the company since 1985. Links to his numerous articles are featured on Twitter @ConstructConnx, which has 50,000 followers.


Recent Comments