
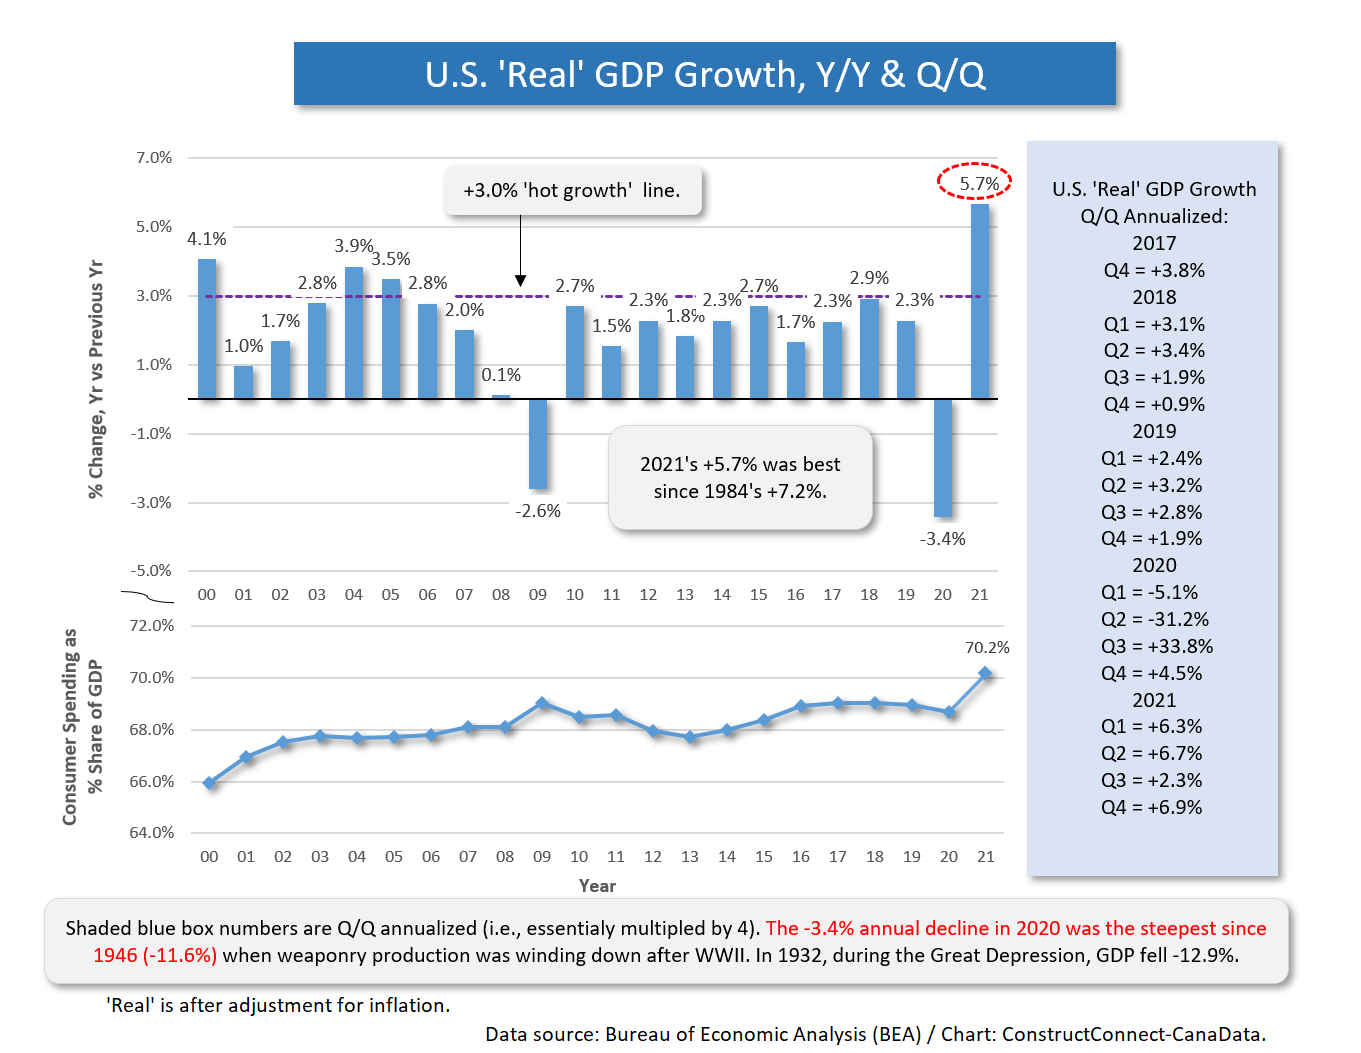
The inflation-adjusted dollar volume of U.S. gross domestic product (GDP) in 2020 fell steeply (-3.4% year over year), so perhaps it was only natural that with the loosening of controls first placed on the economy to combat COVID-19, GDP in 2021 would fare much better, +5.7% y/y (Graph 1).
The big leap upwards of +5.7% for U.S. ‘real’ GDP in 2021 was the best annual growth rate since 1984’s +7.2%.
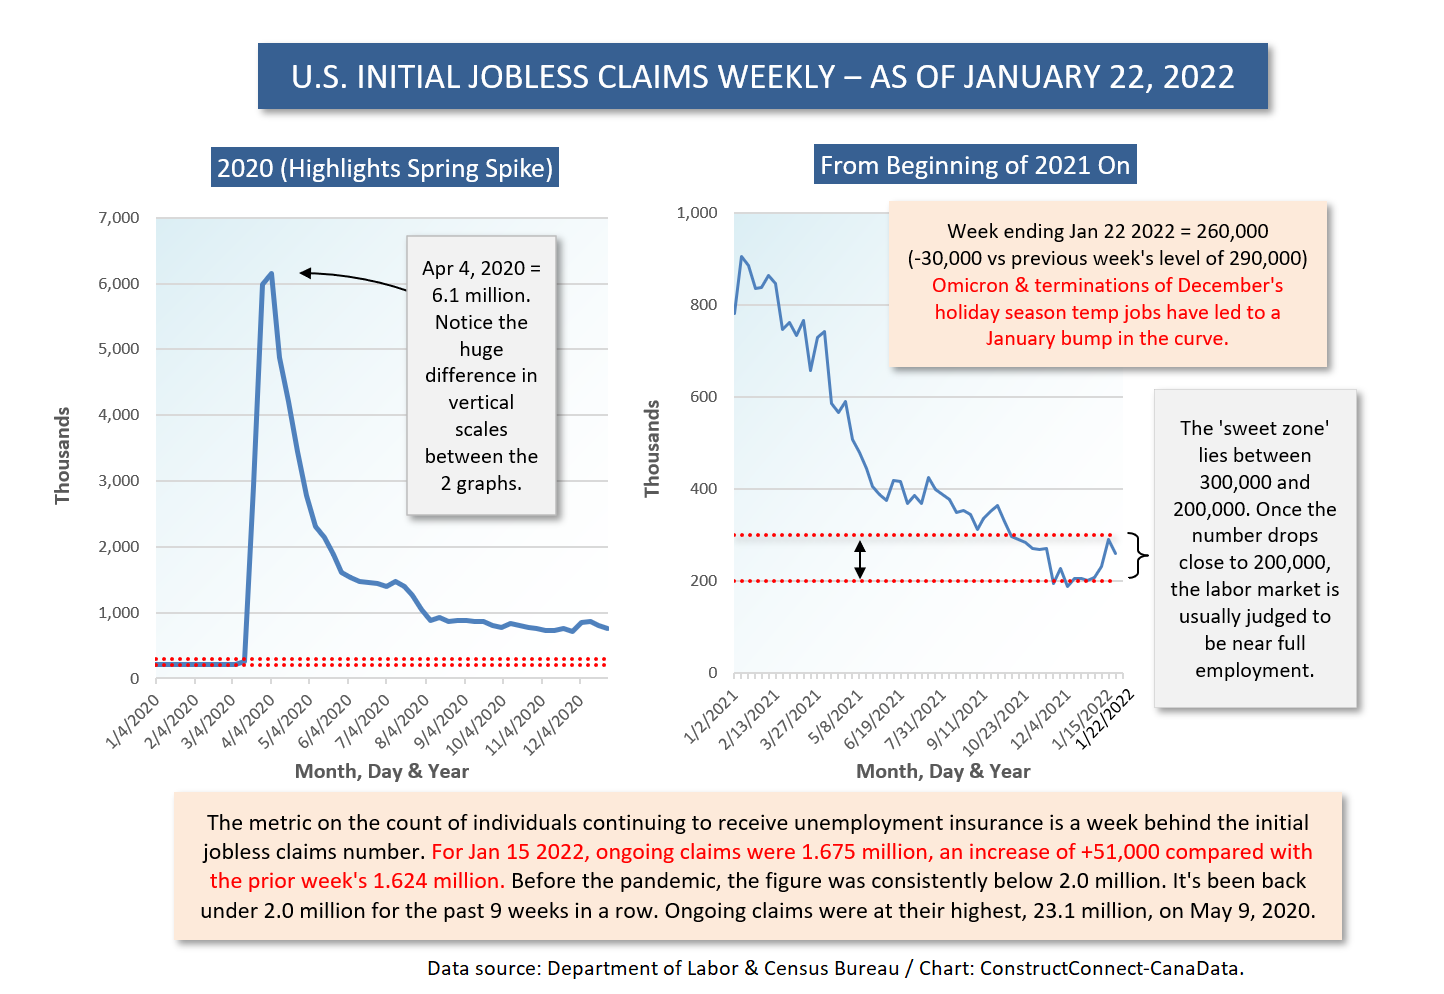
 The coronavirus, especially in its latest iteration, Omicron, is continuing to exert a harmful influence that’s most apparent in the recent uptick in weekly ‘initial jobless claims’ numbers (Graph 2). But with extensive vaccination coverage, and the vast spread of the disease throughout the population, a return to nearly ‘normal’ living has become more pervasive, and the likelihood of being forced to take significant steps backwards again has diminished.
An argument can be made, however, that the pinnacle reached by GDP last year could have been much higher. It was restrained not entirely due to limitations imposed by the health crisis, but also because of problems tied to a key pillar of the economy, foreign trade.
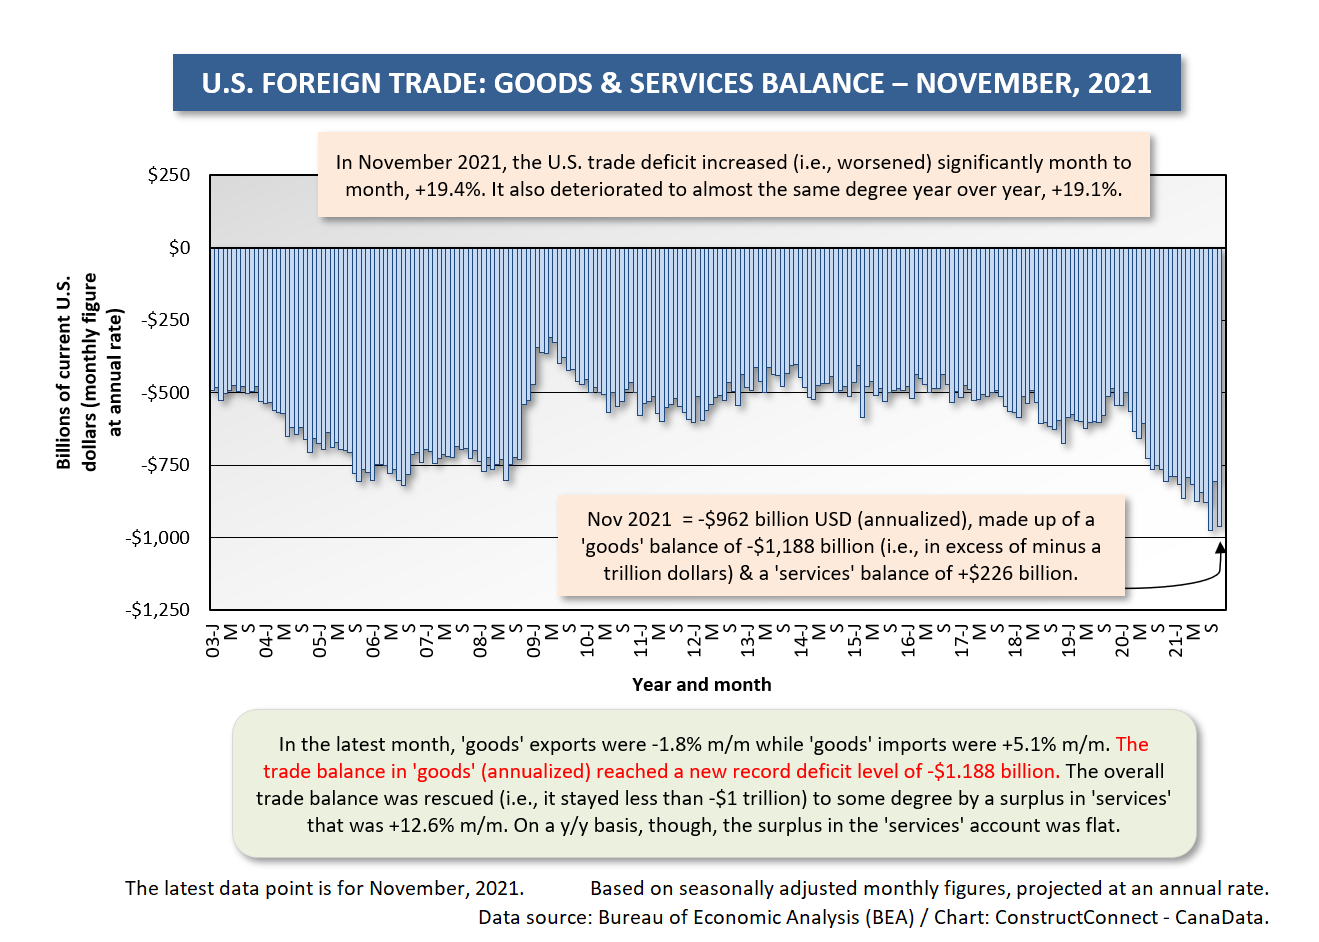
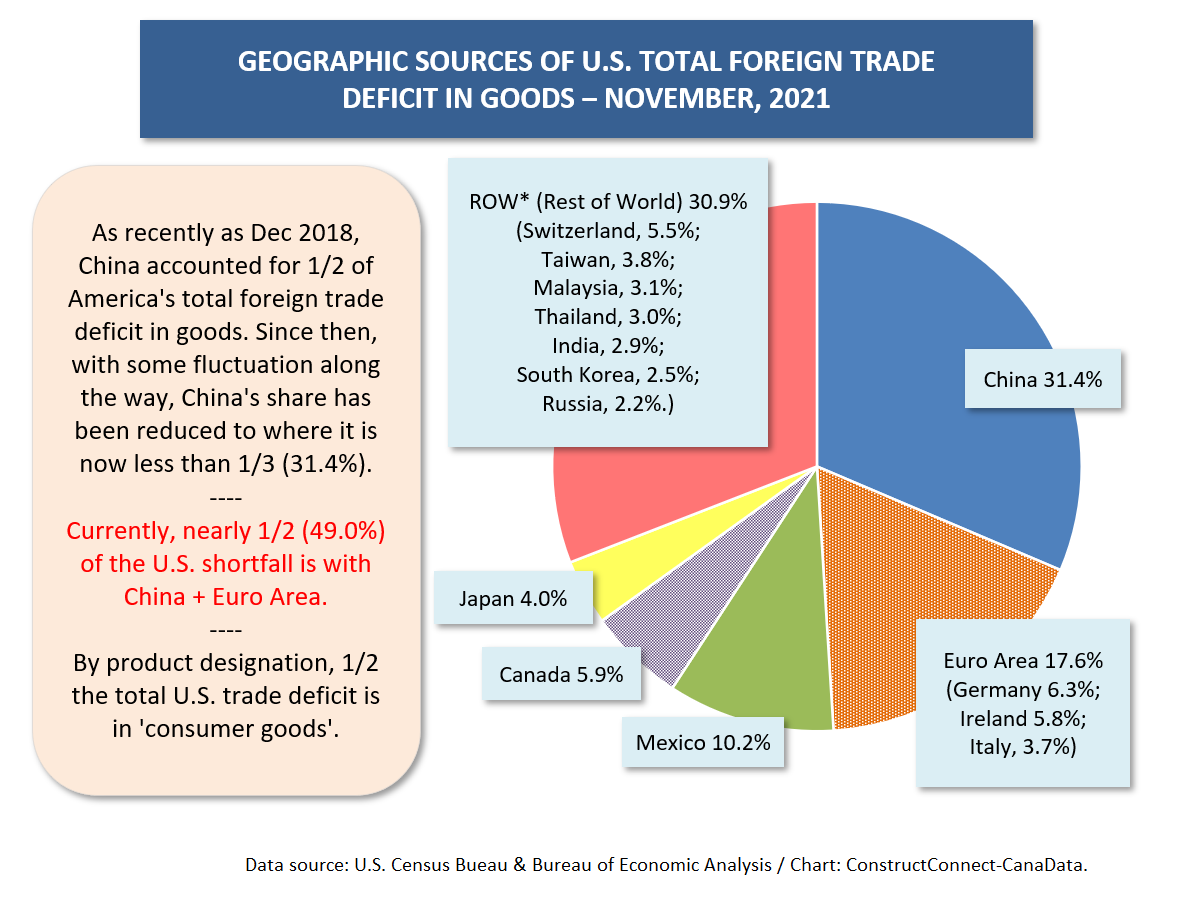
The calculation of exports minus imports forms an important line item in the summation of GDP. Currently, U.S. trade with all other nations combined is steeply – indeed, to a record-setting degree – negative.
Furthermore, the trade shortfall, which is receiving little media attention, is augmenting difficulties in some other hot button areas, such as inflation.
How deep in the hole is America in foreign trade? The goods and services trade balance, for the first time ever, is threatening to exceed -$1 trillion.
What’s known as the merchandise trade balance (i.e., the trade in ‘goods’) has moved beyond minus a trillion dollars and in November 2021, was -$1.2 trillion.
There’s still a services surplus (+$226 billion in November), but it’s not exerting as much of a counterbalancing influence as in the past. (The services trade balance is mainly determined by business and tourism travel and by cargo transportation charges.)
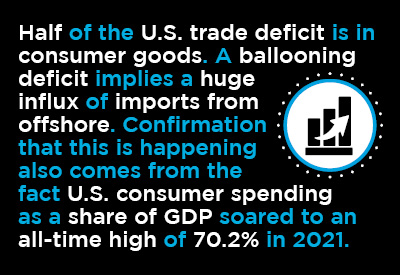
Half of the U.S. trade deficit is in consumer goods. A ballooning deficit implies a huge influx of imports from offshore. Confirmation that this is happening also comes from the fact U.S. consumer spending as a share of GDP soared to an all-time high of 70.2% in 2021 (Graph 1). It’s little wonder there’s been an enormous congregation of ships (i.e., more than 100 freighters at last count) anchored off the Ports of Los Angeles and Long Beach, waiting to be unloaded.
A shortage of workers along the logistics chain has been another headache, but it’s been mainly excess demand that has stoked supply challenges and spurred price inflation to a 21st century high of +7.0% y/y.
If more of that excess demand were being met by domestic suppliers, there would be less displacement of consumer spending in GDP through the foreign trade account. Take heed construction sector; this is the moment to speak about the great benefits to be realized from expanded private sector capital investment, to enlarge production facilities, at home.
Finally, Good News for Canada on Trade Front
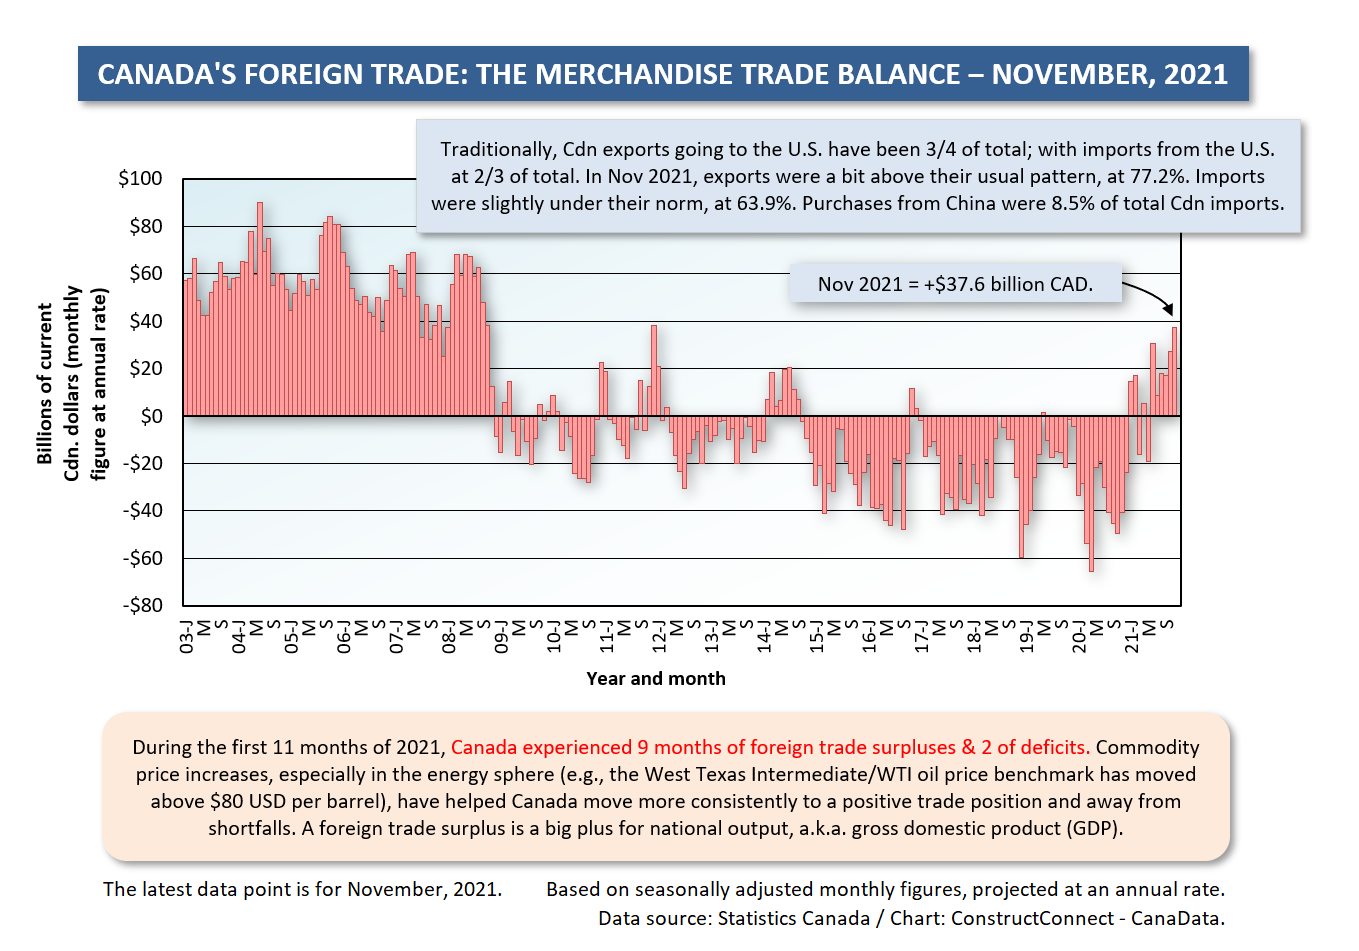
Canada’s official annual GDP results for 2021 won’t be available for another month. But Canada may surprise on the plus side, if not for the latest quarter (Q4 2021), then for the periods ahead, because foreign trade has finally, after more than a decade, become a good news story (Graph 5).
Through November of last year, there were nine months of merchandise (i.e., ‘goods’) trade surpluses and only two of deficits. November’s figure of +$38 billion CAD (annualized) was the highest since mid-2011.
Particularly helpful have been climbs in the price of oil, with West Texas Intermediate (WTI) crude moving close to $90 USD per barrel, and Western Canada Select (WCS) near $75 USD per barrel. The price of natural gas has also moved up, from a range of $2-to-$3 USD per mcf for a long while, to close to $5 USD per mcf presently (although not long ago, it was briefly at $6 USD per mcf).
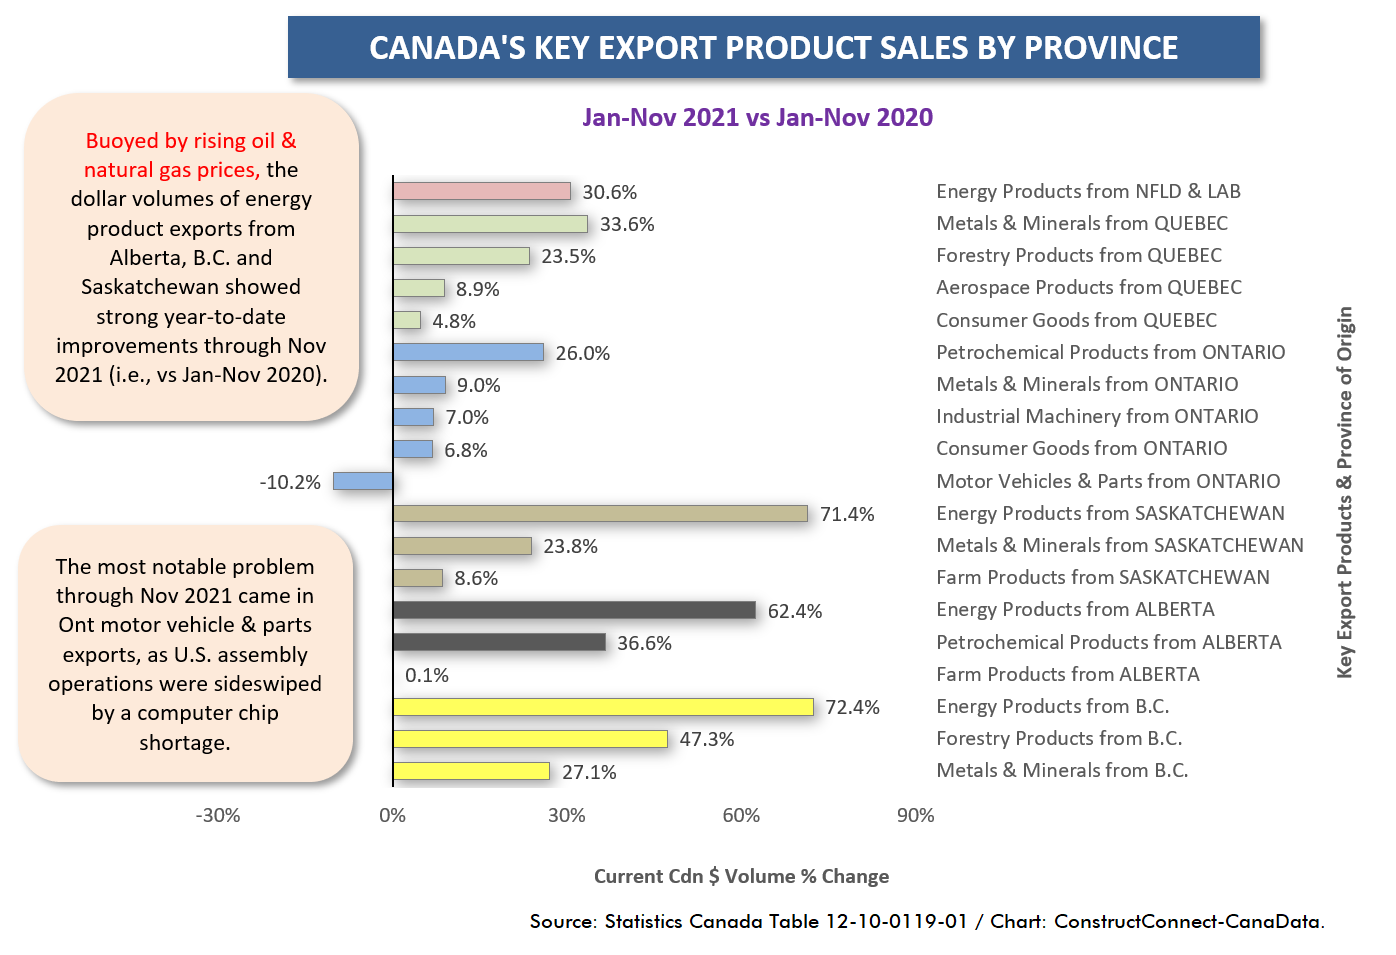
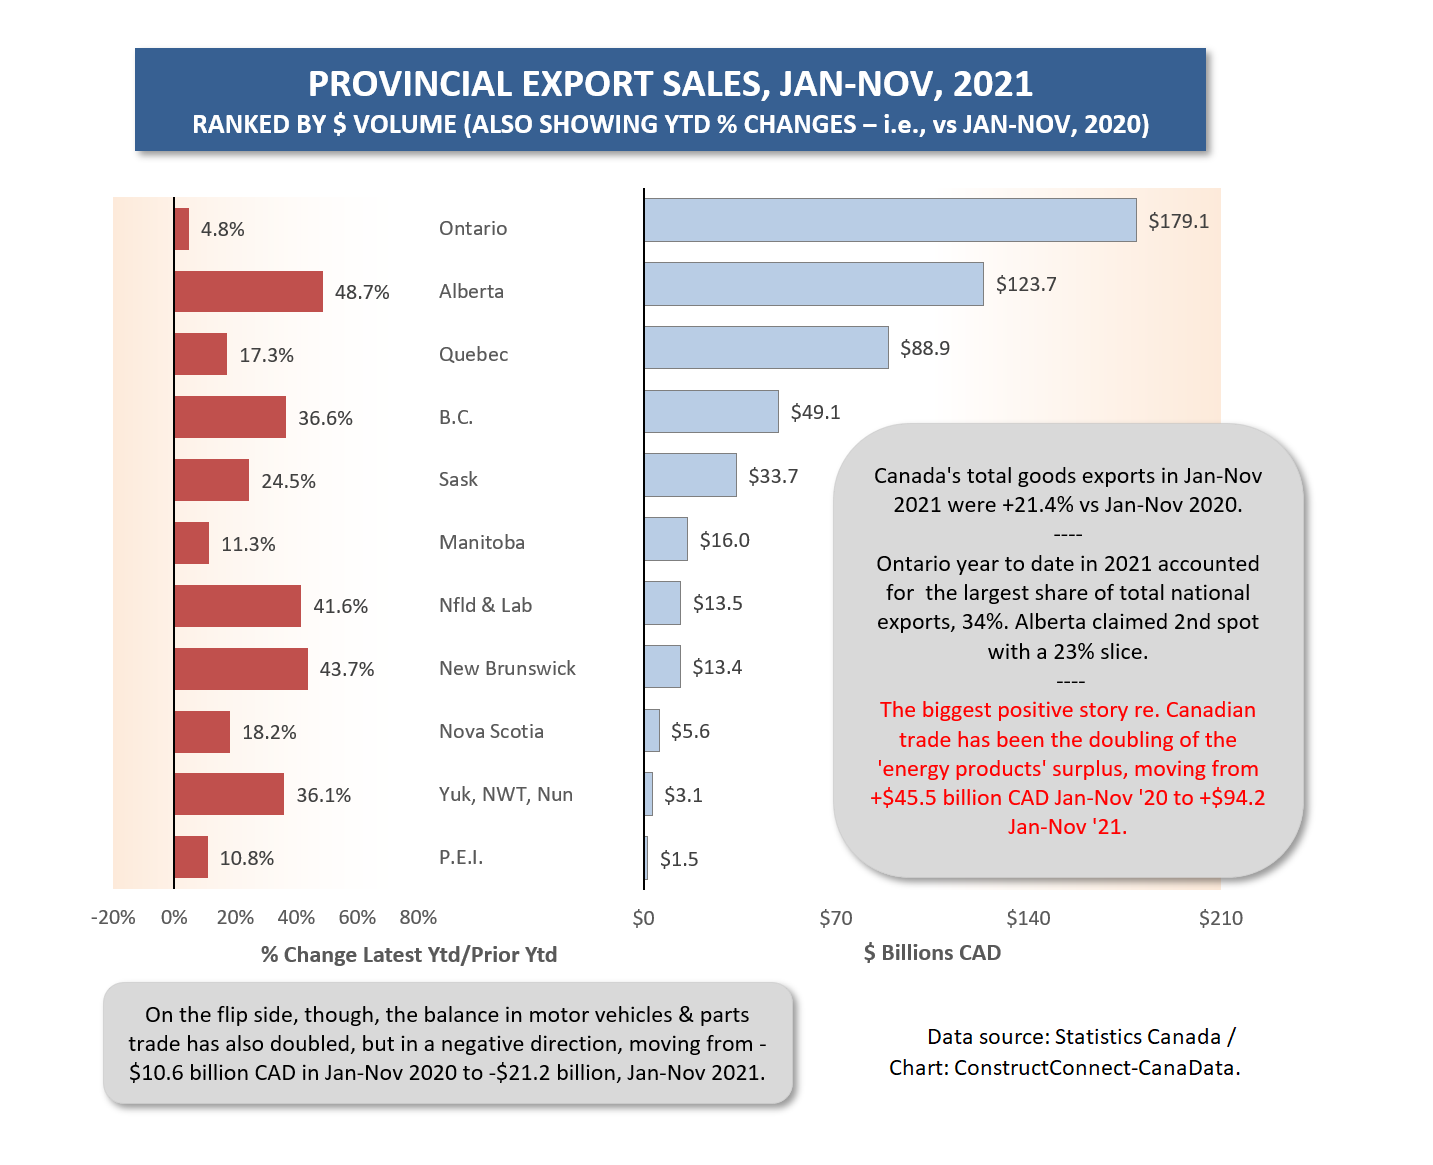
In November 2021, the year-to-date dollar volumes of energy product export sales were +72.4% in British Columbia, +71.4% in Saskatchewan, +62.4% in Alberta and +30.6% in Newfoundland and Labrador, versus Jan-Nov 2020 (Graph 6).
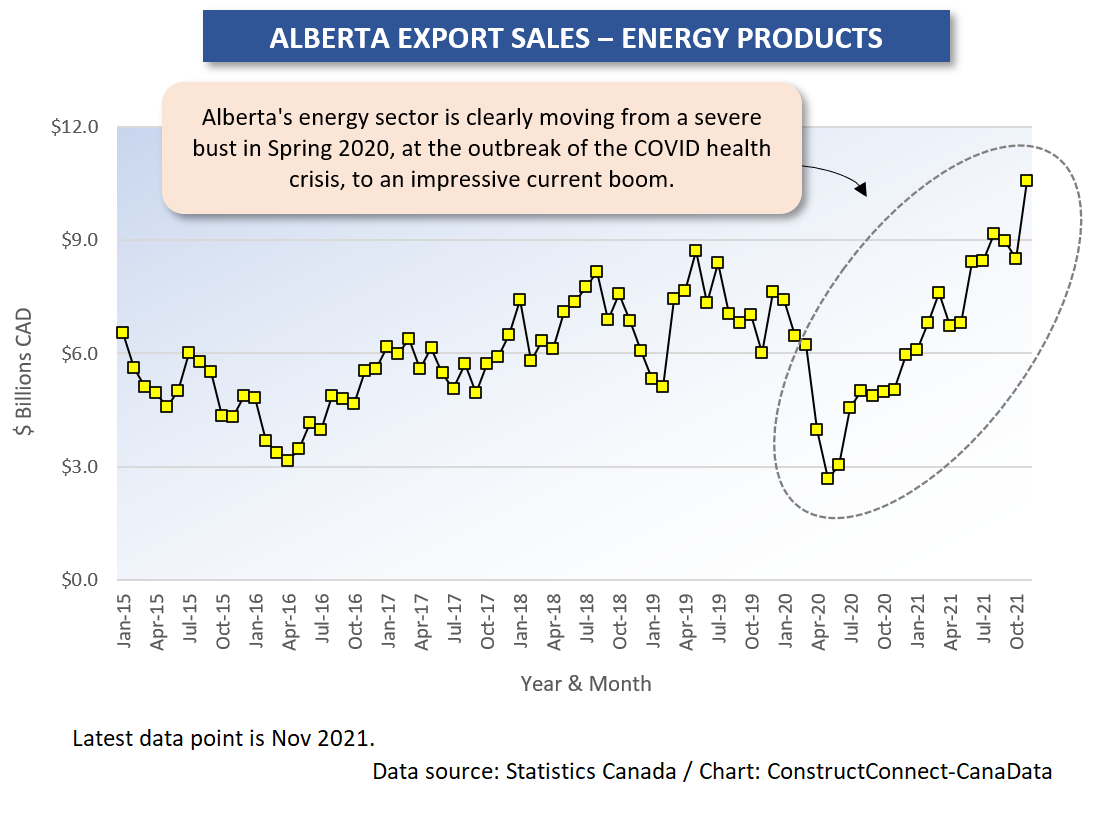
By nominal dollar volume, energy export sales by Alberta are by far the largest. They have been trending up nicely since May2020 (Graph 7).
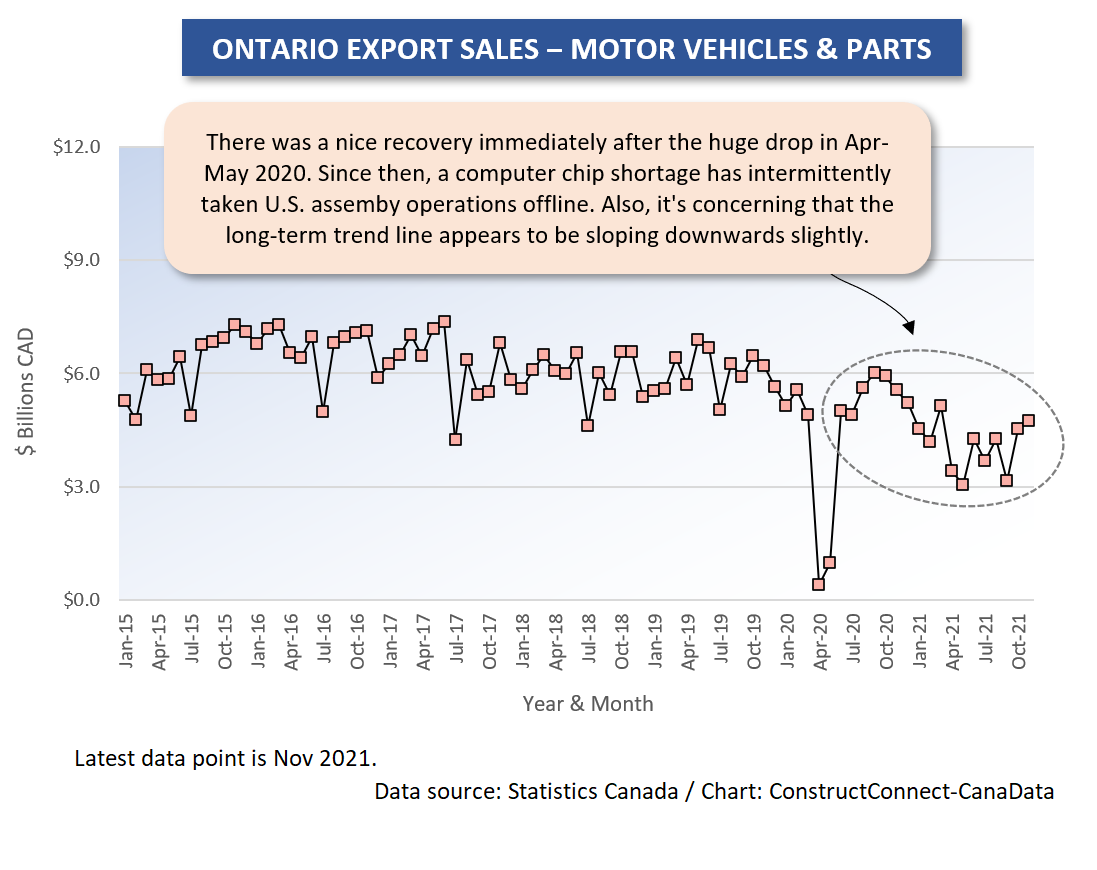
A little worrisome has been the pattern of motor vehicle and parts export sales originating in Ontario (Graph 8). Most recently, there has been weakness due to assembly operations in both countries being hamstrung by a lack of computer chips. Intel is committing to giant expansions of chip manufacturing capacity in Arizona and Ohio.
Separate from the most recent slide in the curve, though, there appears to have been a slight downwards slope in Ontario’s motor vehicle and parts export sales from 2015 through 2019.
Ford and GM have announced big investment plans in Oakville and Oshawa. But they’re not as substantial as what is being earmarked by the two automakers for electric vehicle and battery plants in Michigan, Kentucky and Tennessee.
Graph 1
Graph 2
Graph 3
Graph 4
Graph 5
Graph 6
Graph 7
Graph 8
Graph 9
Alex Carrick is Chief Economist for ConstructConnect. He has delivered presentations throughout North America on the U.S., Canadian and world construction outlooks. Mr. Carrick has been with the company since 1985. Links to his numerous articles are featured on Twitter @ConstructConnx, which has 50,000 followers.


Recent Comments