When talking with developers and design firms these days, the discussion will quickly turn to the extraordinarily rapid upticks in material and other construction input costs and how they are causing some owners to put project go-aheads on pause while they go back to their teams for suggestions on possible alterations that will return estimated costs closer to initial estimates.
For input prices (or costs, depending on one’s perspective), the most readily available and comprehensive data comes from the Producer Price Index (PPI) material published by the Bureau of Labor Statistics (BLS).
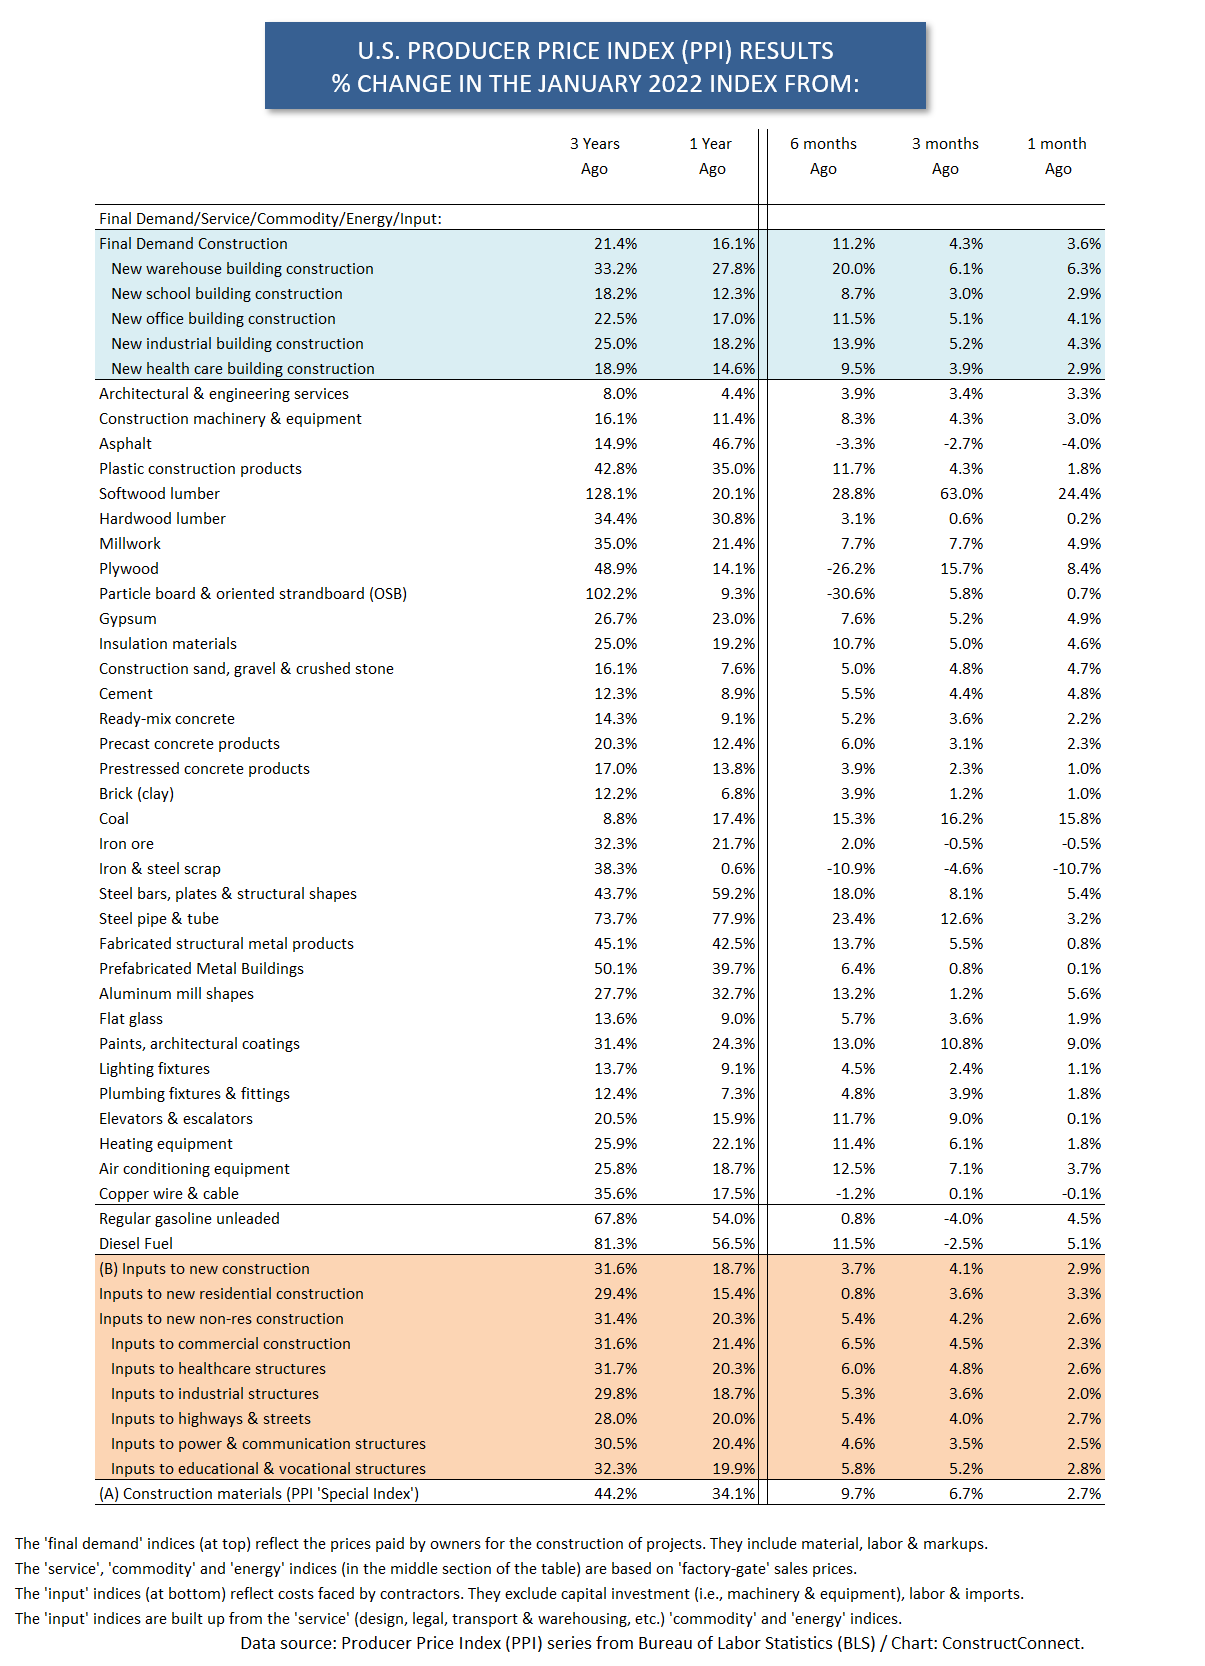
 Among the PPI series are two composite construction input cost series. For ease of identification, they appear as (A) and (B) in Table 1. (A) is the last line in the whole table and (B) is the top line in the ochre-shaded section.
There is decade’s worth of history for the index denoted by (A). But the number of material components that make up the composite result in (A) is quite limited. (B) is more comprehensive as to content, but it includes some items that aren’t strictly materials, such as transportation charges. Also, it has a shorter history.
Presently, (A) is +34.1% year over year and (B) is +18.7% y/y.
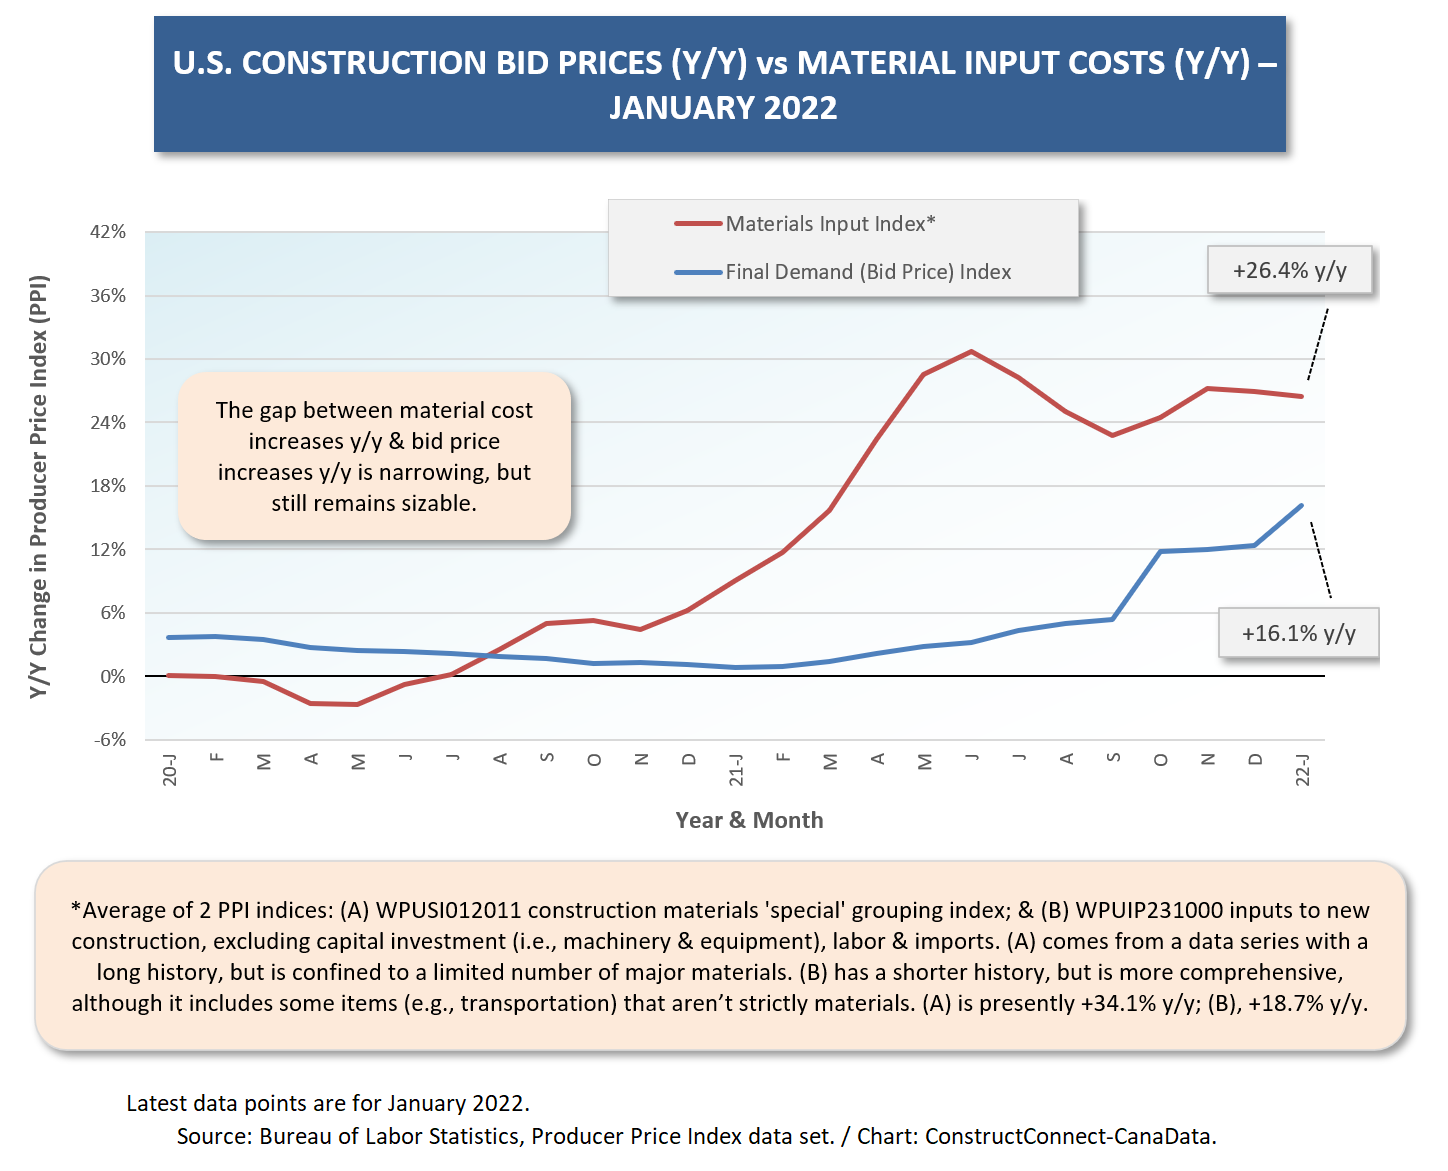
At the top of Table 1 is a ‘final demand price index’, which is interpreted by analysts as the ‘bid price index’. The bid price index in January 2022 was +16.1% y/y.
The y/y results for the bid price index and for the two material input indices (A) and (B) averaged are shown in Graph 1. The huge disadvantage for contractors (i.e., in terms of ‘margin’ squeeze) became most extreme in June of last year. The gap has since diminished, but it remains immense.
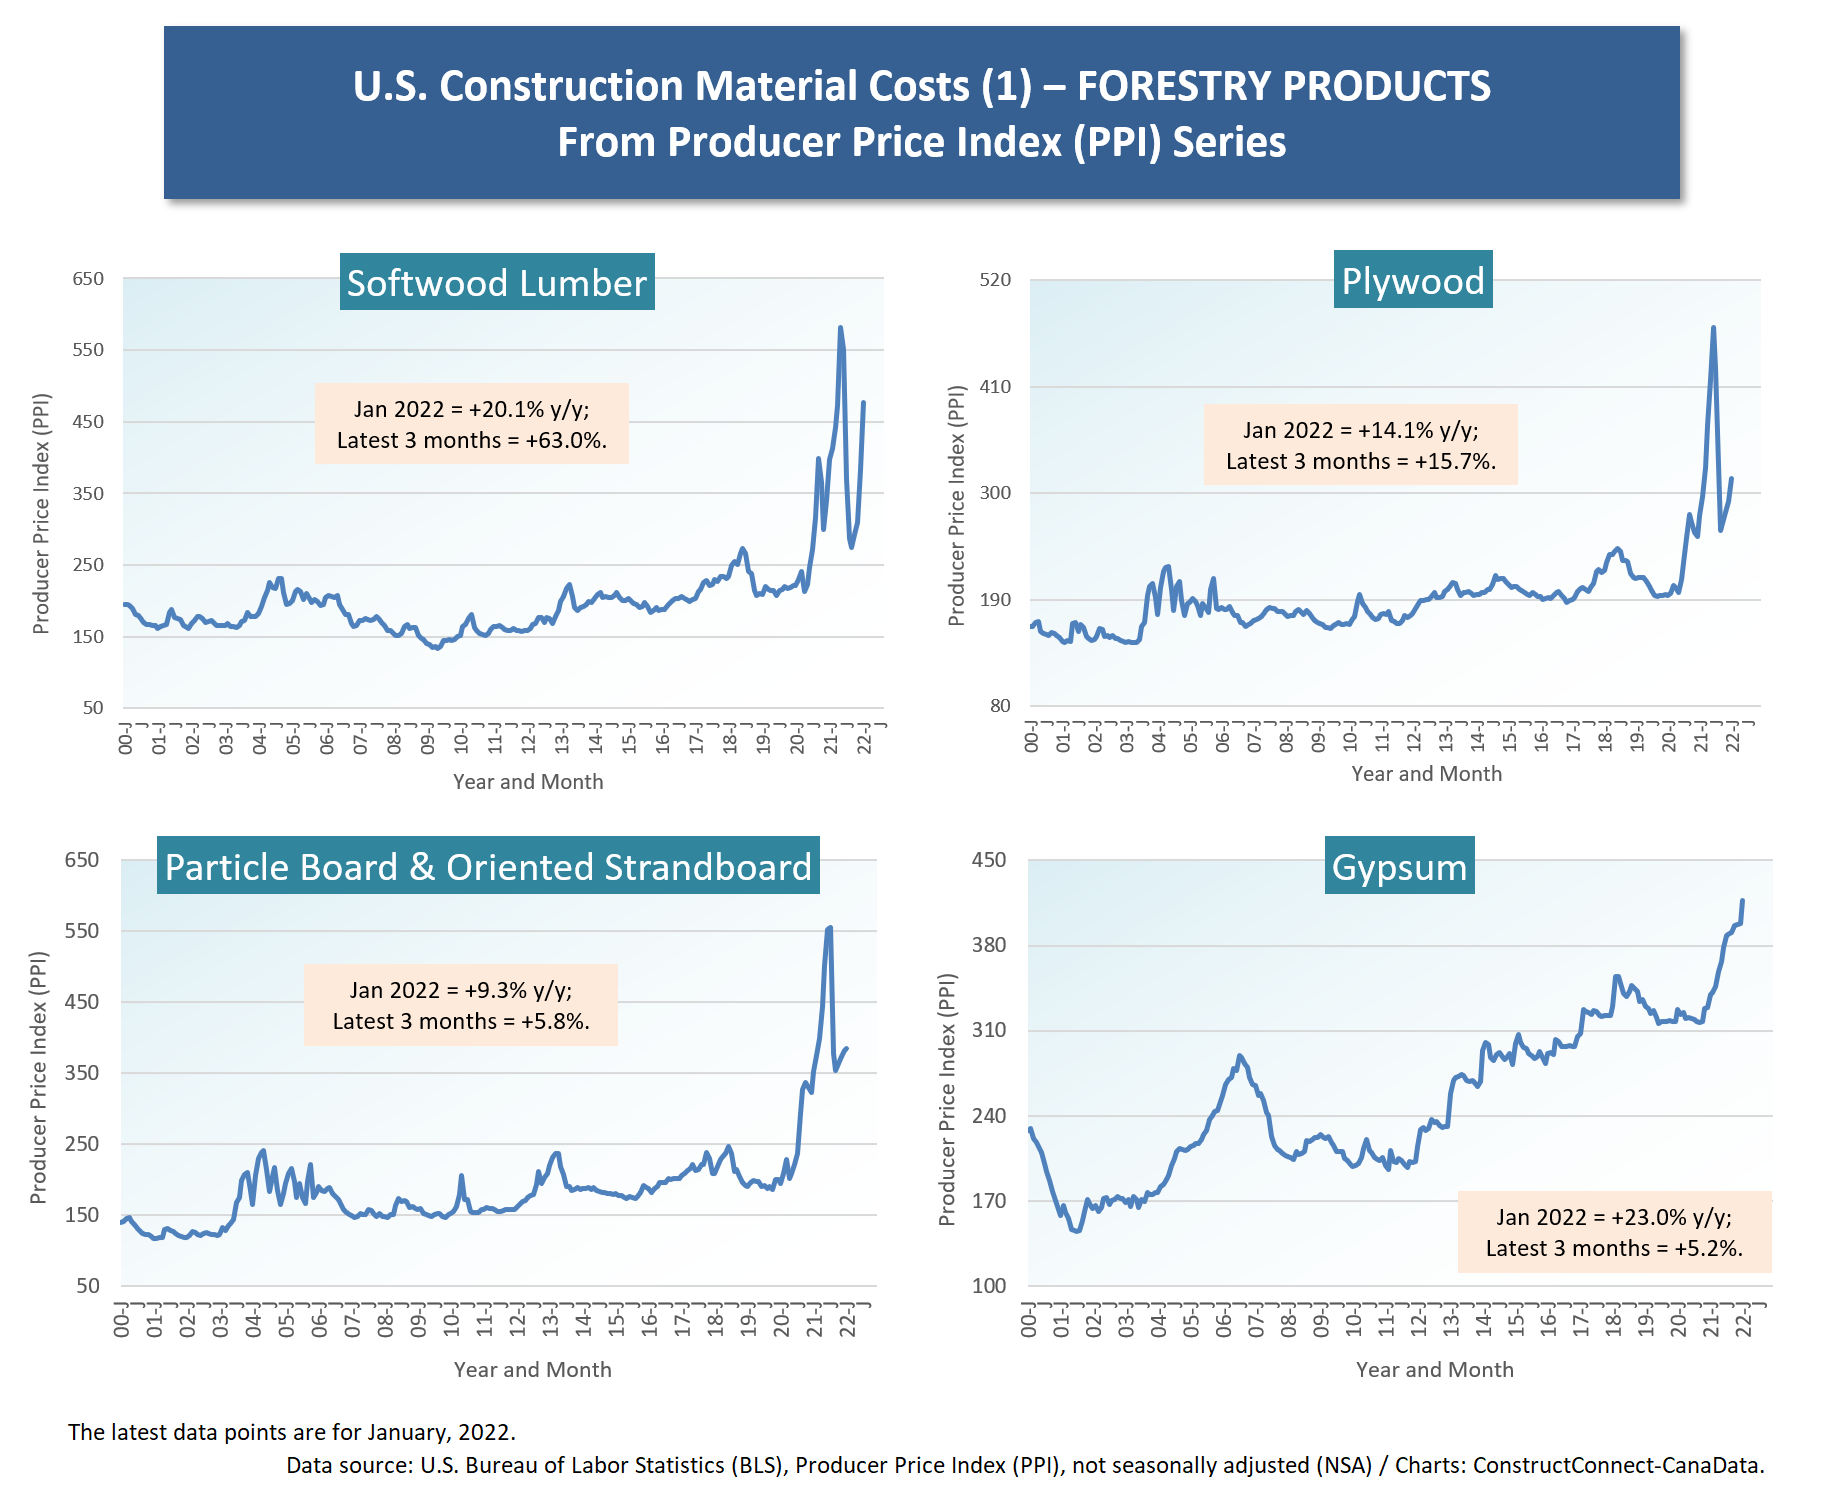
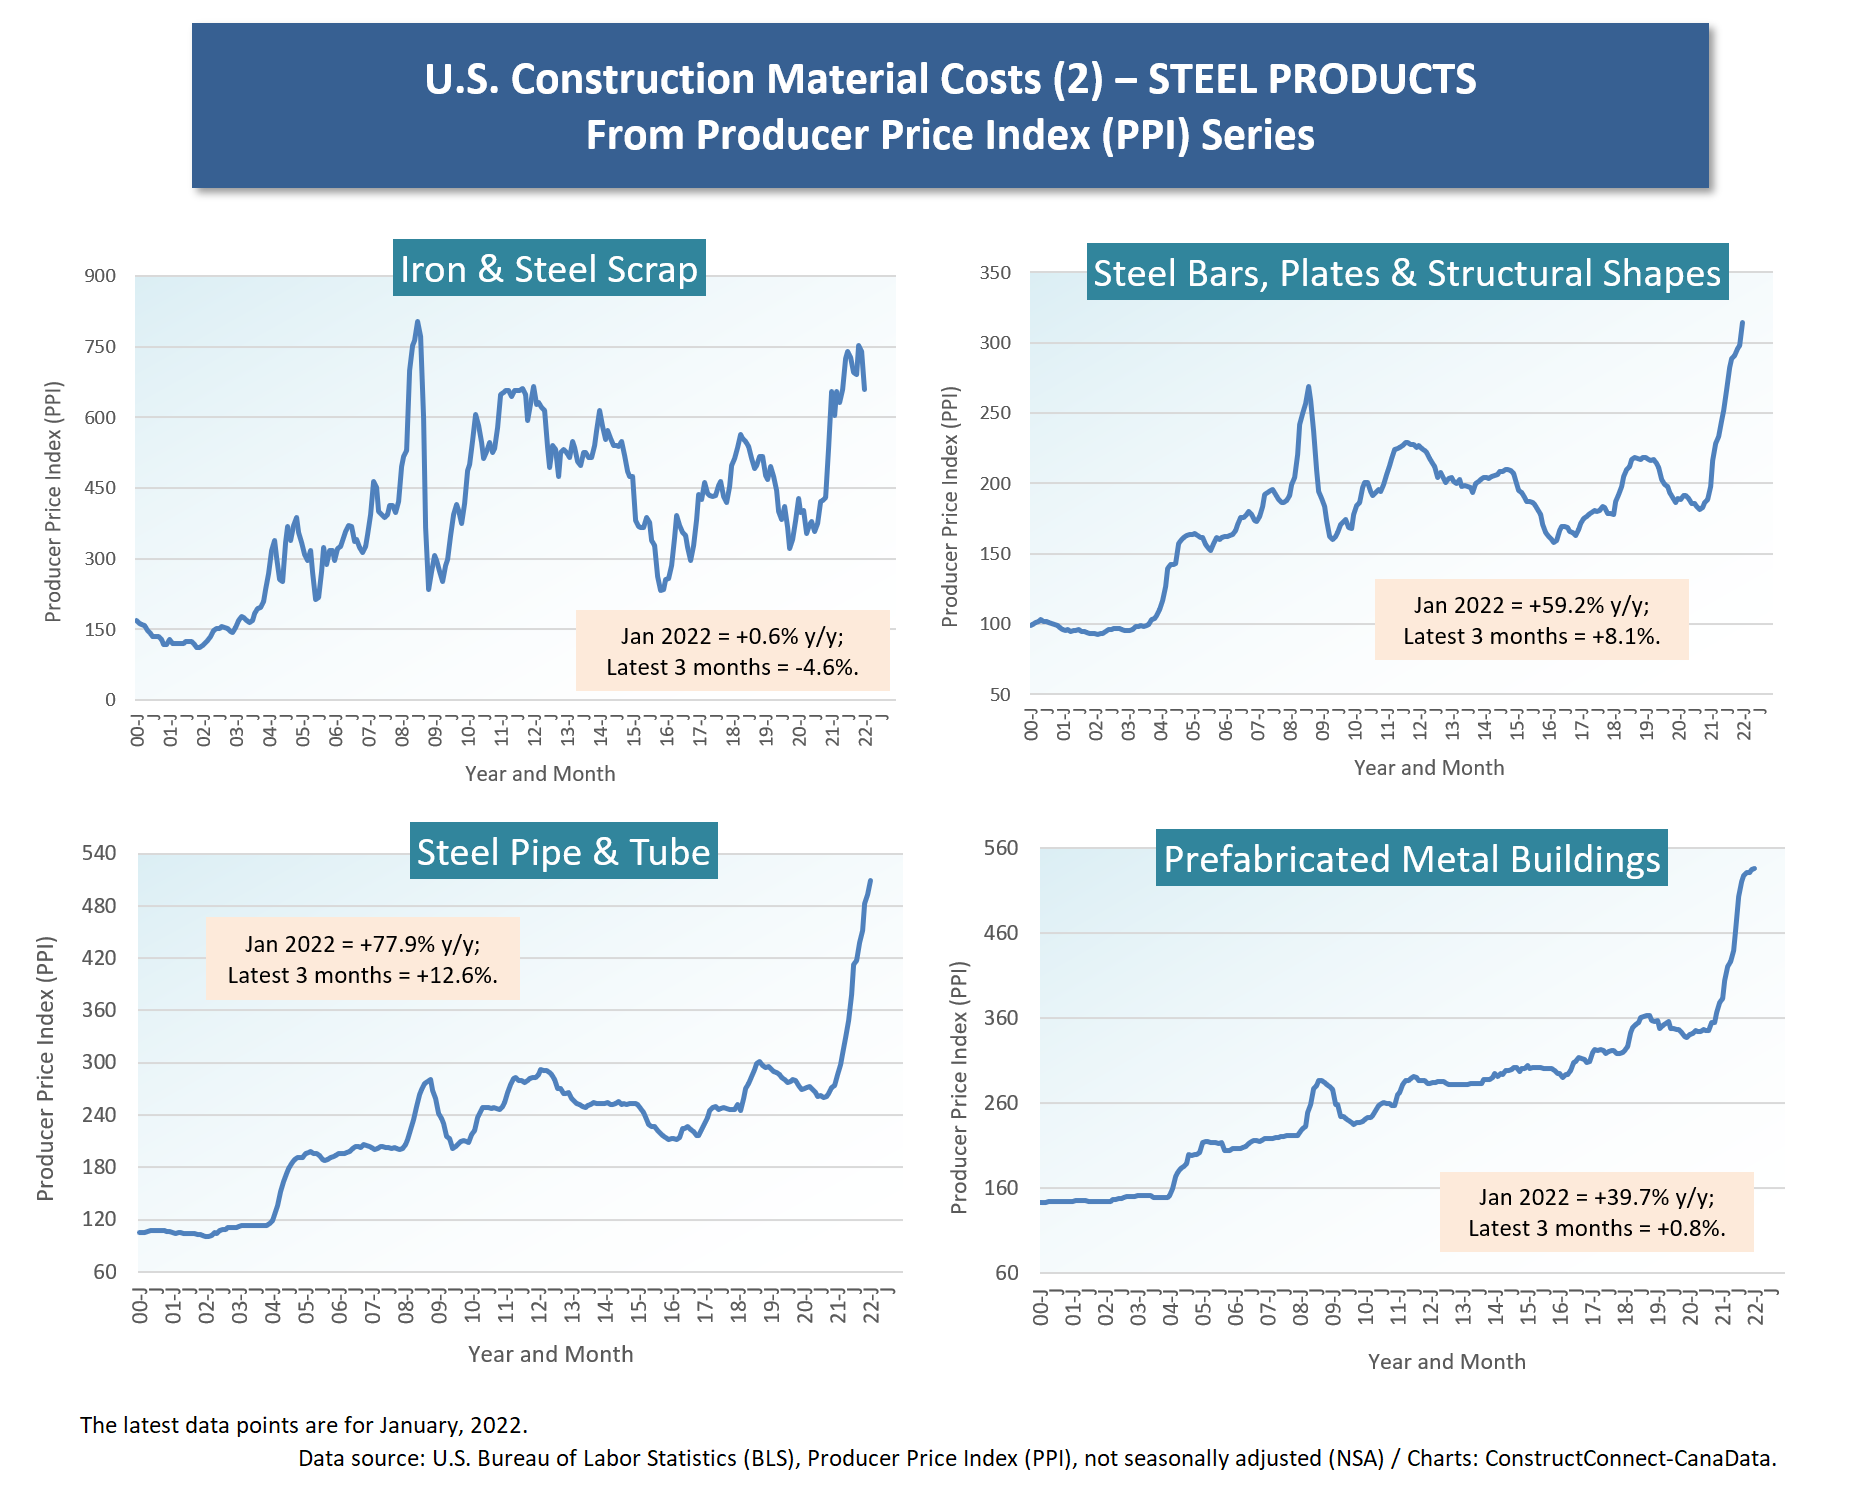
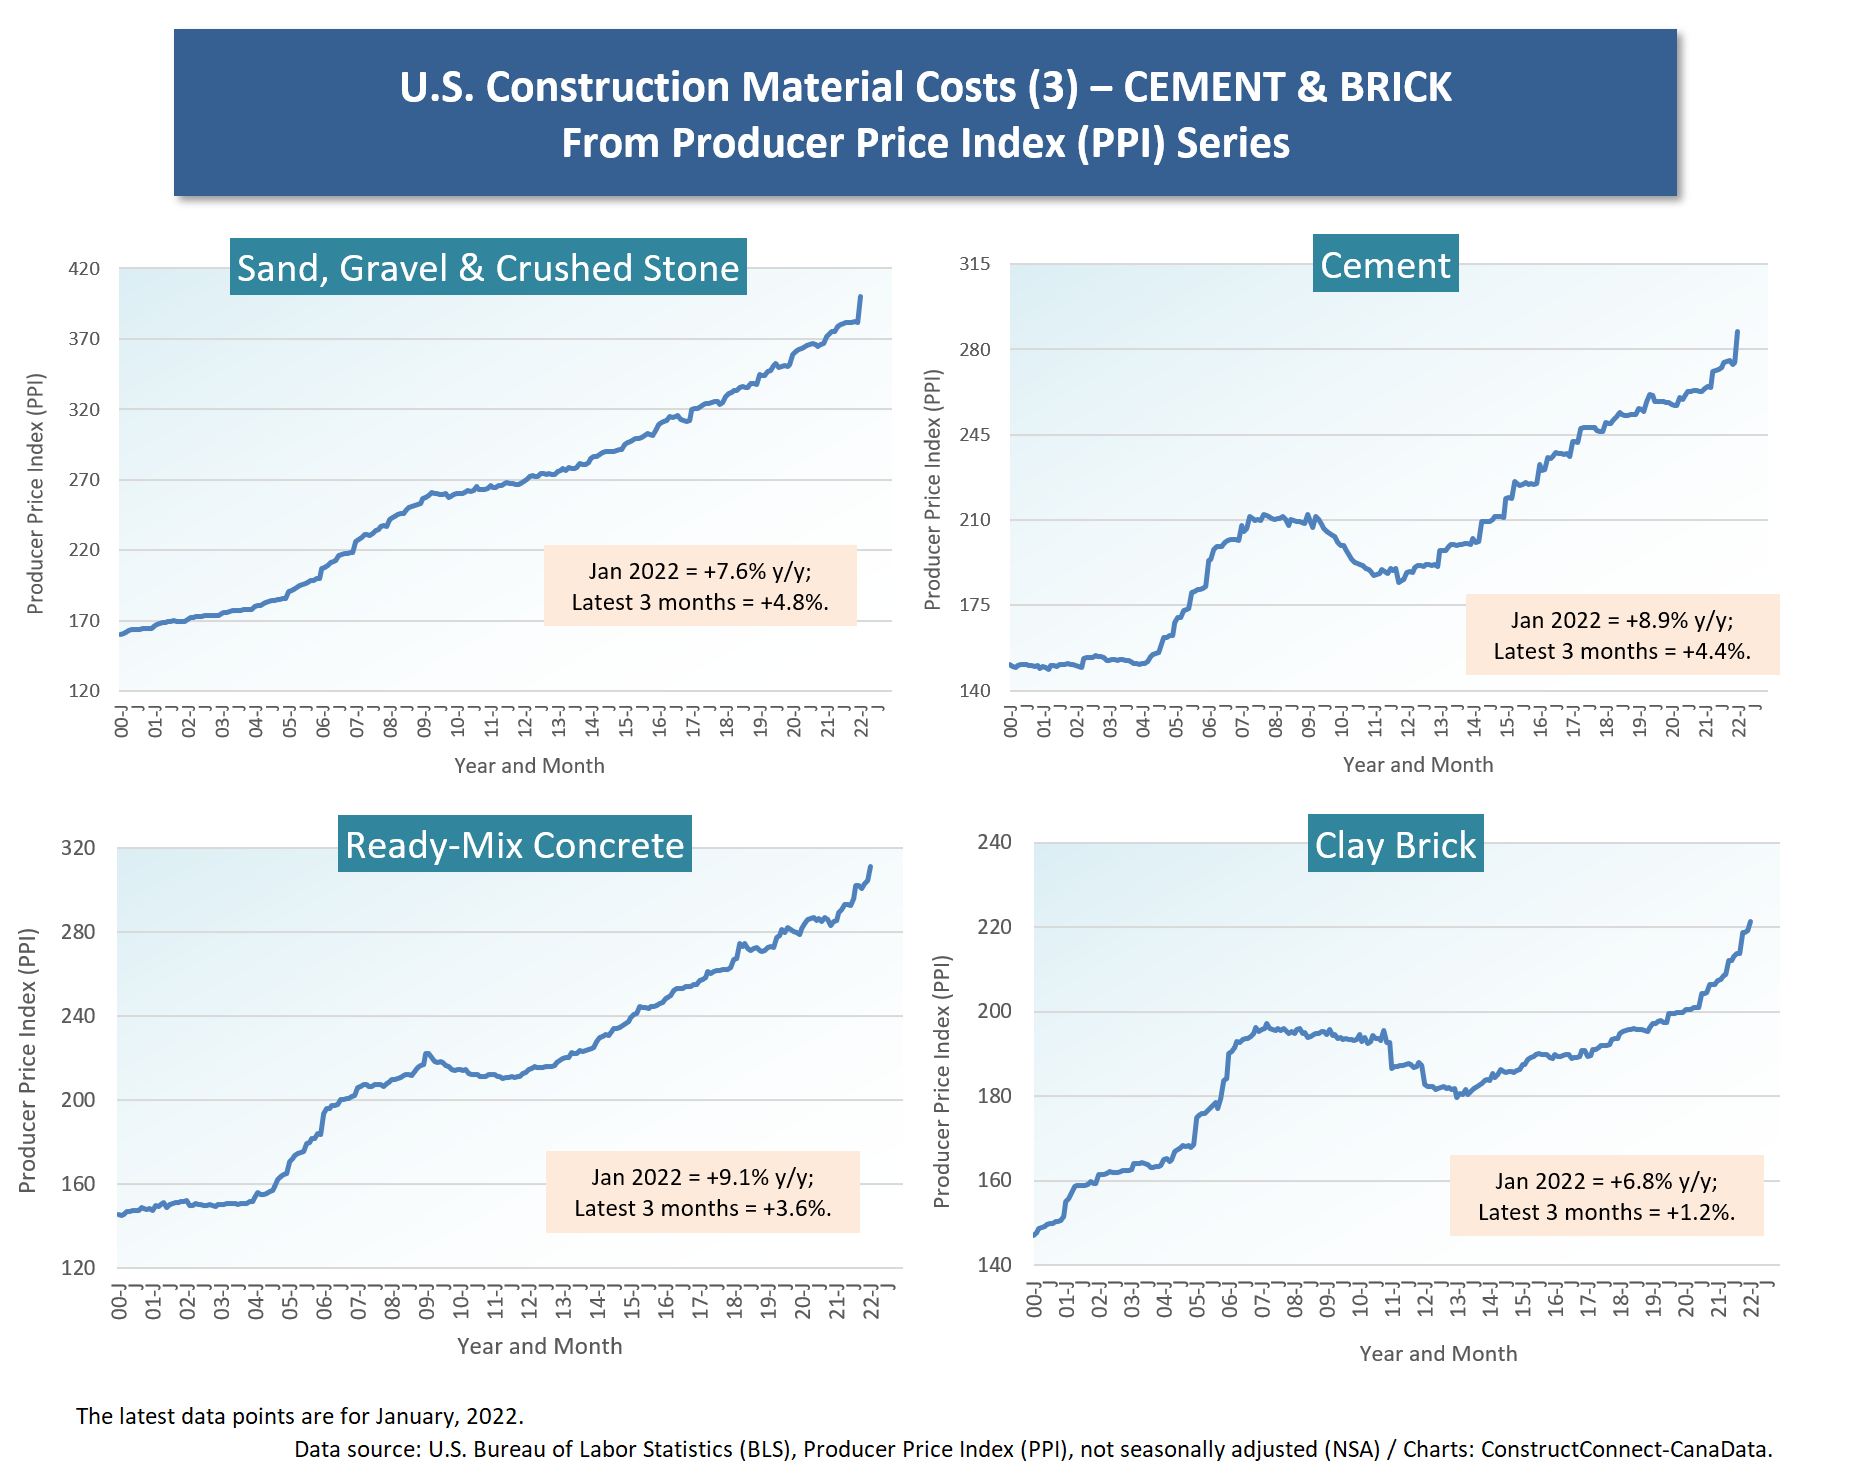
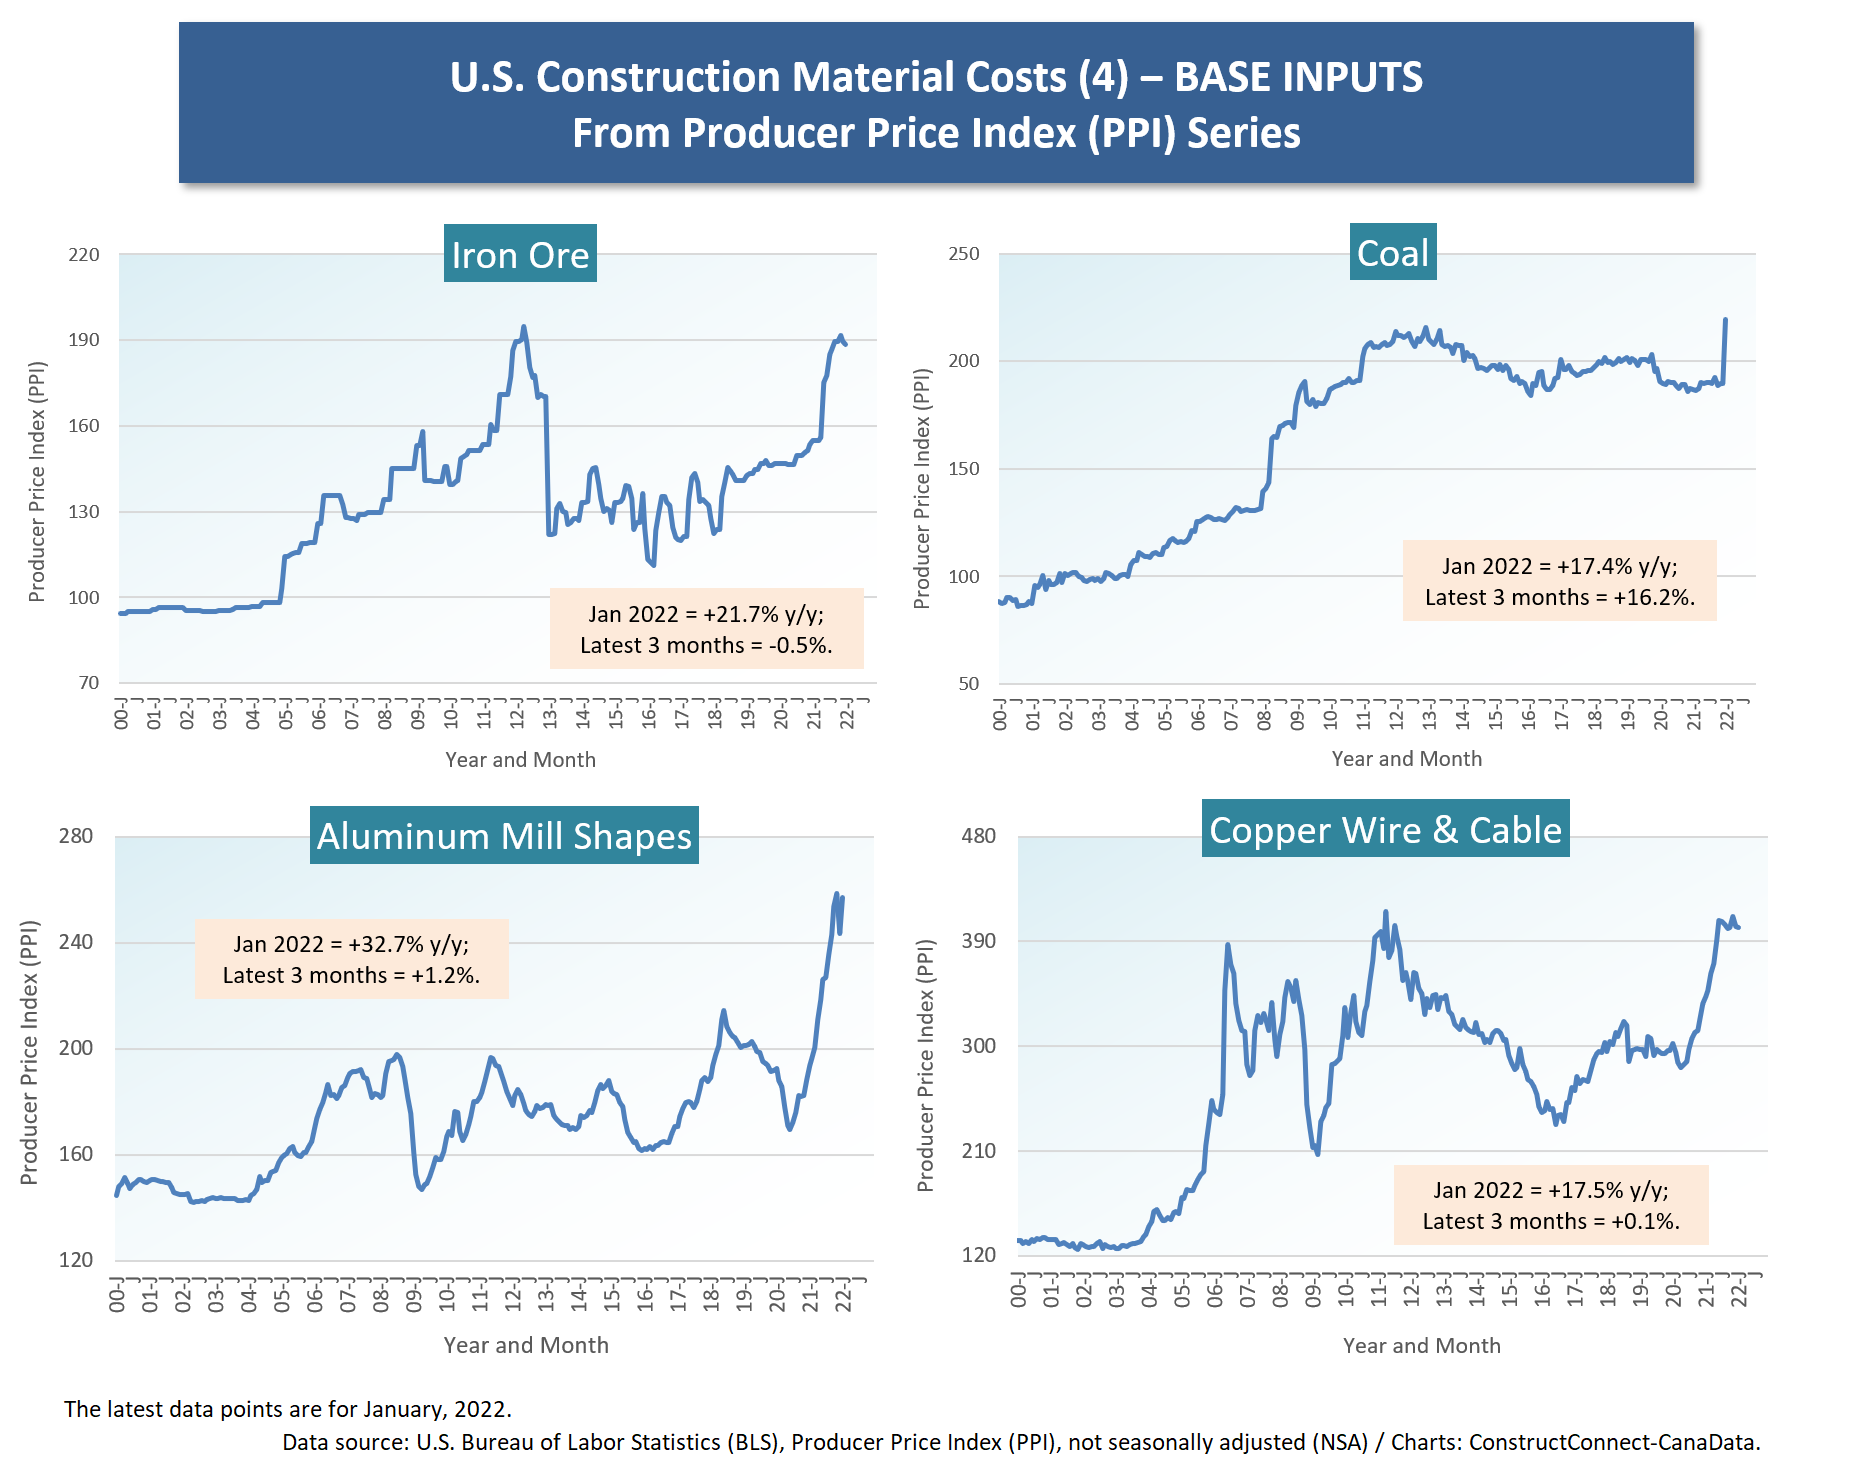
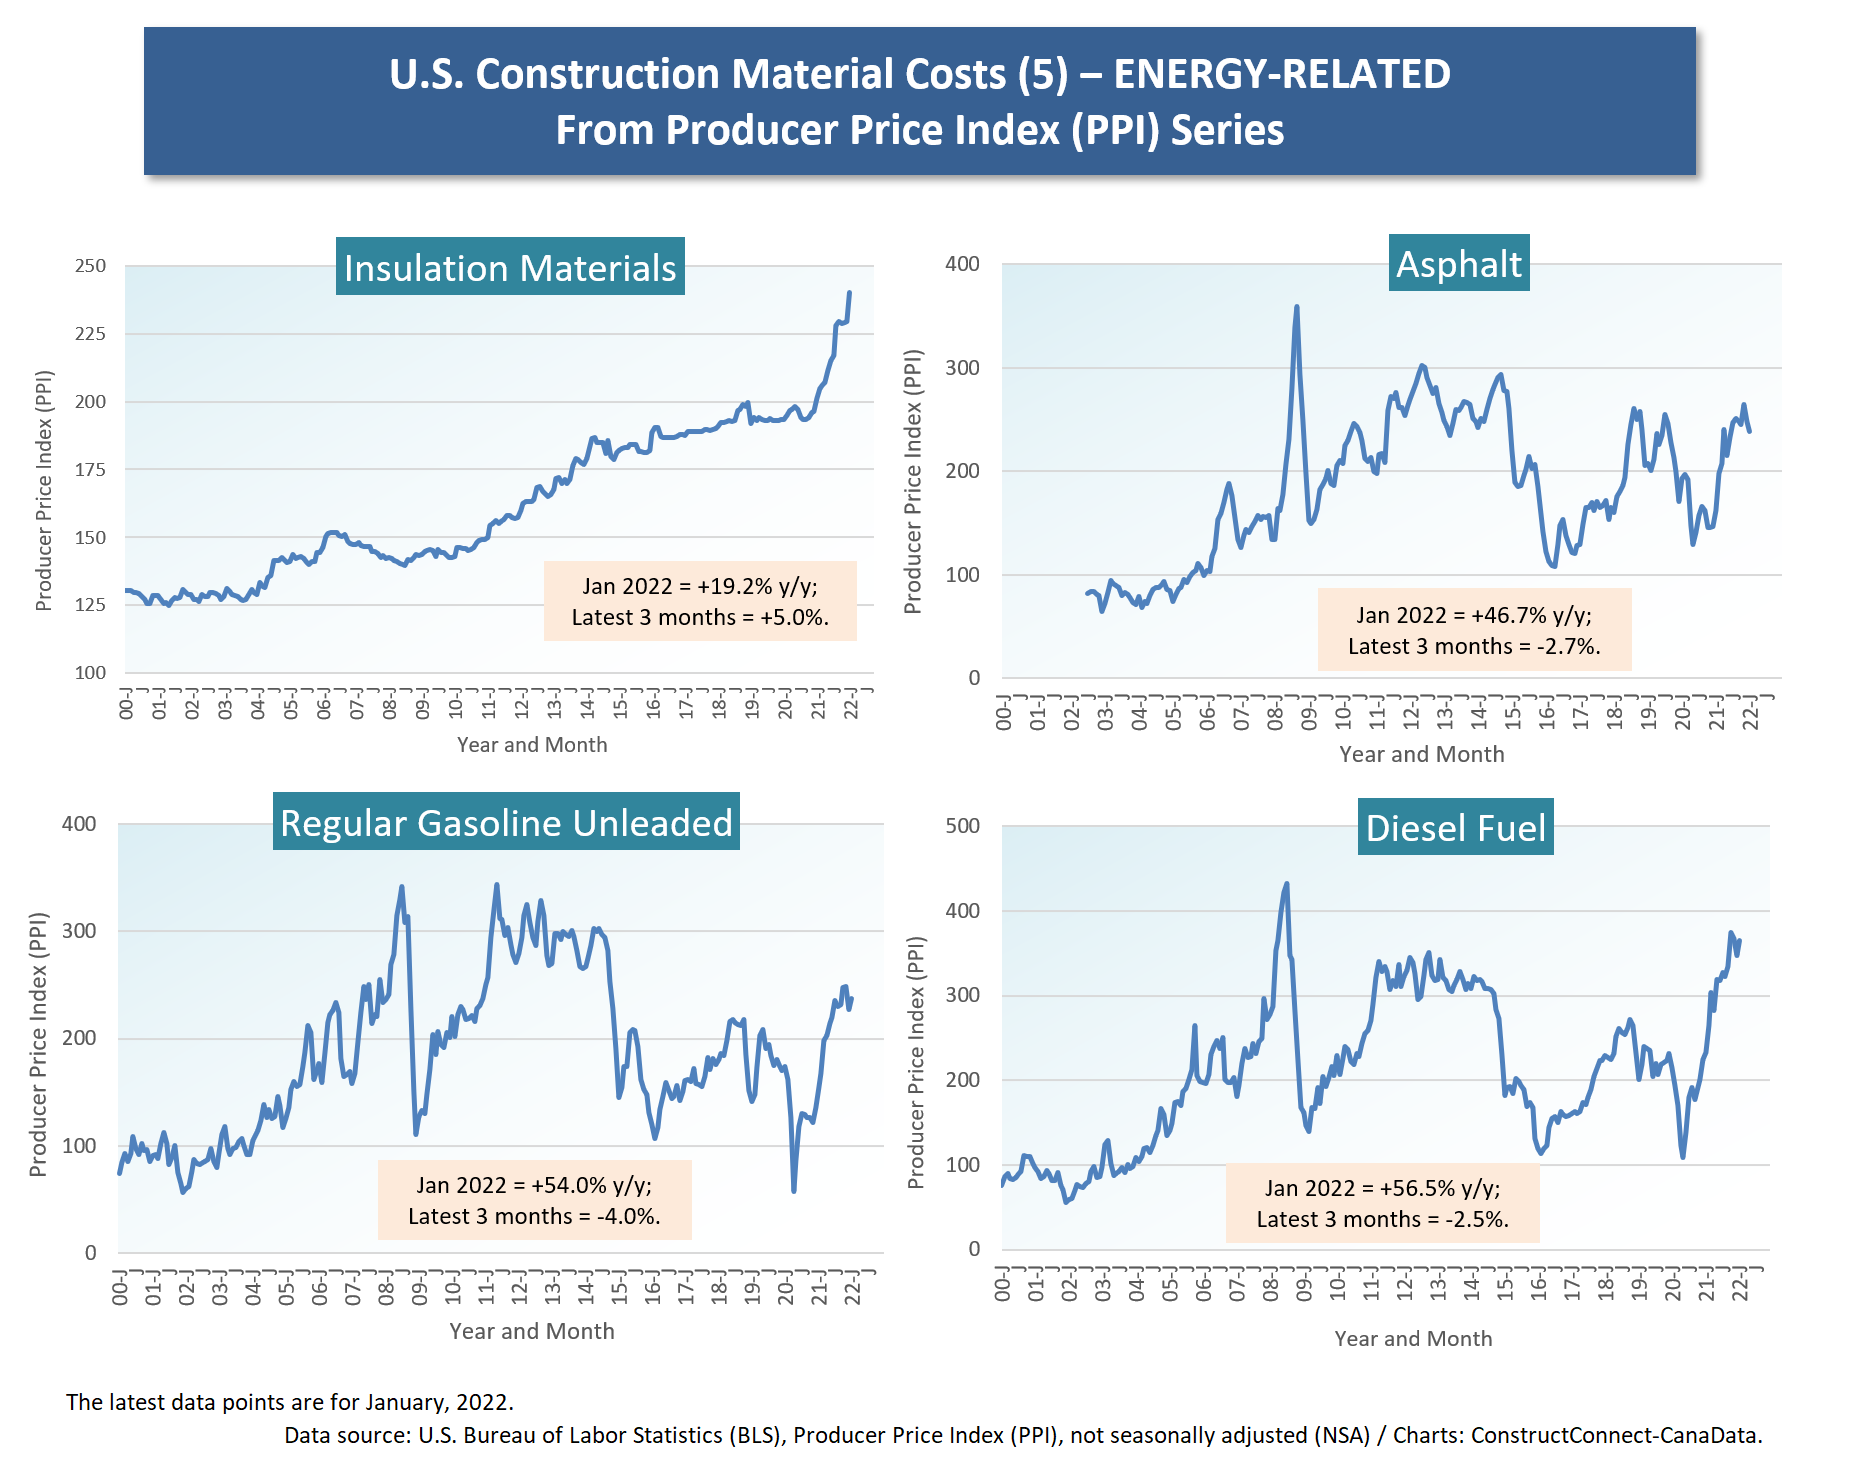
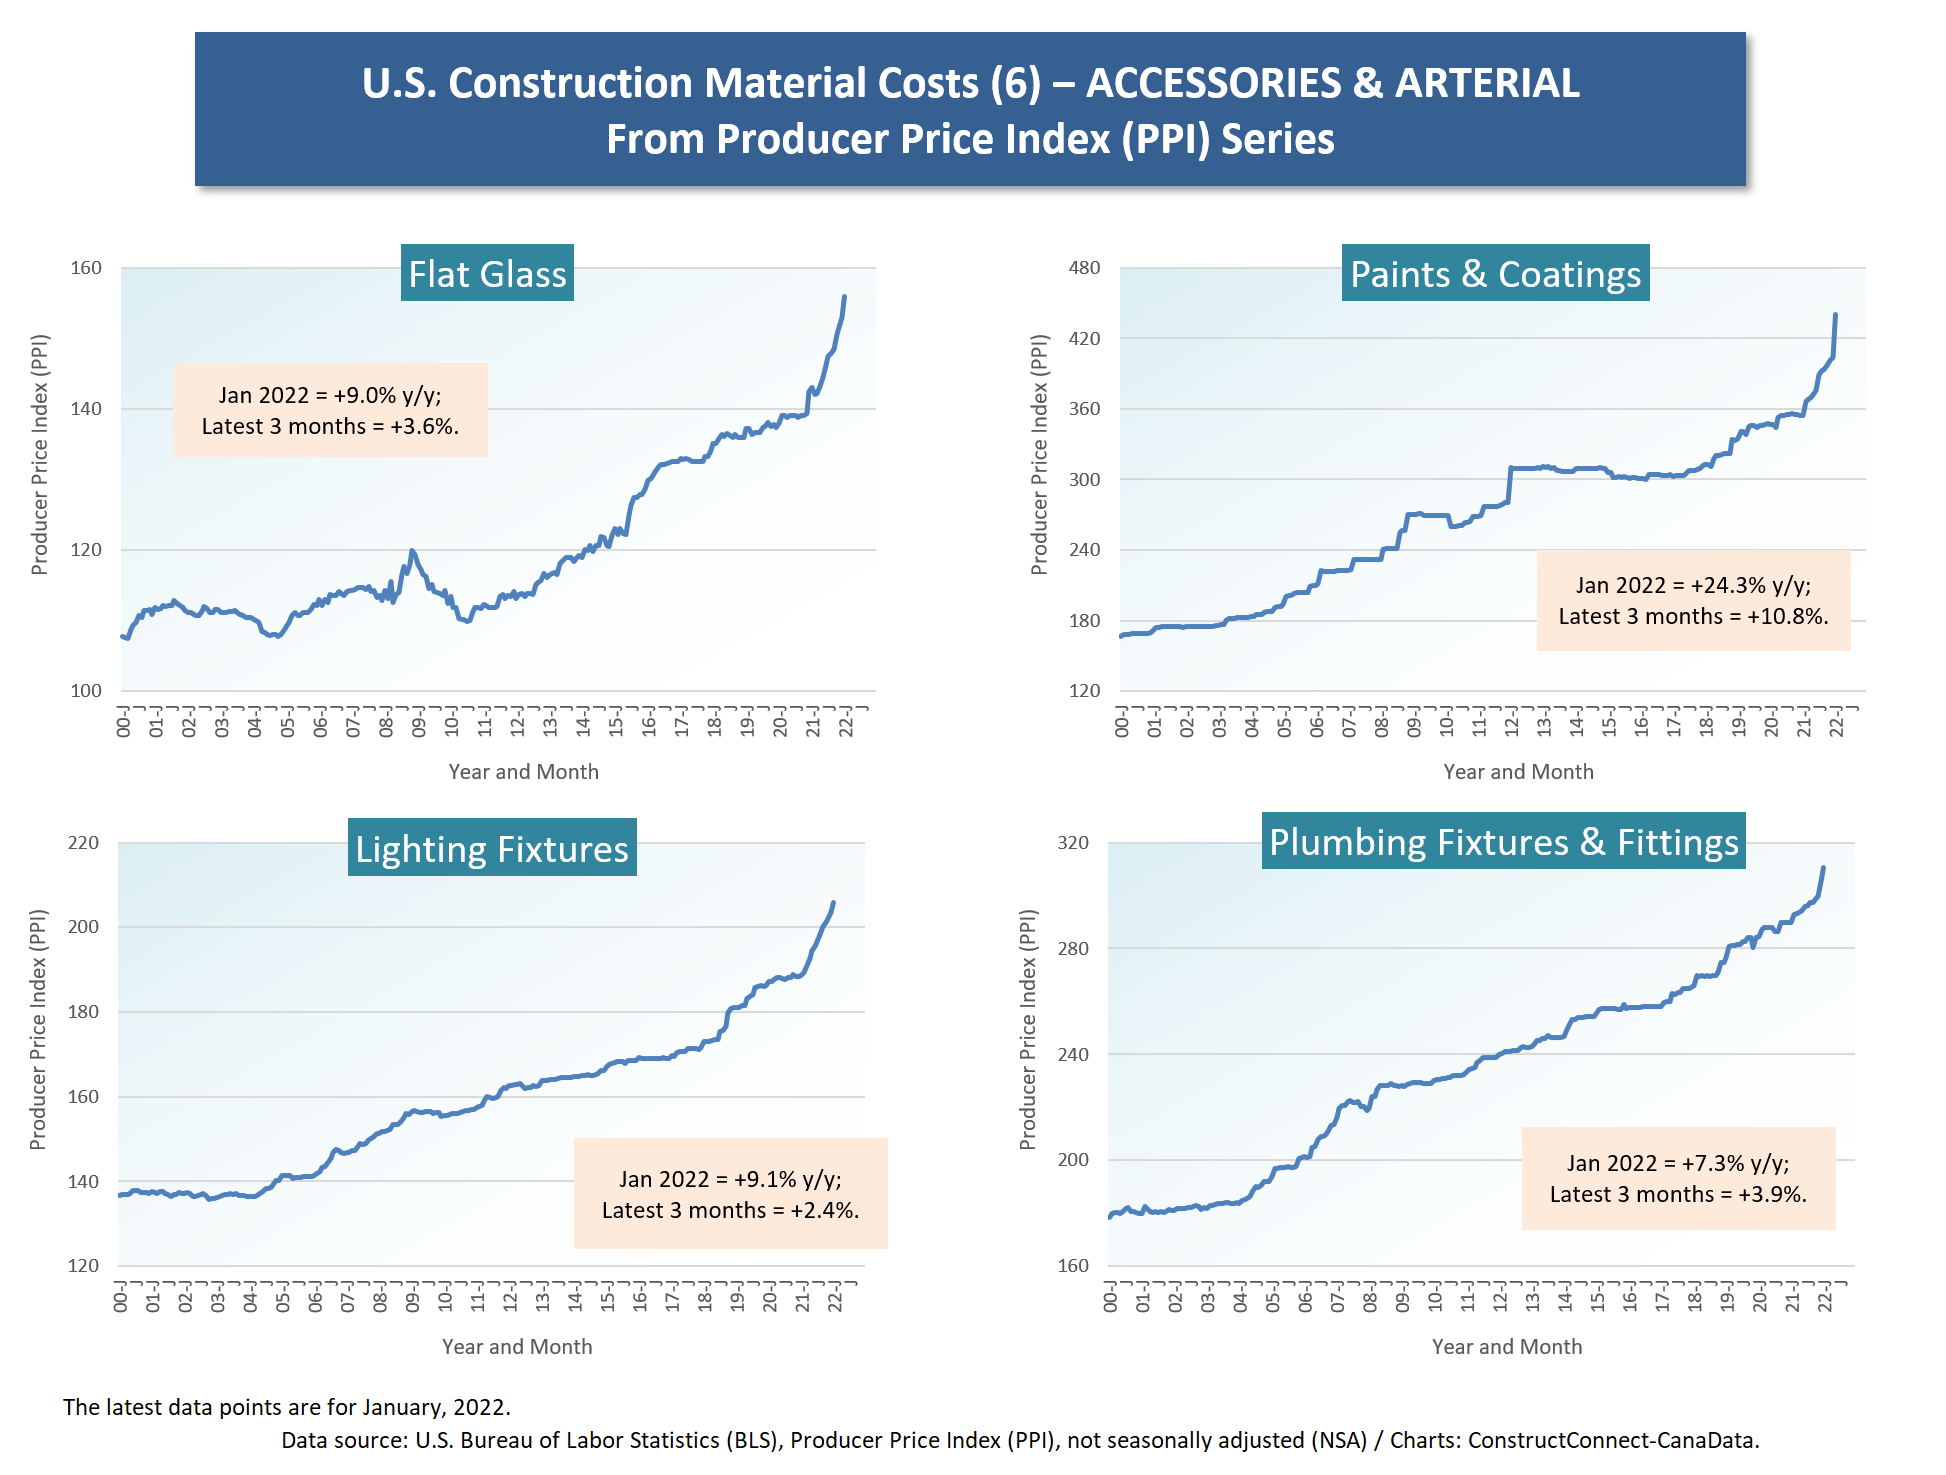
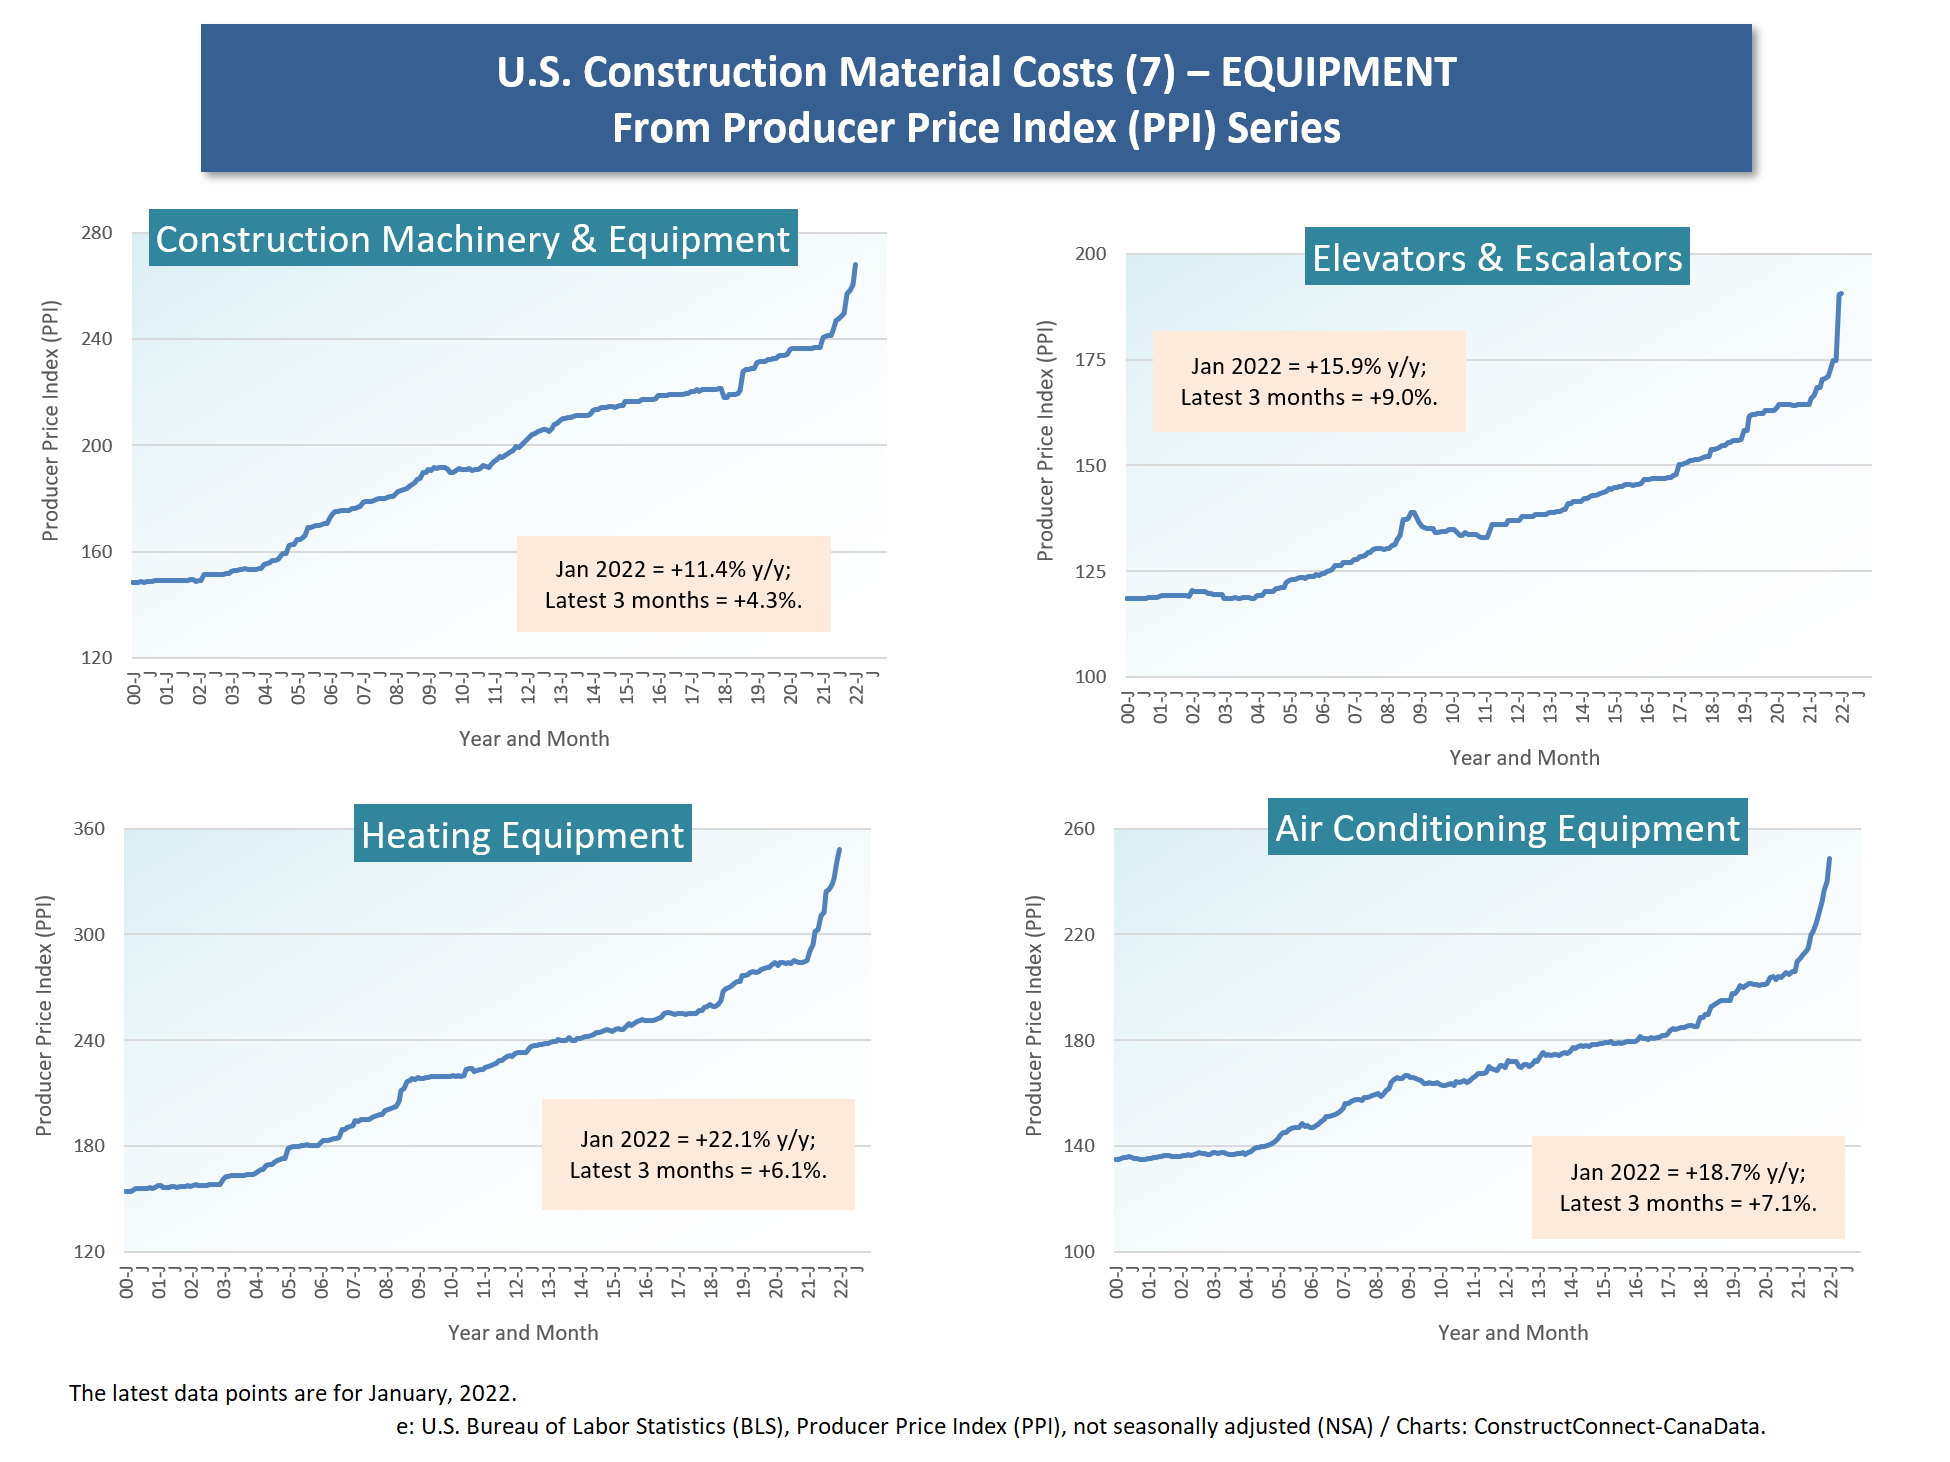
Appearing below are seven cluster charts of four graphs each showing historical price index levels dating back to January 2000, the turn of the century.
Nearly all the curves in the seven cluster charts have sharply rising end points. Spikes in construction material price levels have now become commonplace.
Some of the highlights from the PPI material set out below include the following.
- From Table 1, subset ‘final demand’ or ‘bid price’ indices for specific types of buildings range from a low of +12.3% y/y for schools to +27.8% for warehouses. Deglobalization and more stockpiling of inventory, plus the surge in purchases made over the internet, have greatly increased the demand for warehouse and distribution/fulfilment space.
- Also from Table 1, oriented strand board (OSB) has doubled in price (+102.2% y/y) versus three years ago in January 2019, before the pandemic, and softwood lumber has increased by more than a factor of two (+128.1% y/y).
- Among all the curves, Cluster Chart 7 features four of the steepest inclines of the past several months, for ‘construction machinery and equipment’, elevators and escalators’, ‘heating equipment’ and ‘air conditioning equipment’. Components that have become tied up in the logistical nightmare are part of the problem, as is the shortage of computer chips. Nearly all mechanical devices now have a heavy reliance on electronic circuitry.
- With the actions taken by Western nations to suppress some of Russia’s export activity, resulting from the conflict raging in the Ukraine, the upward pressure on energy prices and steel (plus two of steel’s key ingredients, iron, and coal), as shown in Cluster Charts 2, 4 and 5, is unlikely to relent.
- All the type-of-structure input subset indices in the ochre-shaded lower portion of Table 1 are running warmer than +15% year over year. The hottest gain is for commercial construction, +21.4% y/y.
Consumers have become deeply alarmed by the general price inflation they are seeing on store shelves. The year-over-year increase in the U.S. Consumer Price Index (CPI) has reached a many-decade high of +7.5%.
But when one learns of the exorbitant material cost increases facing contractors, one gains a new appreciation of just who has the most right to squawk about trying to get by in a world of escalating expenses.
Table 1
Graph 1
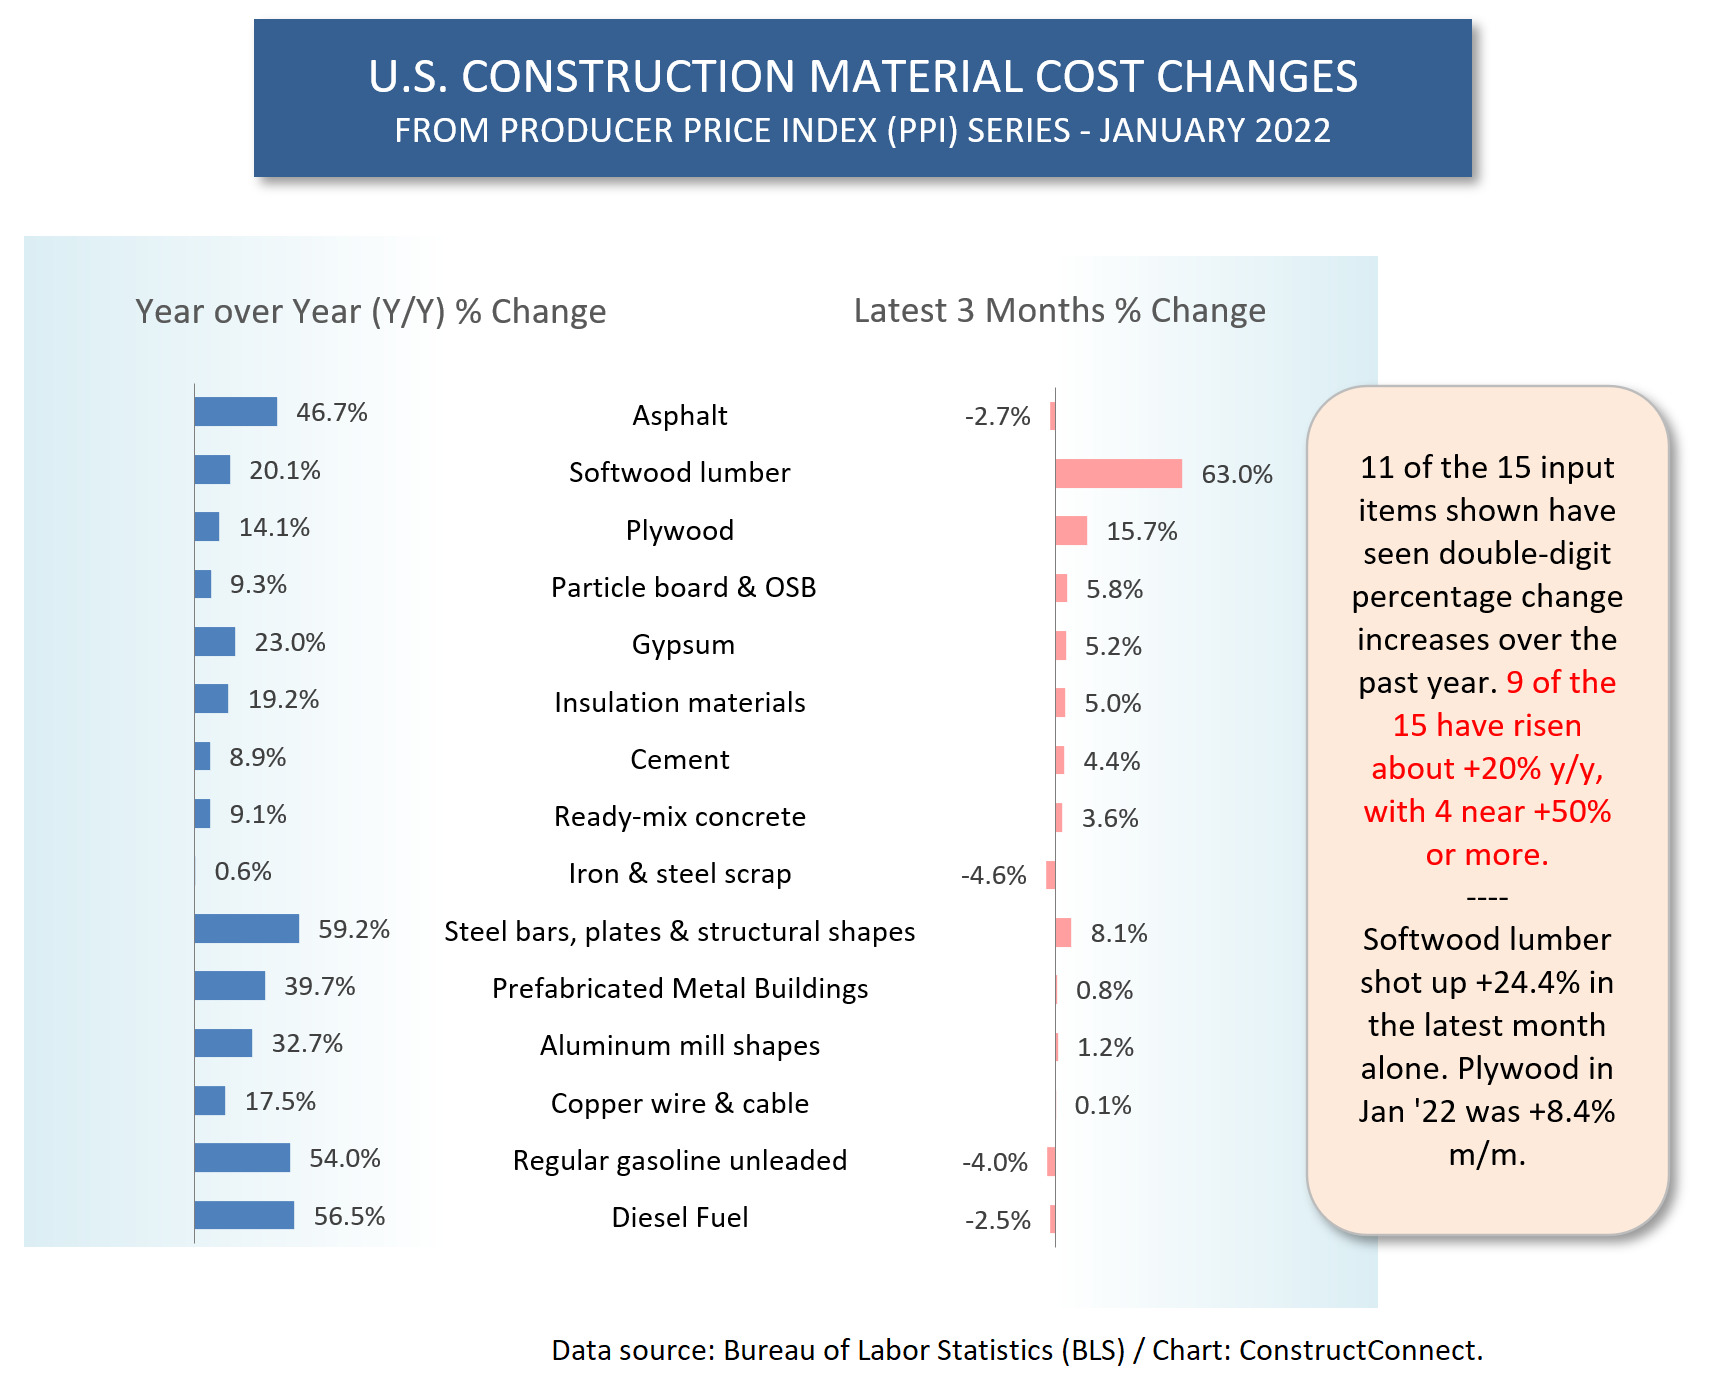
Graph 2
Cluster Chart 1
Cluster Chart 2
Cluster Chart 3
Cluster Chart 4
Cluster Chart 5
Cluster Chart 6
Cluster Chart 7
Alex Carrick is Chief Economist for ConstructConnect. He has delivered presentations throughout North America on the U.S., Canadian and world construction outlooks. Mr. Carrick has been with the company since 1985. Links to his numerous articles are featured on Twitter @ConstructConnx, which has 50,000 followers.


Recent Comments