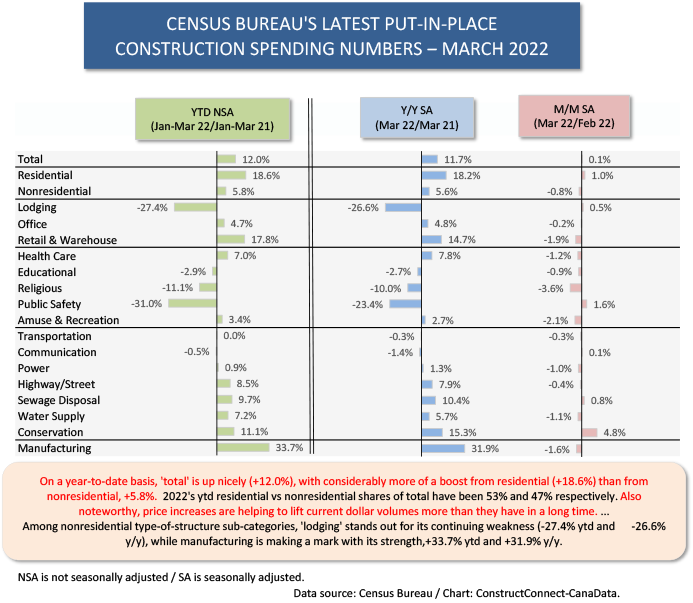
Table 1 is a one-place depiction of the key percentage-change metrics for the 2022 Q1 put-in-place (PIP) construction dollar volume statistics from the Census Bureau.
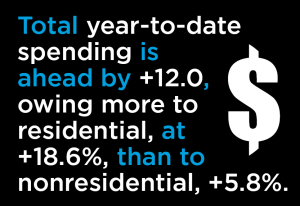 Total year-to-date spending is ahead by +12.0, owing more to residential, at +18.6%, than to nonresidential, +5.8%. The dollar volumes on which the percentage changes are based are in ‘current’ dollars. ‘Constant’ dollars would factor out inflation.
Given the exceptional advances in material input costs over the past year (see ‘Spikes Everywhere’ article here), and some decent-sized jumps in compensation rates as well, there’s a good chance the nonresidential percentage change year to date (+5.8%) would be close to zero or even possibly negative, if a price index were applied to the results.
Residential Claims Lion’s Share of Total
An astonishing switchover has occurred with respect to the shares of ‘total’ claimed by residential and nonresidential. Prior to the pandemic, the former almost always accounted for about two-fifths, or 40%, of total put-in-place construction. The latter, of course, made up the other three-fifths, or 60%.
For the first time in my memory of analyzing these stats, residential is now accounting for the lion’s share of ‘total’, more than half, at 53%, with nonresidential at 47%, based on year-to-date not seasonally adjusted (NSA) data.
The Private vs Public Construction Story
The ‘private’ versus ‘public’ tugging match within total put-in-place construction is also serving up an interesting story. The former, at approximately four-fifths (82%) of 2022’s Q1 total, is +14.9% year to date; the latter, at a little less than one-fifth of total (18.2%), is +0.7% ytd. One takeaway is that the government spending component is flat in ‘current’ dollars and negative in ‘real’ (inflation-adjusted) terms.
The weakness in capital spending from the public sector appears in sharp contrast with all the hype tied to the massive spending promised from the Infrastructure Investment and Jobs Act. The IIJA expenditures have been slow to materialize.
Implications of Starts as Leading Indicators for PIP
Construction ‘starts’, as calculated by ConstructConnect, lead put-in-place dollars that flow into projects at job sites. (The PIP numbers correspond with progress or work-in-process payments.)
Therefore, it’s informative to look at where strength (or weakness) in starts is likely to impact the PIP numbers, with a time delay usually ranging from nine months to two years, depending on types-of structure and the size of individual projects.
The 2022 Q1 (versus 2021’s Q1) PIP percentage change for hotels/motels was -27.4%; but there’s encouragement for accommodation construction to be found in the 2022 Q1/2021 Q1 performance of hotel/motel starts, +31.6% ytd.
The Q1 PIP percentage change for the ‘retail and warehouse’ sub-category at +17.8% was matched by a +17.0% change for retail in the starts statistics, but it did not find support from the starts results for warehouses, -39.8%. Warehouse building would be hard pressed to maintain the frenzied pace of groundbreakings it set in 2020 and 2021.
The -2.9% Q1 PIP percentage change for ‘educational’ facilities may soon receive a boost from school starts that were +11.3% from Jan-Mar 2022 versus Jan-Mar 2021.
The +8.5% Q1 PIP percentage change for ‘highways/streets’ may be just the beginning of a snowballing effect, given that road starts in Q1 were +45.9% and bridge starts, +15.1%.
Finally, in the PIP statistics, private office buildings in Q1 were +4.3% and public office buildings, +7.1%. There was no such optimism in the comparable ‘starts’ statistics, where the private office percentage change was -26.0% and the government office percentage change was also in the red, -5.1%.
Table 1
Alex Carrick is Chief Economist for ConstructConnect. He has delivered presentations throughout North America on the U.S., Canadian and world construction outlooks. Mr. Carrick has been with the company since 1985. Links to his numerous articles are featured on Twitter @ConstructConnx, which has 50,000 followers.


Recent Comments