
It’s always helpful to know which U.S. cities have the hottest economies and one way to make that assessment is to look at their labor markets.
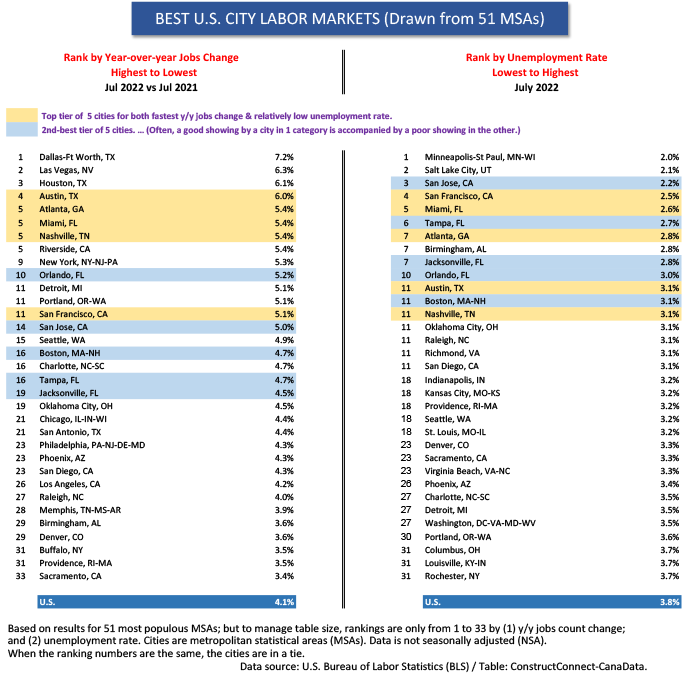
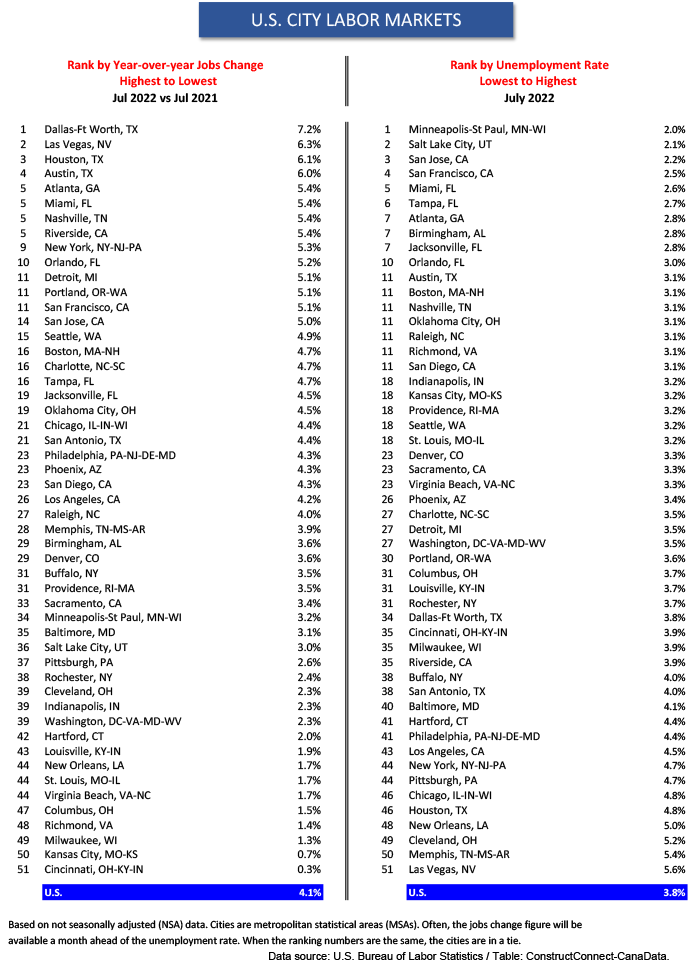
Table 1 ranks the 51 largest U.S. urban centers in two ways: (1) by year over year jobs creation, from fastest to slowest; and (2) by current unemployment rates. (For ease of presentation on social media, Table 1 is a condensed version of Table 3, which shows the results for the full set of 51 cities.)
Dallas-Ft Worth (+7.2%) is number one for y/y jobs growth, with Las Vegas (+6.3%) second, Houston (+6.1%) third, and Austin fourth (+6.0%). It’s astonishing that three cities in Texas are in the Top 4. San Antonio is well down the chart.
The ranking for unemployment rates is headed by Minneapolis-St Paul (2.0%), with Salt Lake City (2.1%), and San Jose (2.2%) close behind. But here’s a remarkable achievement. All four of Florida’s major cities are in the Top 10: Miami, Tampa, Jacksonville, and Orlando.
Also notice that two renowned West Coast high-tech centers have exceptionally low unemployment rates: San Jose (2.2%), and San Francisco (2.5%).
Rewards from a Composite Labor Market Measure
A city can be doing great according to one yardstick, but quite poorly with respect to the other.
Las Vegas is the perfect example. For jobs creation, it’s ranked number two, at +6.3% y/y, but by unemployment rate, it’s at the very bottom in 51st spot, at 5.6%.
Therefore, it’s worthwhile to look for cities that are doing relatively well according to both criteria. Towards that end, I’ve taken each city’s two rankings (i.e., by y/y jobs change and by U rate), calculated their average ranking, then placed all 51 cities in order by their new averaged ranking number.
This methodology yields up Miami, Atlanta, Austin, San Francisco, and Nashville as the best overall labor markets in the country. They form a Top 5 tier. The next five best cities are San Jose, Orlando, Tampa, Jacksonville, and Boston.
The cities in Florida are standouts, as are California’s venture capital and information start-up hubs, San Francisco, and San Jose. There are arguments for crediting the growth of cutting-edge technology industries for the labor market successes of Boston and Austin as well.
These results are set out in an easy to understand and visualize way in Table 1.
Graph 1 focuses on subset numbers from the background data that went into Table 1. It ranks only the nation’s 12 biggest (i.e., most populous) cities by present unemployment rates.
San Francisco is number one, with Miami in second, Atlanta in third and Boston fourth. Phoenix, where a huge addition to computer chipmaking capacity is underway (by Intel) is in fifth place.
Chicago and Houston are trailing the pack with 4.8% U rates. The country-wide ‘all-jobs’ not seasonally adjusted (NSA) headline unemployment rate in July was 3.8%.
Construction Labor Markets
Table 2 examines labor market statistics specific to the construction sector.
By number of construction jobs, it’s only natural that the 12 cities with the highest population counts are at the top of the list. Seattle, with 139,000 construction jobs, is the only other city that would have made it into the Top 12, placing between Phoenix (145,000) and Boston (136,000).
By y/y percentage change in construction sector jobs, Houston is out front, at +14.8%. That’s an advance well beyond the city’s ‘all jobs’ increase of +6.1%.
For the next largest changes y/y, one turns to eight MSAs that are not among the 12 most populous: Birmingham (+12.1%); St. Louis (+9.0%); Providence (+8.2%); Salt Lake City (+7.7%); Nashville and New Orleans (each +7.5%); Milwaukee (+7.1%); and Kansas City (+7.9%).
In Birmingham, as in Houston, construction is contributing far more to employment growth (+12.1% y/y) than ‘all jobs’ (+3.6% y/y).
Atlanta, which scores well in ‘all jobs’ creation (+5.4% y/y), is surprisingly passive when it comes to construction jobs generation (0.0% y/y).
Table 1
Graph 1
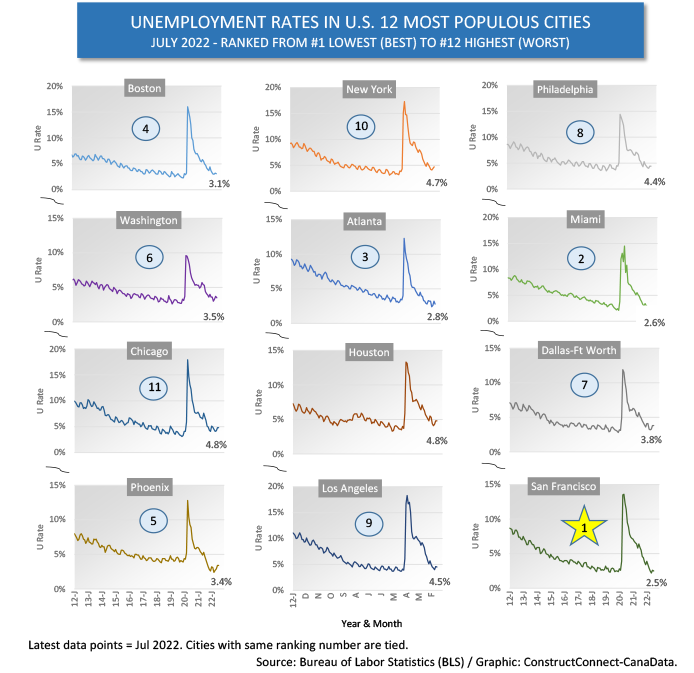
Table 2
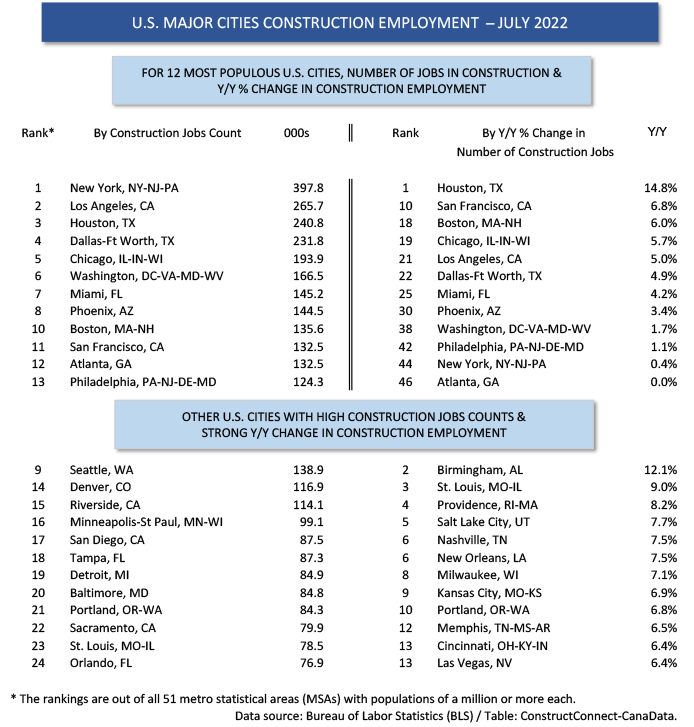
Table 3
Alex Carrick is Chief Economist for ConstructConnect. He has delivered presentations throughout North America on the U.S., Canadian and world construction outlooks. Mr. Carrick has been with the company since 1985. Links to his numerous articles are featured on Twitter @ConstructConnx, which has 50,000 followers.


Recent Comments