
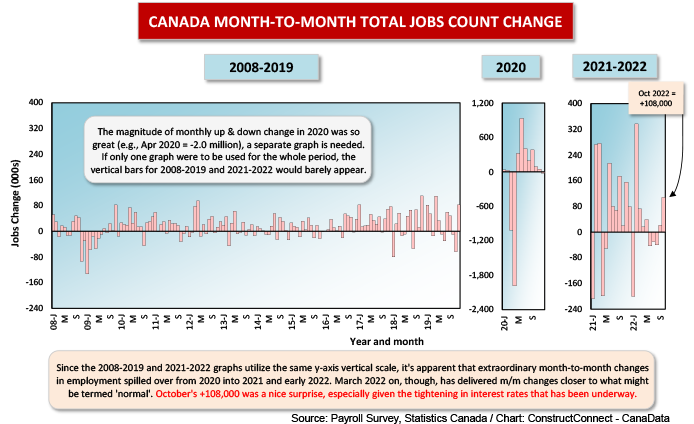
After a string of months with barely positive or back-tracking employment change, Canada struck it rich in October, +108,000 jobs. The biggest portion of the +108,000 gain was provided by services jobs, +63,000 according to Statistics Canada, but manufacturing and construction also had good hiring months, +24,000 and +25,000 jobs respectively.
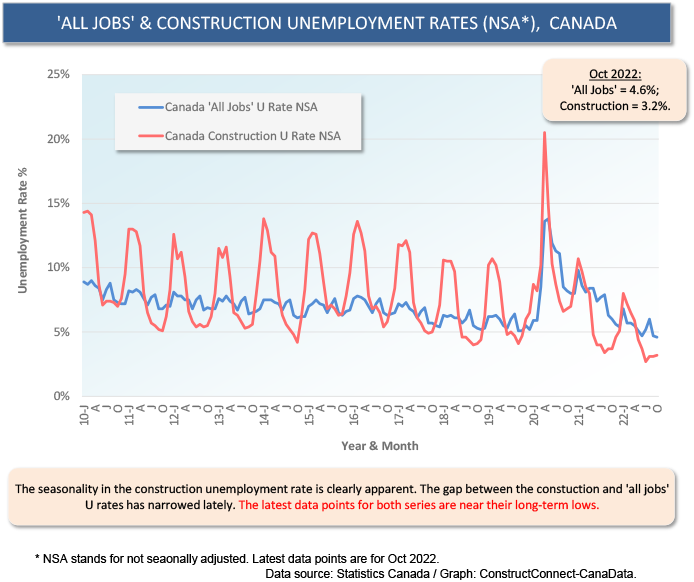
 Canada’s seasonally adjusted (SA) unemployment rate stayed the same in October as in September, at 5.2%. The not seasonally adjusted (NSA) U rate tightened a notch to 4.6% from 4.7% in the preceding month.
The NSA total Canada unemployment rate calculated according to the same more stringent (i.e., as to who is making a truly serious effort to find a job) methodology as is used in the U.S. also moved down slightly, to 3.7% from 3.8% in September. ‘R-3’ U as it is known, at 3.7%, was pretty close to the U.S. comparable figure of 3.4%.
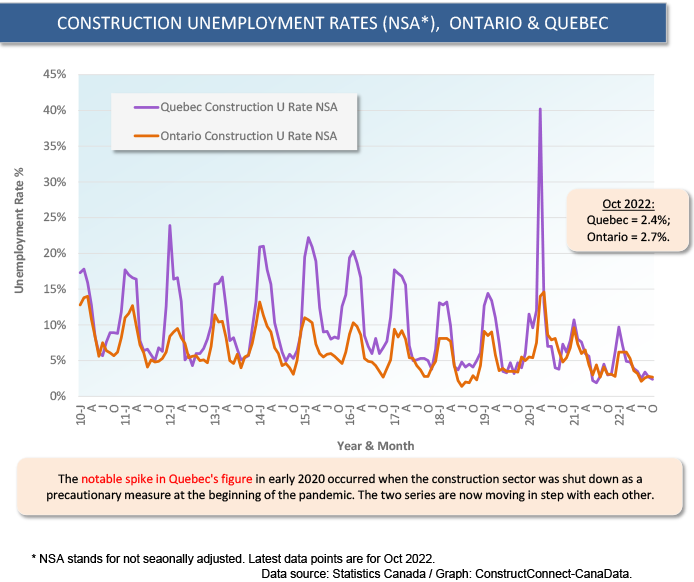
The NSA U rate for Canada’s construction sector, at 3.2%, is now lower than either of the economy-wide NSA U rates (i.e., the 4.6% standard figure or the 3.7% R-3 figure). Provincially, the lowest construction NSA U rates are in B.C., 2.1%, Quebec, 2.4%; and Ontario, 2.7%.
Thanks Go to Continued Revved Up Homebuilding
The total number of construction jobs Canada-wide is +7.3% year over year, way ahead of the ‘all jobs’ advance of +2.7%. What’s accounting for the strength in the Canadian construction labour market? Continuing revved up homebuilding activity is one major factor.
There are lots of good reasons for expecting a significant fall-off in housing starts in Canada. Mortgage rates are climbing. Home prices seem prohibitively expensive. Household debt has risen through the stratosphere. Development charges imposed by municipalities are being ratcheted upwards. And regulatory steps have been taken to discourage foreign buyers.
Many economic forecasting agencies, primarily based outside of Canada, have been calling for a collapse in the Canadian housing market. This isn’t new; they’ve been making these assertions for years. But if I had a dollar for every occasion when they’ve been wrong, I’d have enough money to afford that space tourism jaunt with Captain Kirk that I’ve been dreaming about.
Canadian housing starts in September were 299,589 units seasonally adjusted and annualized (SAAR). That was the highest monthly number this year. It was the fourth best result ever. (2021 had three months in which residential groundbreakings broke above 300,000 units, the only times in history, so far, when that benchmark has been breached.) September 2022’s 300,000 units rounded was 50% more than the long-term average of 200,000 units.
Demographics to the Rescue
It’s quite likely there will be a tailing off of Canadian housing starts in the period of general economic slowdown ahead. But also know that there is considerable support coming on the demographic front.
Canada has only six cities with populations in excess of a million residents each. The federal government in Ottawa-Gatineau has set an immigration target of half a million individuals each year. In other words, Canada will be home to the equivalent of a new city of a million people every two years, with all that implies for new infrastructure and living space needs.
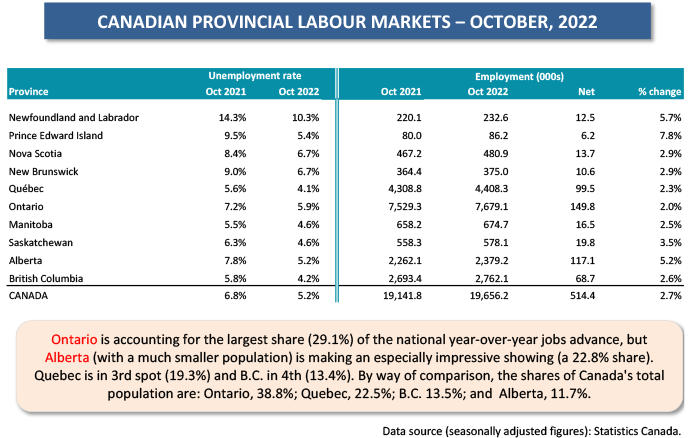
Returning, briefly, to a discussion of the nation’s overall labour market (i.e., as opposed to just construction), one of the most notable features is the resurgence of hiring in Alberta. Canada has added half a million jobs during the latest 12 months. Among provinces, Ontario has contributed the largest share of the total jobs jump, 29%. Alberta, though, in second place, has delivered the starring performance. With a population that is less than one-third of Ontario’s, it has accounted for 23% of the country-wide staffing improvement.
Graph 1
Graph 2

Graph 3
Graph 4
Graph 5

Graph 6
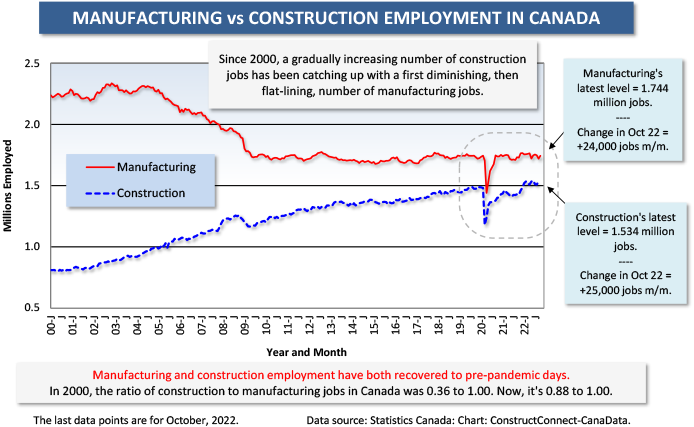
Table 1
Graph 7

Table 2
Alex Carrick is Chief Economist for ConstructConnect. He has delivered presentations throughout North America on the U.S., Canadian and world construction outlooks. Mr. Carrick has been with the company since 1985. Links to his numerous articles are featured on Twitter @ConstructConnx, which has 50,000 followers.


Recent Comments