As a follow-up to an article on U.S. construction material costs, the table and charts in this piece look at what has been happening in Canada. Generally speaking, the story in both countries is the same. While some inputs into construction are continuing to show price increases that are way up year over year, there are also instances of big declines. Furthermore, the trend over the latest three months decidedly features price retreats rather than advances.
 In the U.S., the most comprehensive compilation of material costs, expressed in index form, are to be found in the Producer Price Index (PPI) data series compiled by the Bureau of Labor Statistics. The Canadian equivalent is the Industrial Product Price Index (IPPI) data set produced by Statistics Canada.
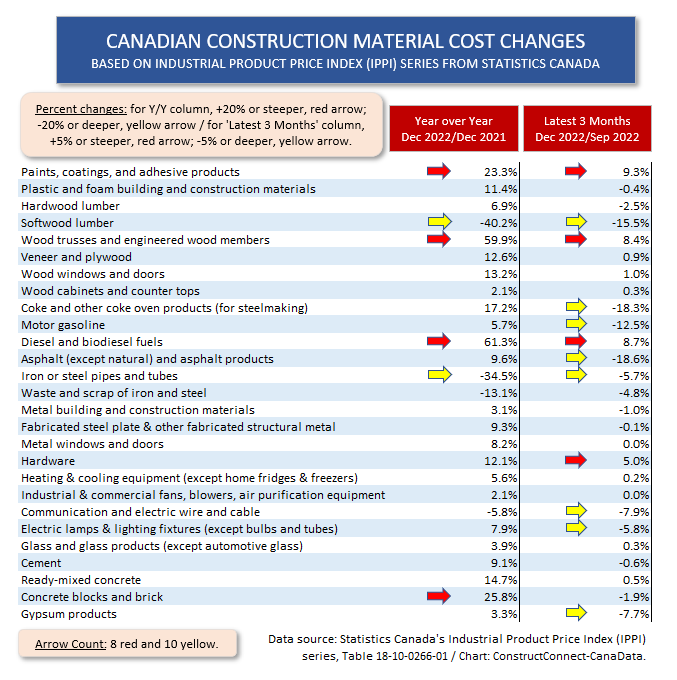
Table 1 sets out the results for 27 building material or other non-man-hour inputs (e.g., equipment) into construction. The red and yellow arrows highlight the biggest price shifts. For year-over-year price movements, the red arrows point to gains of +20% or more; the yellow arrows, to declines of -20% or more. There are a few more big gains that retreats (4 red to 2 yellow arrows).
The narrative changes, though, when latest-three-month results are examined. In the latest-three-months’ column, the red arrows are for increases of +5% of more; the yellow arrows, for pullbacks of -5% or more. There are double (8 to 4) the number of yellow arrows to red arrows.
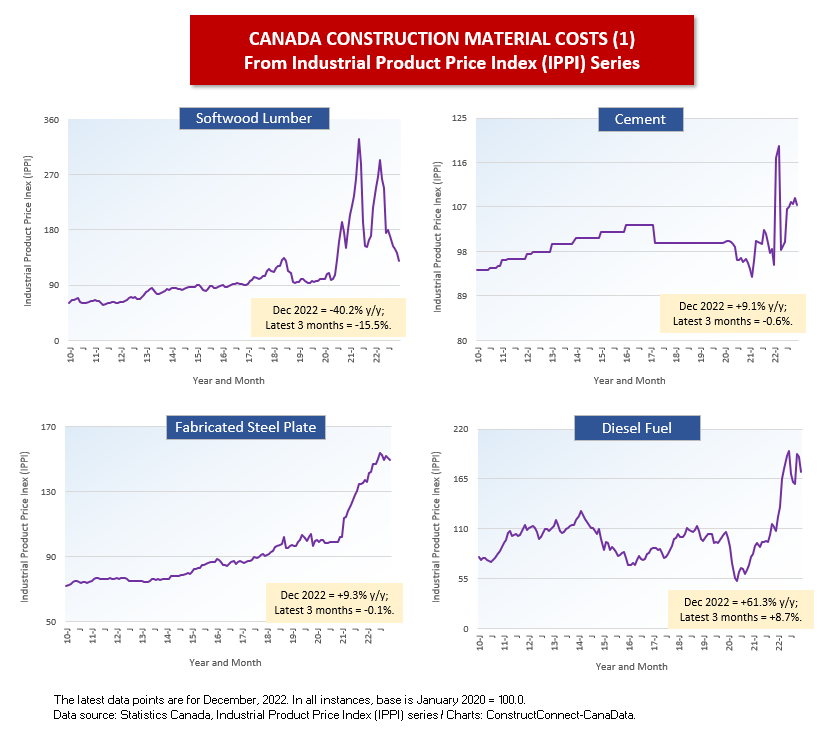
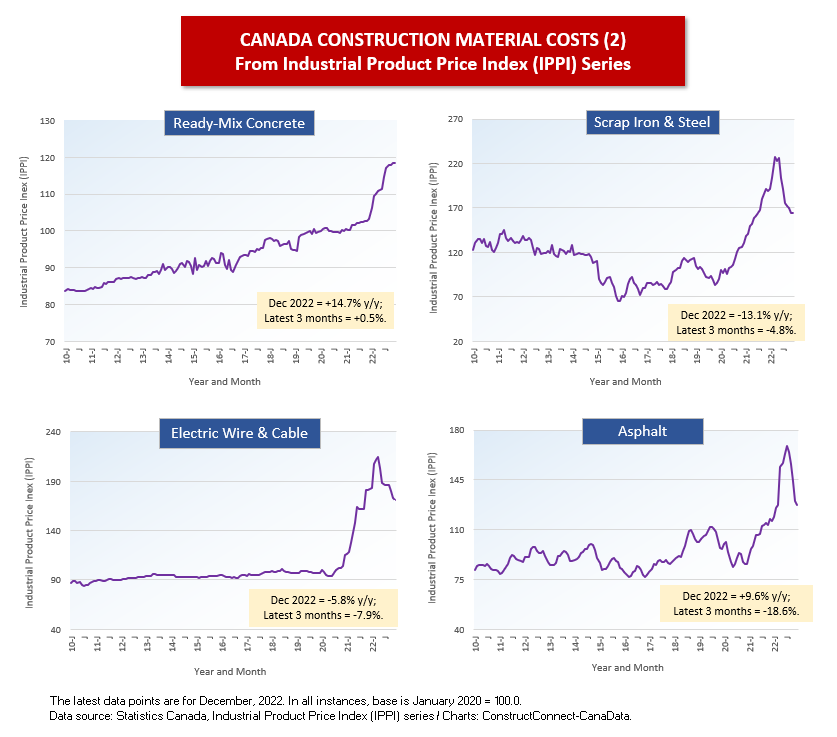
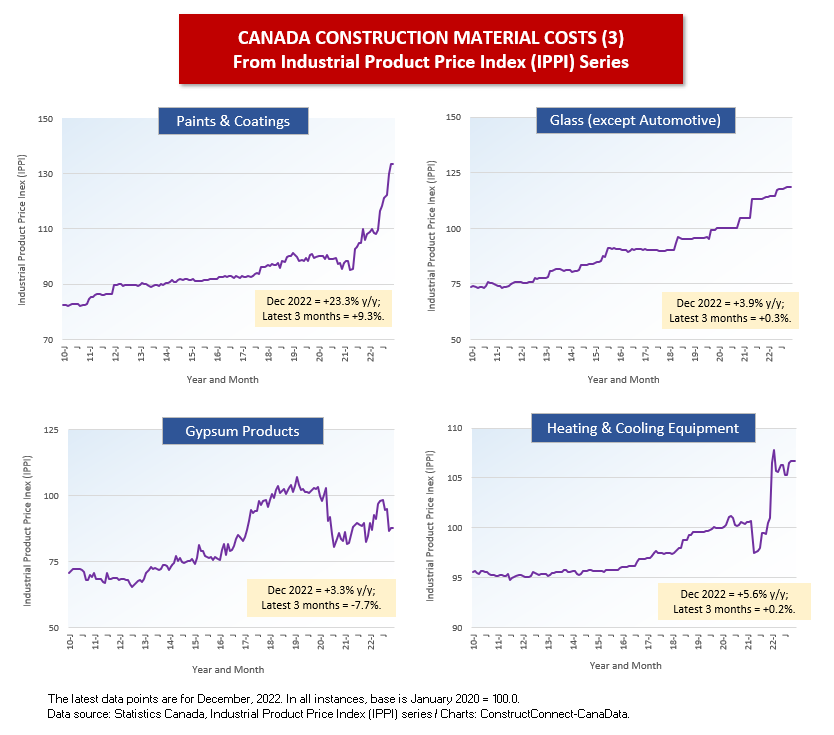
Cluster charts 1 through 3 illustrate price movements for individual inputs into construction. Most of the curves feature rising tendencies in 2020 and/or in 2021 that abate somewhat in 2022. Fabricated steel plate, diesel fuel, and ready-mix concrete, though, haven’t eased much. Nor have ‘paints and coatings’ and ‘heating and cooling equipment’, although there’s a special factor to mention concerning the latter.
It’s important to pay attention to the scale along the y-axis. The ‘heating and cooling equipment’ graph appears to have an exaggerated spike in 2021, but that’s mainly because the low-to-high gradation along the y-axis isn’t as extreme as for many of the other input graphs. The y/y change is currently only +5.6%, running below the rate of CPI inflation in the country (+6.3% y/y).
Table 1
Cluster Chart 1
Cluster Chart 2
Cluster Chart 3
Alex Carrick is Chief Economist for ConstructConnect. He has delivered presentations throughout North America on the U.S., Canadian and world construction outlooks. Mr. Carrick has been with the company since 1985. Links to his numerous articles are featured on Twitter @ConstructConnx, which has 50,000 followers.


Recent Comments