
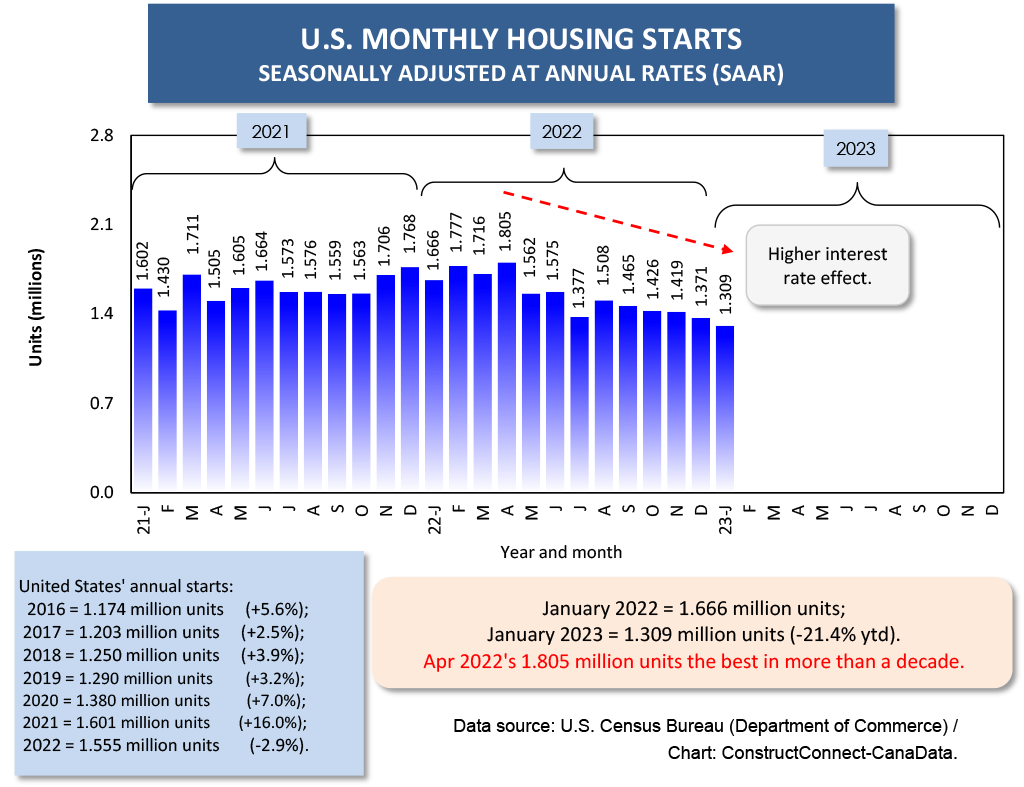
Since the Spring of last year, monthly total U.S. housing starts (annualized) have been on a downwards trajectory. The weakness in housing starts is one of the chief arguments for speculation that a recession is just around the corner.
 Furthermore, the number of residential building permits, which is a leading indicator (by a month of two) for ‘starts’ is showing no signs of bottoming just yet. A key question, therefore, is when will the slide end?
Cluster Chart 1 shows that, in nearly every region, permits issued for single-family structures are the main, and in most cases sole, cause of the overall tapering off. Only in the Northeast are multiples showing a greater degree of settling down than singles. But it’s also true that only in the NE are multiples, in units, routinely a higher proportion of the total than singles.
What’s also the case, though, is that an interesting shift is underway. In the three other regions than the NE, the drops in single-family units, with accompanying relative stability in multi-family units, is leading to convergence. This is a situation that is not in keeping with historical data for the U.S. Throughout the decades, and for a variety of reasons, U.S. single-family starts have placed well above multi-family starts (both in units) as a proportion of total.
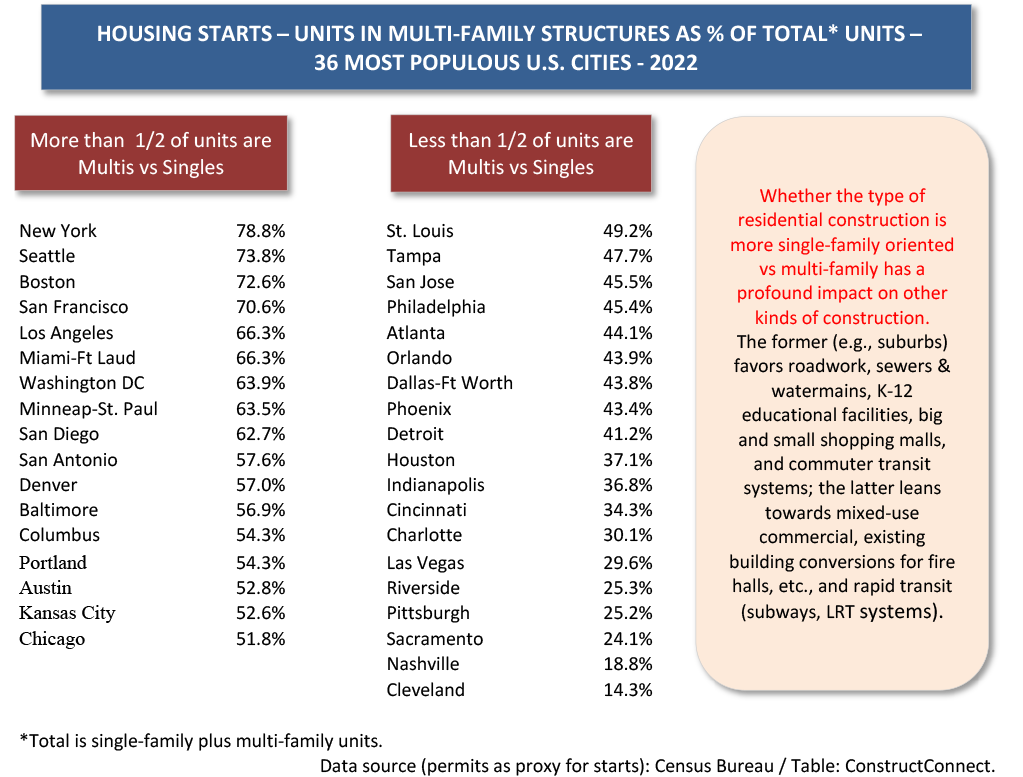
Table 1 carries the singles-to-multiples share issue down to the city level. In 2021, there were only nine cities in the U.S. where multiples held a more than 50% proportion of total starts. In 2022, that figure nearly doubled to 17. There are now almost as many major cities with multiples forming the bulk of new residential construction as those with singles in the forefront.
The singles vs multiples clash for dominance is significant on many levels, not least being the way other types of construction will be affected. Specifically, urban sprawl (i.e., singles in the suburbs) favors roadwork, sewers & watermains, K-12 educational facilities, big and small shopping malls, and commuter transit systems. Alternatively, the sprouting of numerous high-rise cranes in or close to city cores usually encourages mixed-use commercial development, the conversion of existing buildings for fire halls, etc., and the building of rapid transit lines (subways, LRT systems). Plus, there’s usually a significant boost to social night life when downtowns are energized by residential high-rises.
Concerning new multi-family residential construction, a notion often floated these days is that there is a potential nifty work around. The idea is to re-purpose some office buildings that are standing largely vacant as a consequence of so many employees now working from home.
This is a trend that’s finding some traction. But it does seem to have its limitations. For apartment or condo living to offer appeal, having lots of windows is a must. Office buildings generally have large central floor plates that do not lend themselves to views of the outside.
Also, office buildings are not designed to the same standard of soundproofing as residential towers. Vertically, they often feature open space between floors to enable the easy placement of electrical cabling. Nor is the plumbing set up to serve multiple unique tenants.
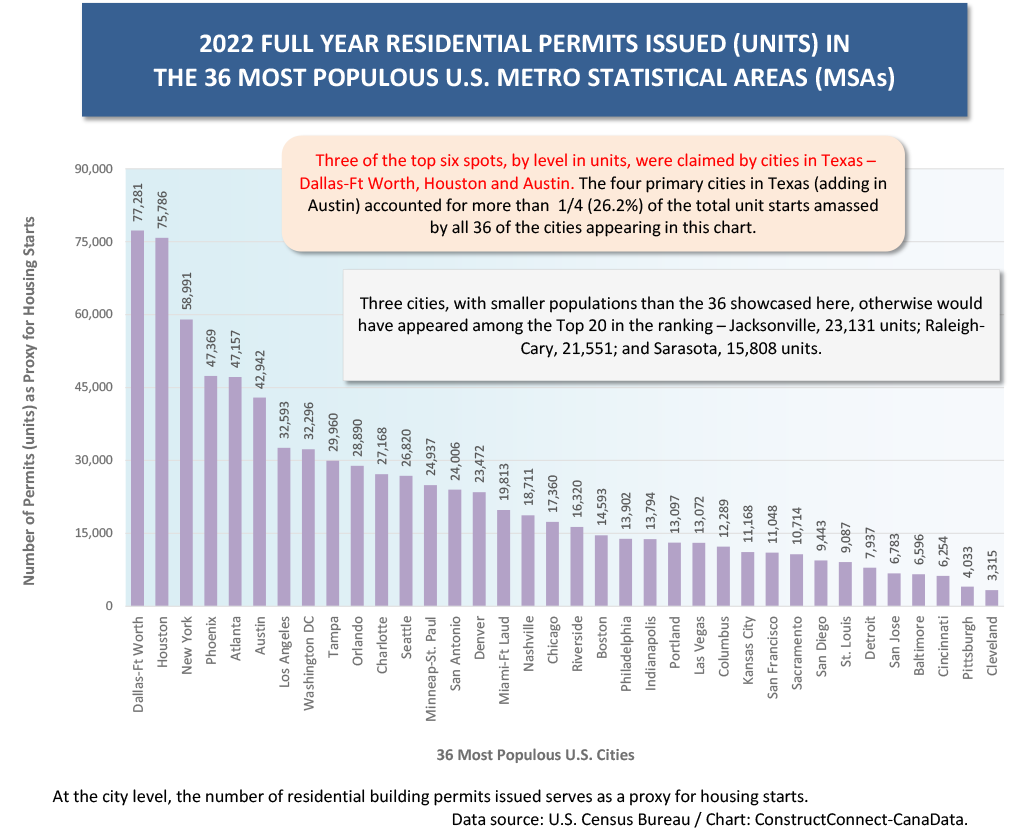
Graph 4 shows the level of residential building permits in America’s 36 most populous metro statistical areas. In 2022, Dallas-Ft Worth and Houston recorded new home groundbreakings that placed them far ahead of every other city, including third-place New York.
The strength of new homebuilding in Texas is best illustrated with a showcase statistic. In 2022, the four major cities in Texas accounted for more than a quarter of all the new accommodation units that were authorized by the nation’s 36 biggest cities.
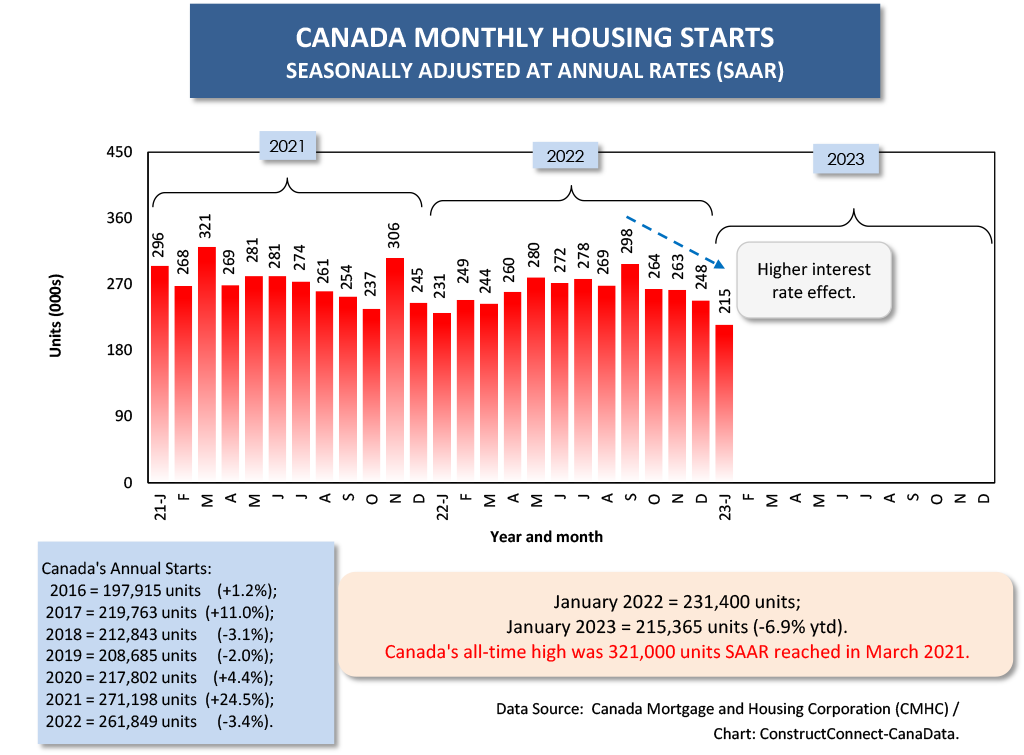
Graph 6 highlights that the downtrend in the new housing market isn’t limited to south of the border. The Bank of Canada has been lifting interest rates at the same time as the Federal Reserve and Canadian housing starts have begun to show the strain.
Graph 1
Cluster Chart 1
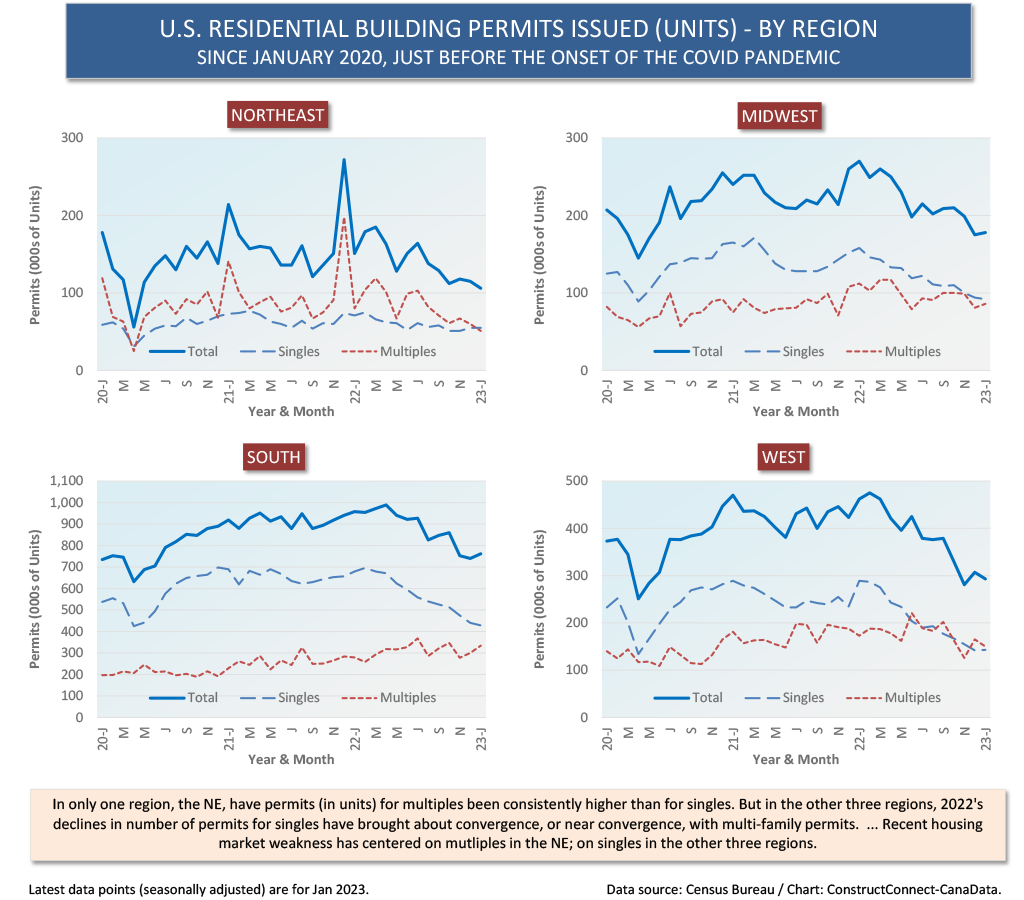
Table 1
Graph 2
Graph 3
Graph 4
Alex Carrick is Chief Economist for ConstructConnect. He has delivered presentations throughout North America on the U.S., Canadian and world construction outlooks. Mr. Carrick has been with the company since 1985. Links to his numerous articles are featured on Twitter @ConstructConnx, which has 50,000 followers.


Recent Comments