
An expected fallout from higher interest rates is a decline in housing starts. In both the U.S. and Canada, that proposition is being partly realized, but not to a full degree. The story is best told in graphs and the bullet points below cover the highlights.
United States Housing Starts:
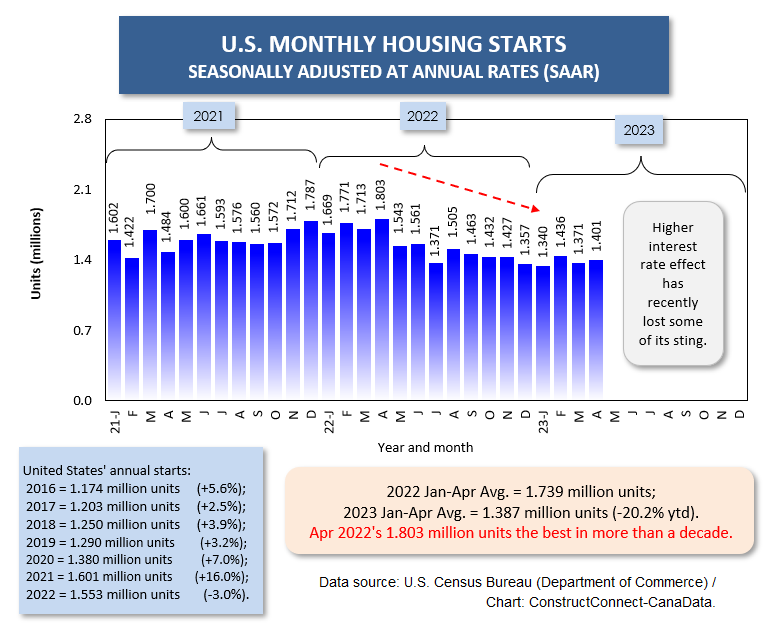
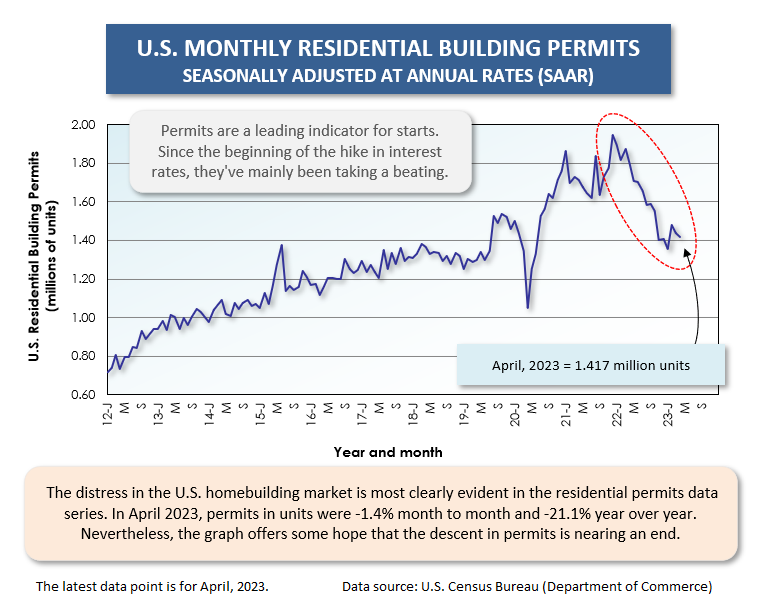
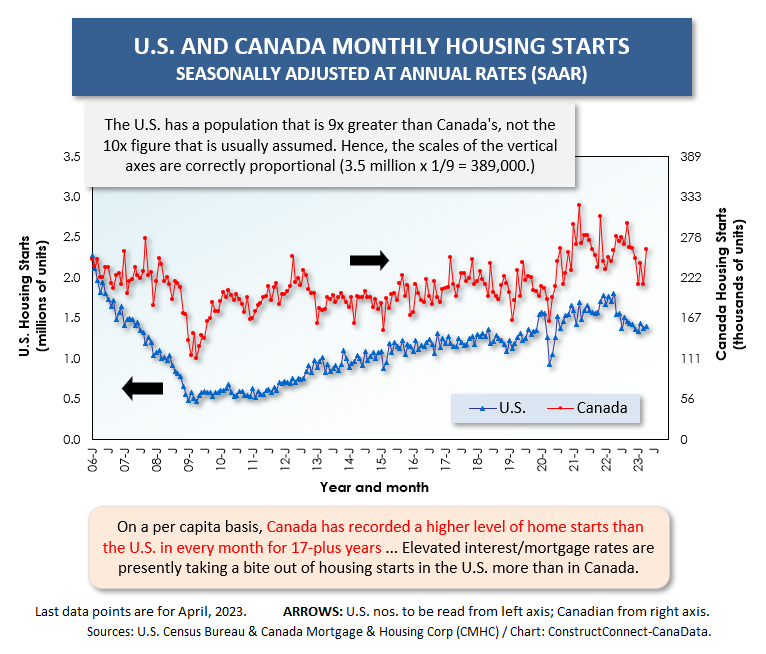
- The series of hikes in U.S. interest rates caused a more or less steady decline in new home starts from April 2022 through January 2023. In the first four months of 2023, however, U.S. housing starts have leveled off close to 1.4 million units seasonally adjusted at an annual rate (SAAR) (Graph 1).
- The decline in U.S. new home starts from most recent peak a year ago, in April 2022 (1.8 million units SAAR) to now (April 2023’s 1.4 million units SAAR) has been -22.3%, which in stock market terms would summon up the phrase ‘bear market’ (Graph 1).
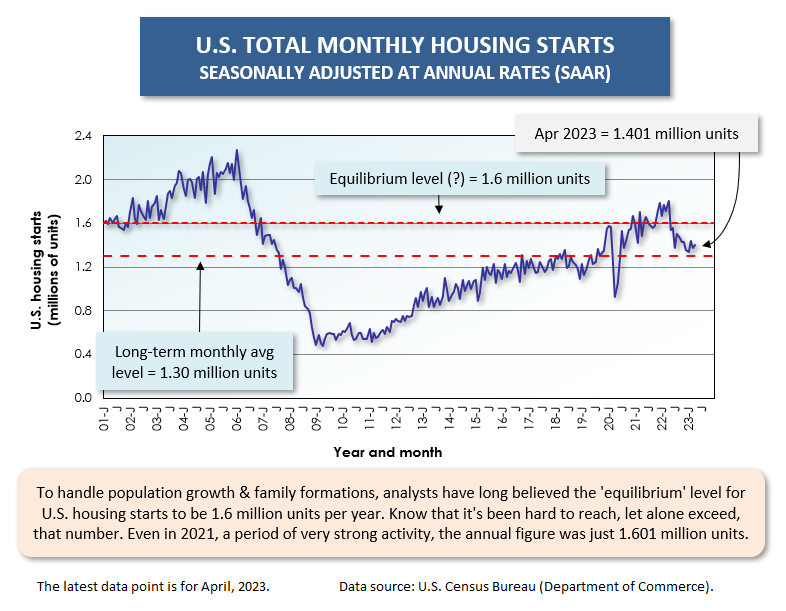
- Nevertheless, April 2023’s level of housing starts (1.4 million units) was still a little higher than the long-term monthly average for the U.S. of 1.3 million units SAAR. It may be a backhanded compliment, but housing starts are presently sticking above where they were during a dozen-year stretch from mid-2007 through early 2019 (Graph 2).
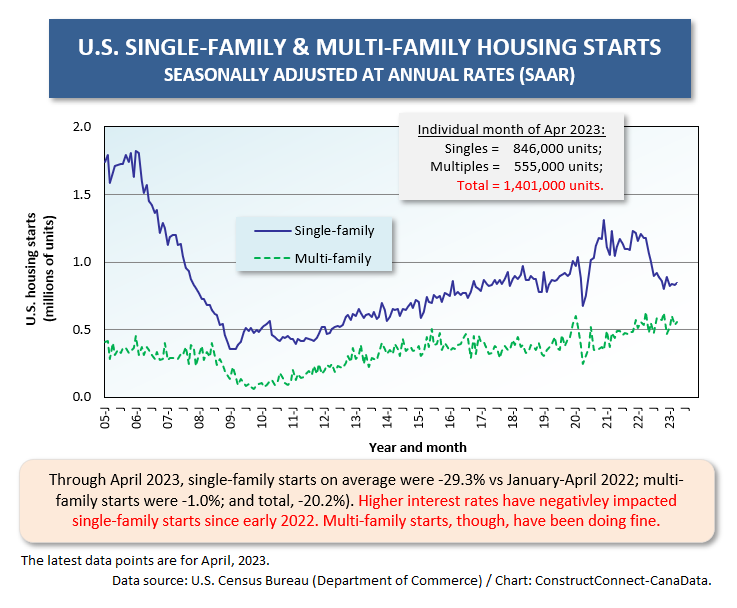
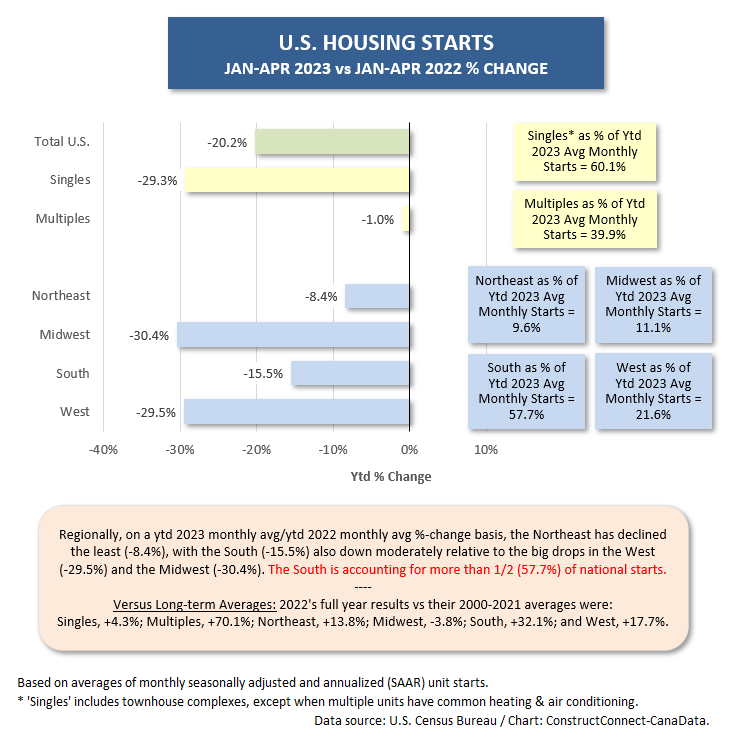
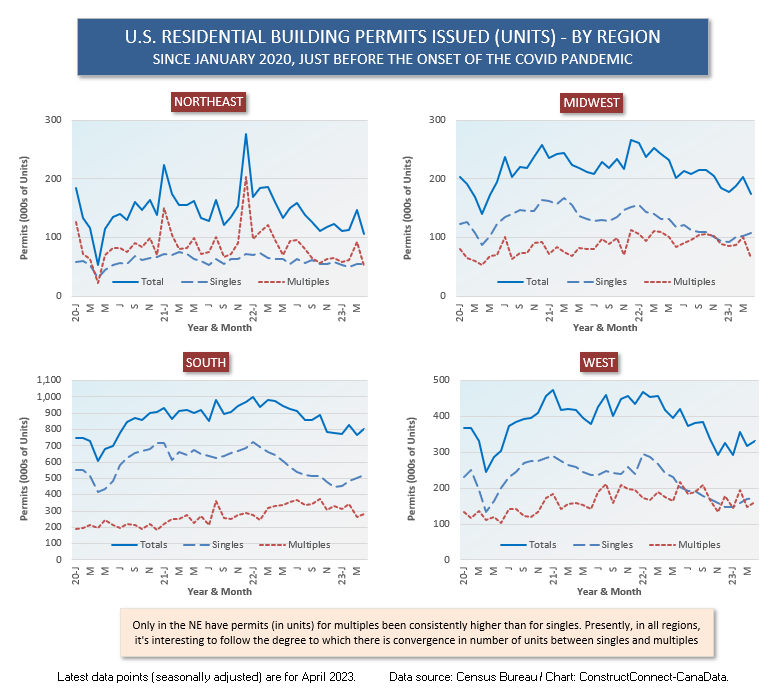
- Single-family starts have borne almost the entire brunt of the downturn. On average through the first four months of 2023, they are -29% compared with January-April of 2022. Multi-family starts, in units, are off by only -1% year to date (Graph 3).
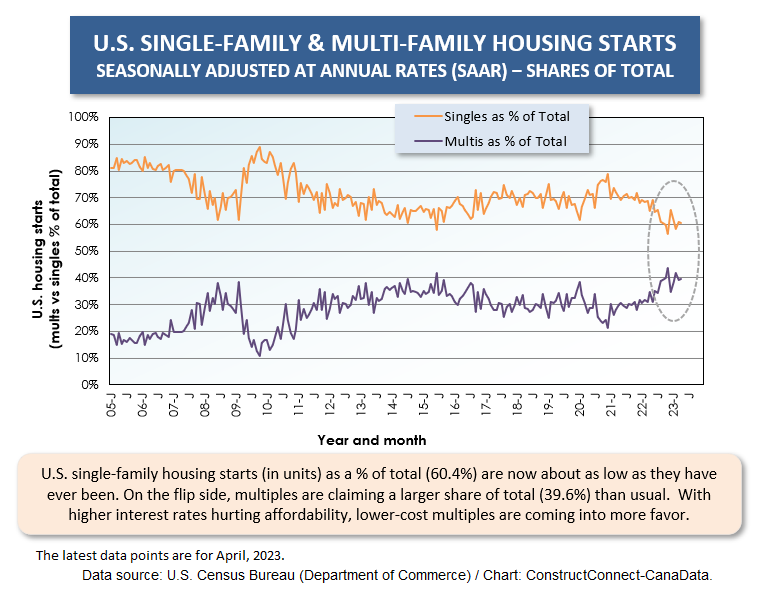
- In units, singles as a share of total have fallen to 60%, serving up the remaining 40% to multiples. This is about as far as the U.S. has ever gone in lifting up multiples relative to singles (Graph 4). As will be set out later, in Canada, the proportional shares of singles versus multiples are wildly different, with the latter far more dominant.
- Regionally, the biggest blows to housing starts year to date in 2023 have come in the Midwest and the West, each -30%. The drops in the Northeast and South have been more moderate, -8% and -16%. The South is currently accounting for nearly 60% of total starts, with the West in second place at a little over 20%, or one-fifth (Graph 5).
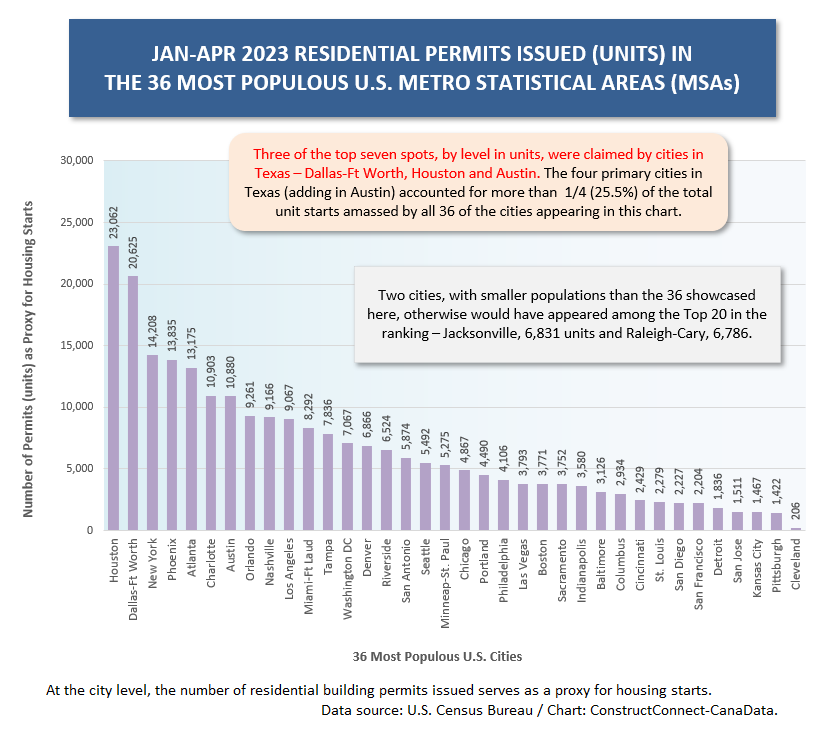
- Even in current depressed market conditions, the year-to-date number of residential building permits issued in Houston and Dallas-Ft Worth is astonishing, 23,100 and 20,600 units respectively. By way of comparison, New York City in third place is well back at 14,200 units (Graph 6).
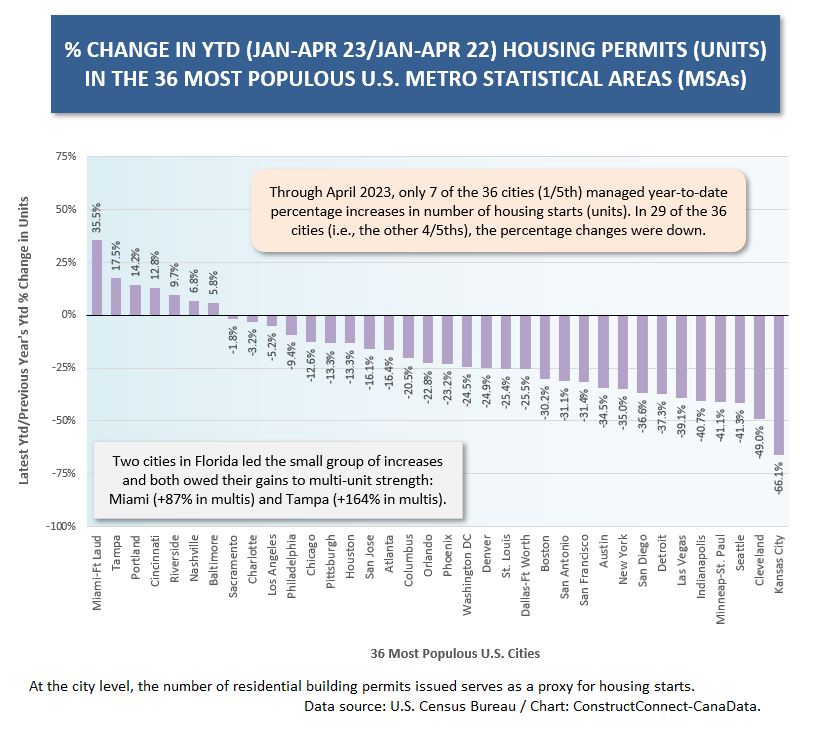
- On a year-over-year basis, however, it’s two cities in Florida that are shining. Miami-Ft Lauderdale (+36%) and Tampa (+18%) are leading a group of only seven cities that, year to date, have recorded an increase in total number of residential building permits. Houston and Dallas-Ft Worth, even with their outsized numbers (in units), are not keeping up with last year. (Graph 7).
- The Miami and Tampa ‘total’ increases are being driven by strength in the number of units contained within multi-family structures, +87% and +164% respectively. Other U.S. cities with exceptional ytd increases in multi-family units are Nashville, +138%; Phoenix, +41%; and Charlotte, +35%.
Canadian Housing Starts
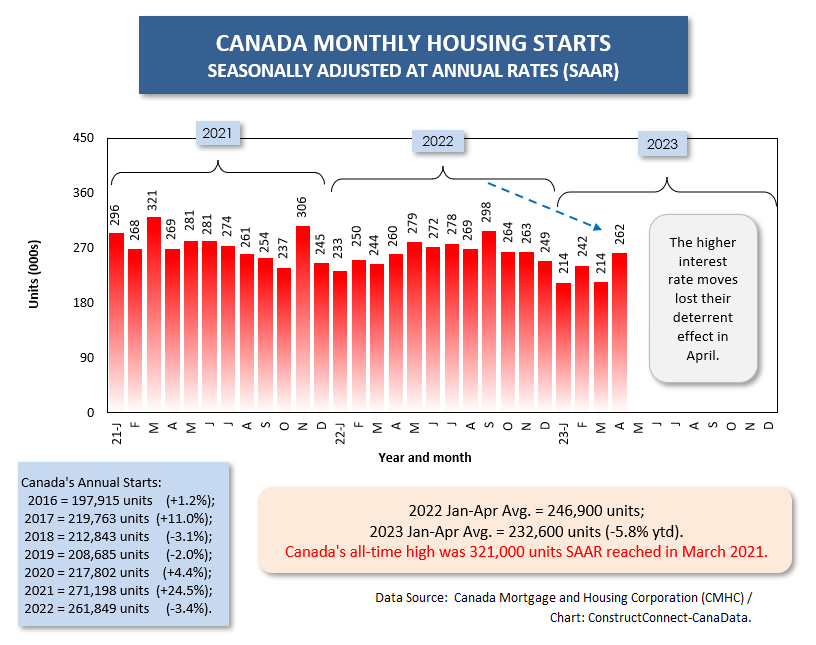
- The Bank of Canada’s higher interest rate moves north of the border began to kick in as a deterrent to housing starts in September of last year, later than in the U.S. Furthermore, April 2023 thumbed its nose at the negativity, recording a level of 262,000 units SAAR, which can be compared favorably with the annual average of 200,000 units during the first two decades of this century (Graph 10).
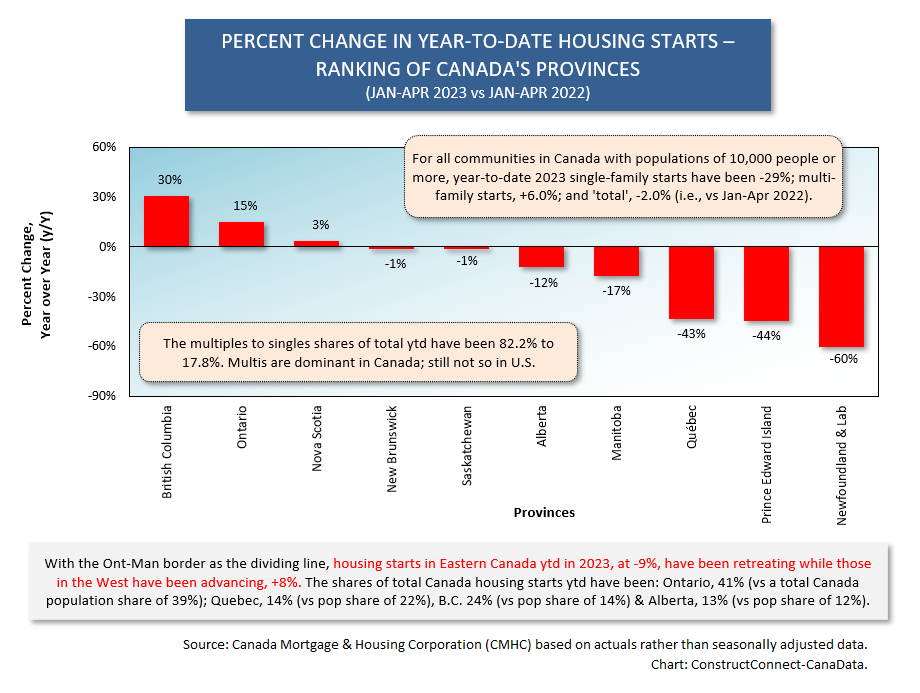
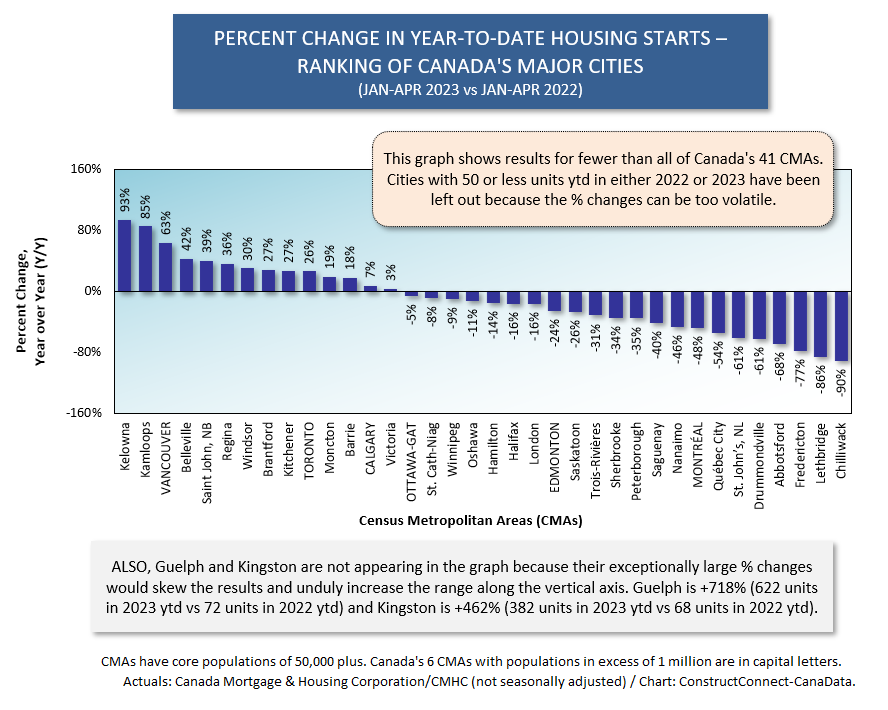
- Provincially, there’s been considerable year-to-date strength in housing starts in British Columbia, +30%, and Ontario, +15%. The only big-population province showing an alarming retreat has been Quebec, -43%. Alberta (-12%) is down somewhat, but that’s because Edmonton’s decrease (-24%) has overwhelmed Calgary’s increase (+7%) (Graphs 12 and 13).
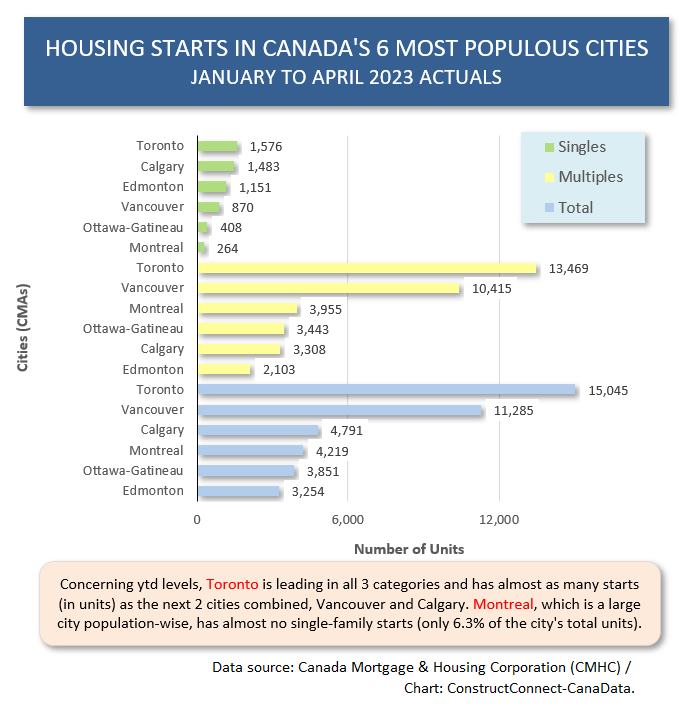
- In unit-level of starts, Toronto is leading all Canadian cities in singles, multiples, and total. In fact, Toronto’s number of housing starts, at 15,000 units, is almost a match for the combined figure from the second- and third-place cities of Vancouver and Calgary. Notice that Calgary has moved into third place ahead of Montreal (Graph 14).
- Compared with U.S. cities, Toronto’s 15,000 units ytd would place it just after Houston’s 23,100 units and Dallas-Ft Worth’s 20,600 units, but ahead of New York’s 14,200 units. Multis as a share of the total in Houston are currently 33%, and in Dallas-Ft Worth, 38%. In Toronto, the relationship is the opposite, and then some. The share claimed by multis in TO is 90%. In NYC, multis as a percent of total are 70%.
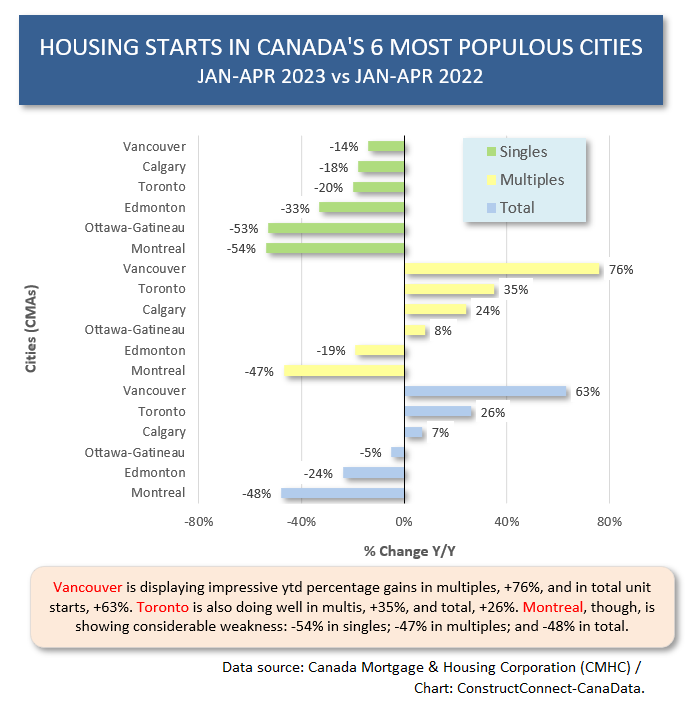
- As for year-to-date percentage changes among major Canadian cities, Vancouver is the standard bearer at +76% for multis and +63% for total (Graph 15). Multi-family starts, in units, are 92% of Vancouver’s total. In Montreal, multis claim 94% of the city’s total (Graph 15).
Graph 1
Graph 2
Graph 3
Graph 4
Graph 5
Graph 6
Graph 7
Graph 8
Graph 9
Graph 10
Graph 11
Graph 12
Graph 13
Graph 14
Graph 15
Alex Carrick is Chief Economist for ConstructConnect. He has delivered presentations throughout North America on the U.S., Canadian and world construction outlooks. Mr. Carrick has been with the company since 1985. Links to his numerous articles are featured on Twitter @ConstructConnx, which has 50,000 followers.


Recent Comments