Joy was expressed by economic commentators when the Bureau of Labor Statistics (BLS) reported May’s year-over-year change in the ‘headline’ Producer Price Index (PPI) to be a mere +1.2%. As Graph 1 illustrates, there’s a close correlation between changes in the Consumer Price Index (i.e., inflation) and changes in the top-level PPI number.
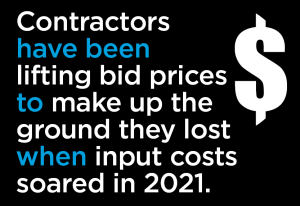 The expectation is that the PPI’s +1.2% y/y will lead the inflation rate, currently +4.0% y/y, further downwards. Before examining some PPI results in detail, more background information is warranted.
There are two main price index series for the U.S. economy. Everyone has heard of the Consumer Price Index (CPI) since it’s the primary indicator of inflation in the country.
Less well known, though, is the Producer Price Index series (PPI) which measures prices charged by producers of goods and services before they reach consumers. The PPI data series is described by the BLS as measuring the prices that apply when products ‘leave the factory gate’ (or their equivalent with respect to services). They don’t include transportation, warehousing, and distribution costs.
The ‘headline’ CPI figure is CPI-U, consumer prices for urban dwellers. The ‘headline’ figure for the PPI carries the title ‘commodity data for final demand,’ which doesn’t roll off the tongue and partially explains its anonymity. Both the CPI and PPI data sets are backed by multitudes of sub-indices, with the latter having considerably more than the former.
Not All Sweetness and Light
What are the PPI’s construction-related sub-series now saying about material inputs into the building process? There have been some encouraging developments; but not all is sweetness and light just yet.
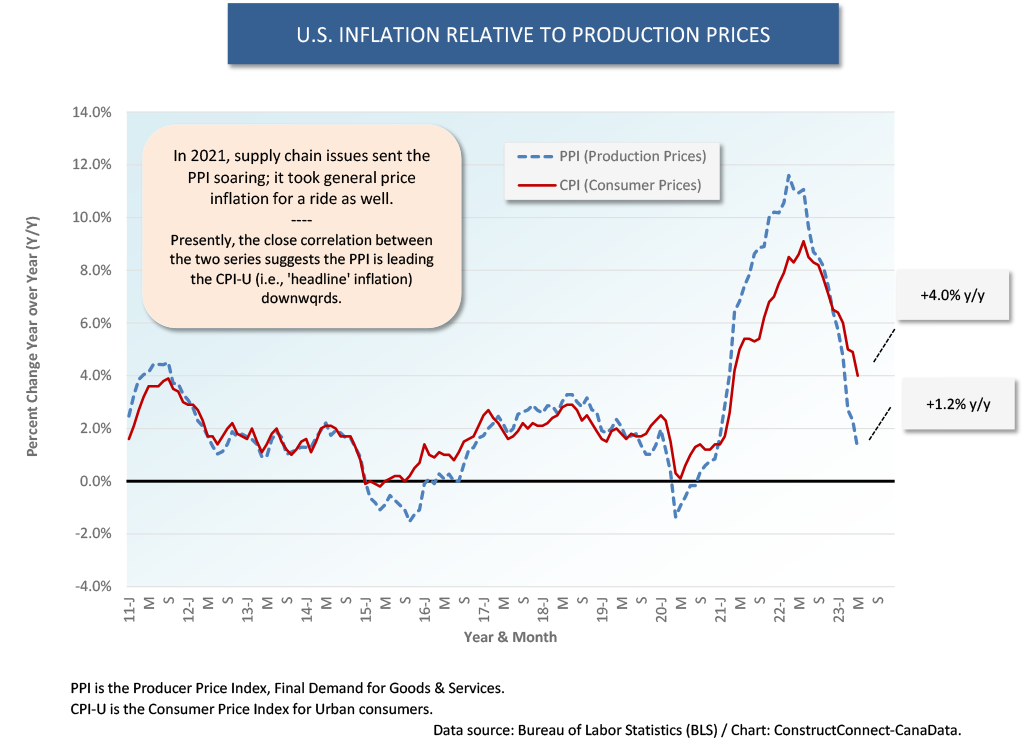
Graph 2 highlights how building material costs are performing relative to contractors’ bid prices. (Don’t be confused by the back-and-forth substitution of the words ‘costs’ and ‘prices’; whichever applies depends on one’s perspective as a buyer or seller.)
The average PPI series for construction material costs (i.e., (A) and (B) are explained in the bottom text box of Graph 2) has gone into a steep slide, to the point where it is negative (-4.7%) year over year. Meanwhile, the PPI bid price index, while decelerating somewhat, remains positive (+10.9%) y/y.
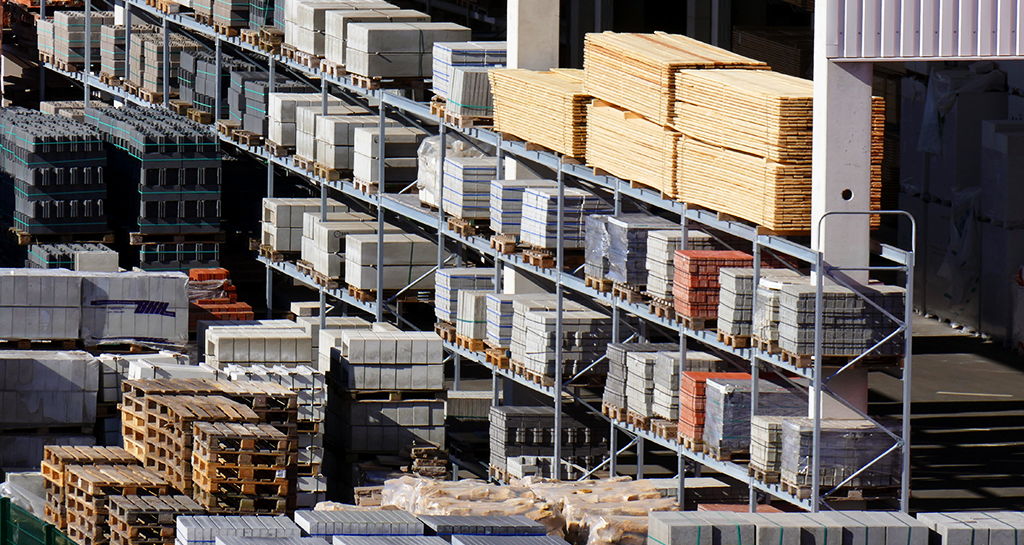
Contractors have been lifting bid prices to make up the ground they lost when input costs soared in 2021. The PPI bid price index and the average of the two main material input indices are close to being fully aligned again, after a wide divergence in the first couple of years of the pandemic.
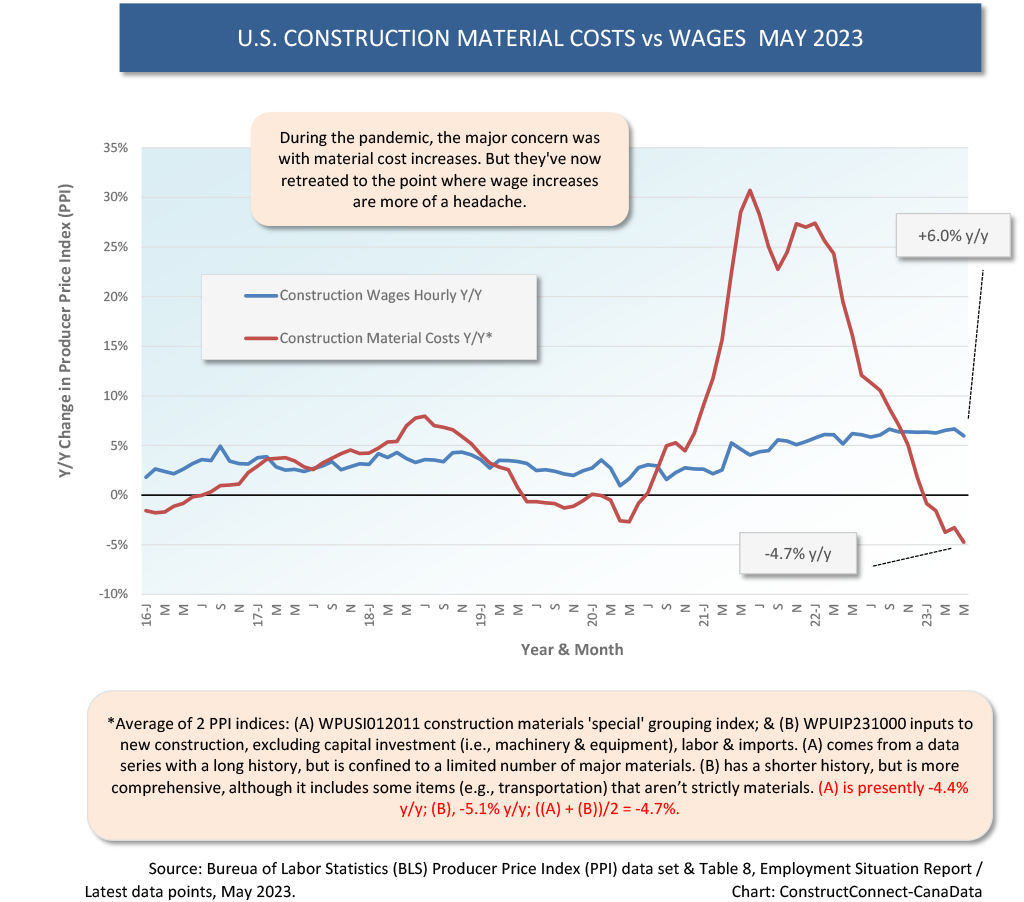
Graph 3 shows that it’s wages ahead of materials that are now the primary source of cost increases for contractors. The former, hourly, are +6.0% y/y to the latter’s -4.7% y/y.
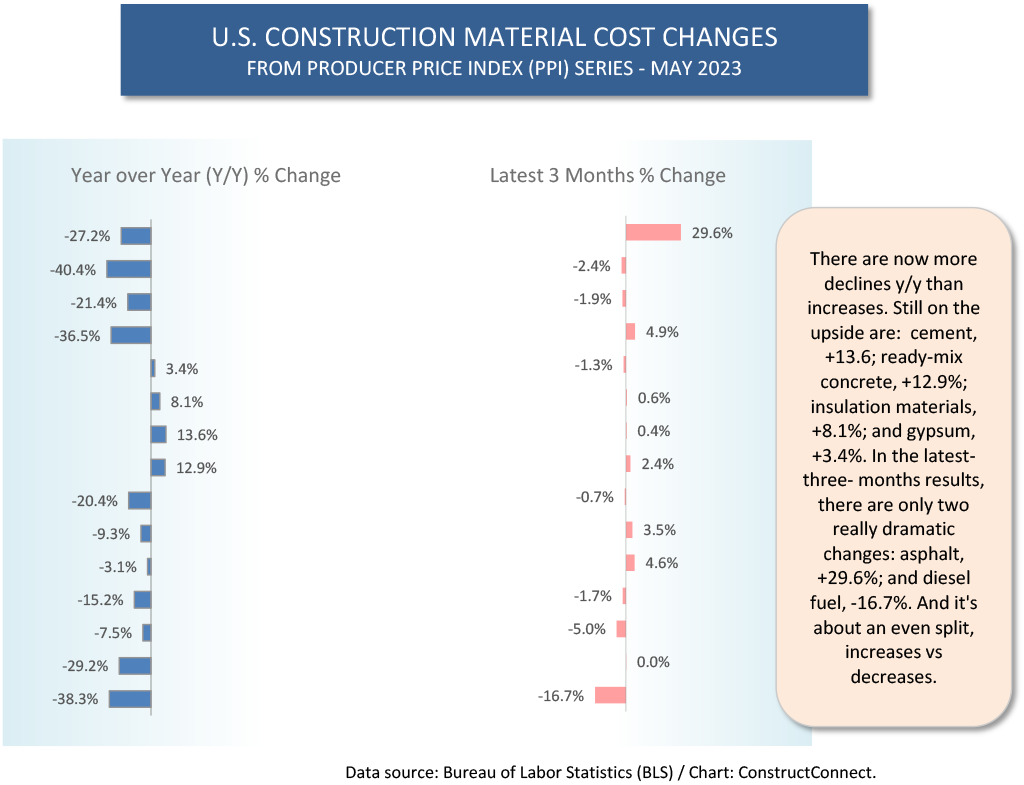
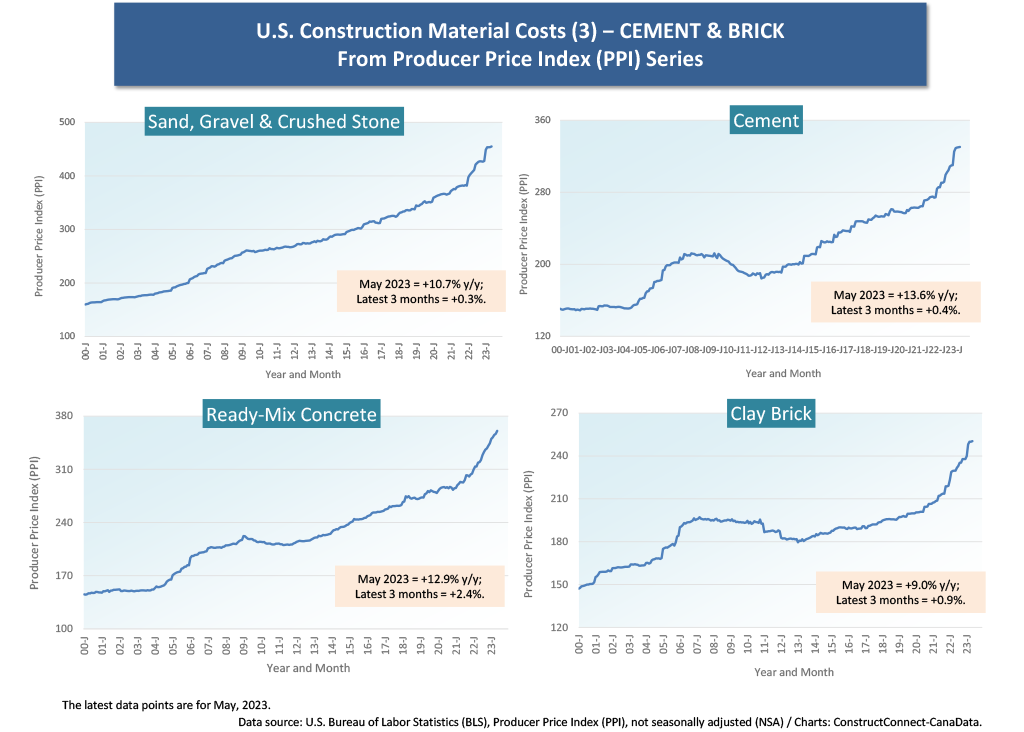
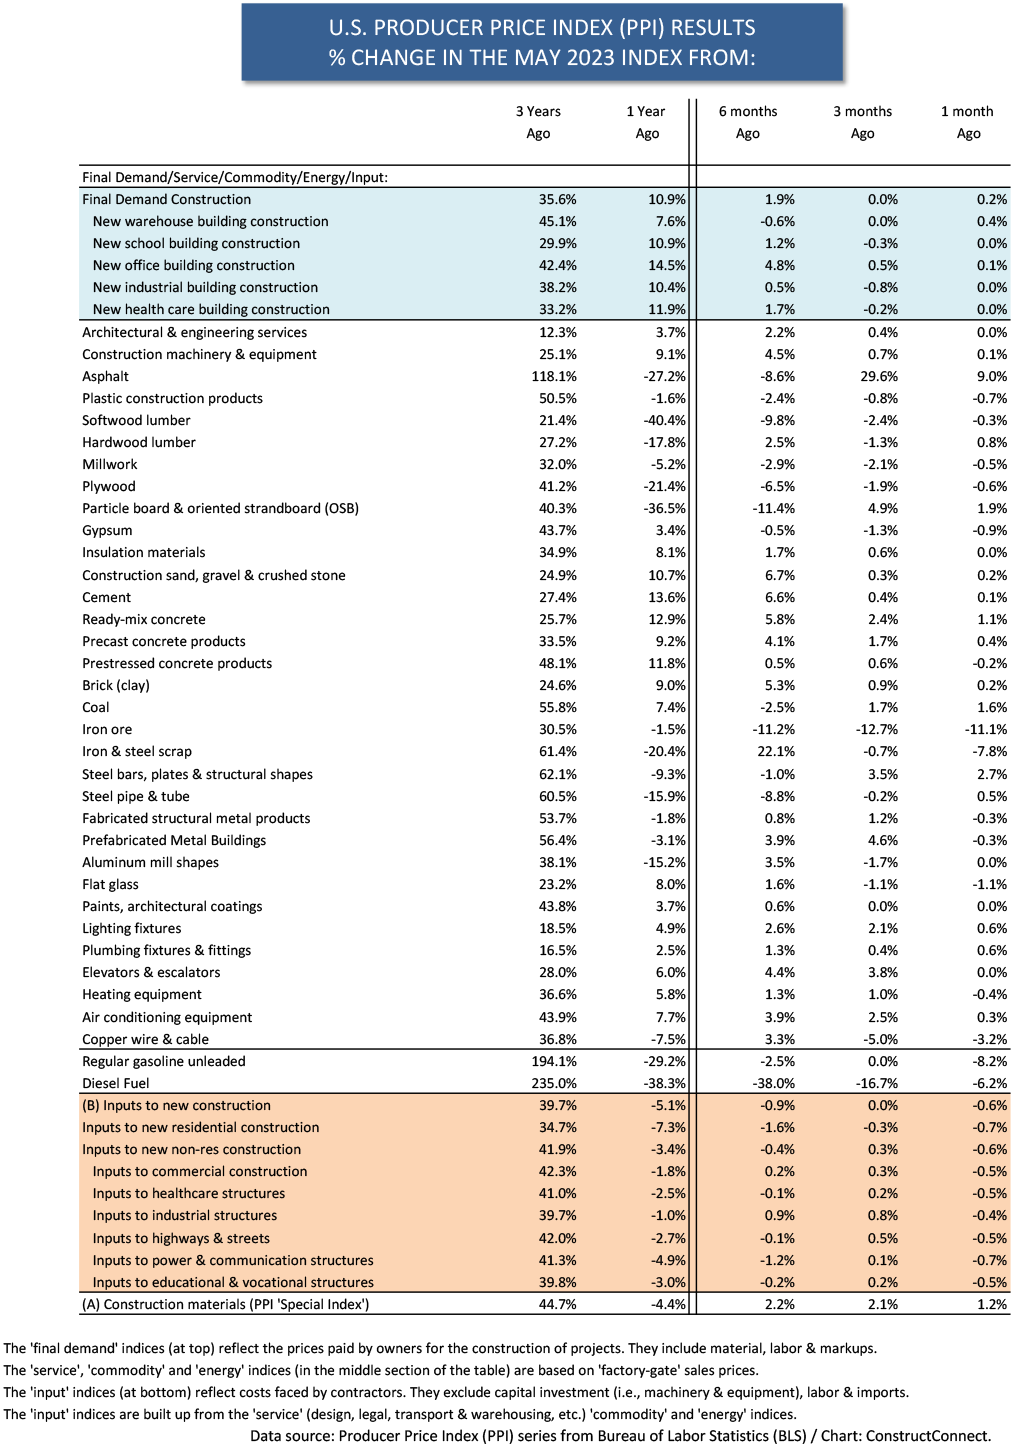
Graph 4 offers a summary picture for 15 construction inputs. In May, only four of the 15 PPI sub-indices were still positive year over year: cement, +13.6%; ready-mix concrete, +12.9%; insulation materials, +8.1%; and gypsum, +3.4%. Softwood lumber, -40.4% y/y, was leading the backsliders, but there were seven other items with double-digit percentage declines.
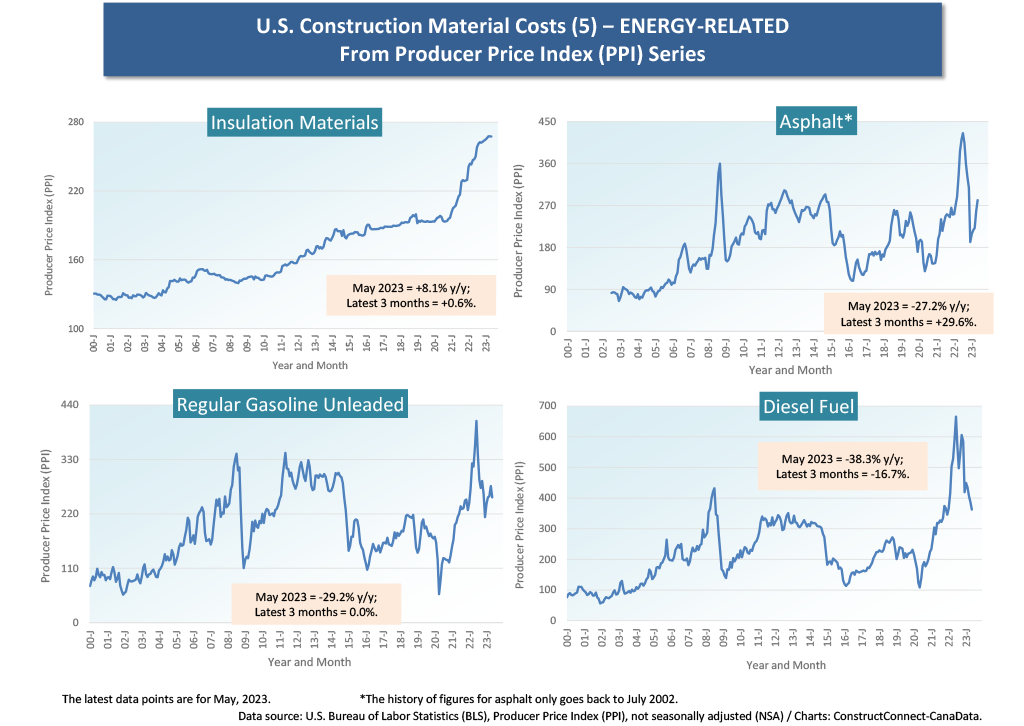
As for latest-three-month changes in May, they were more restrained than they’ve been in a while, except for asphalt, +29.6% and number 2 diesel fuel, -16.7%. (Diesel fuel 2 is for heavy duty trucks; diesel fuel 1 is for lighter driving in some passenger cars.)
Stubborn Resistance to Softening
What are the cluster charts saying? The main indicators may be moving in the right direction, towards moderation, but many of the construction input sub-series are proving stubbornly resistant to softening.
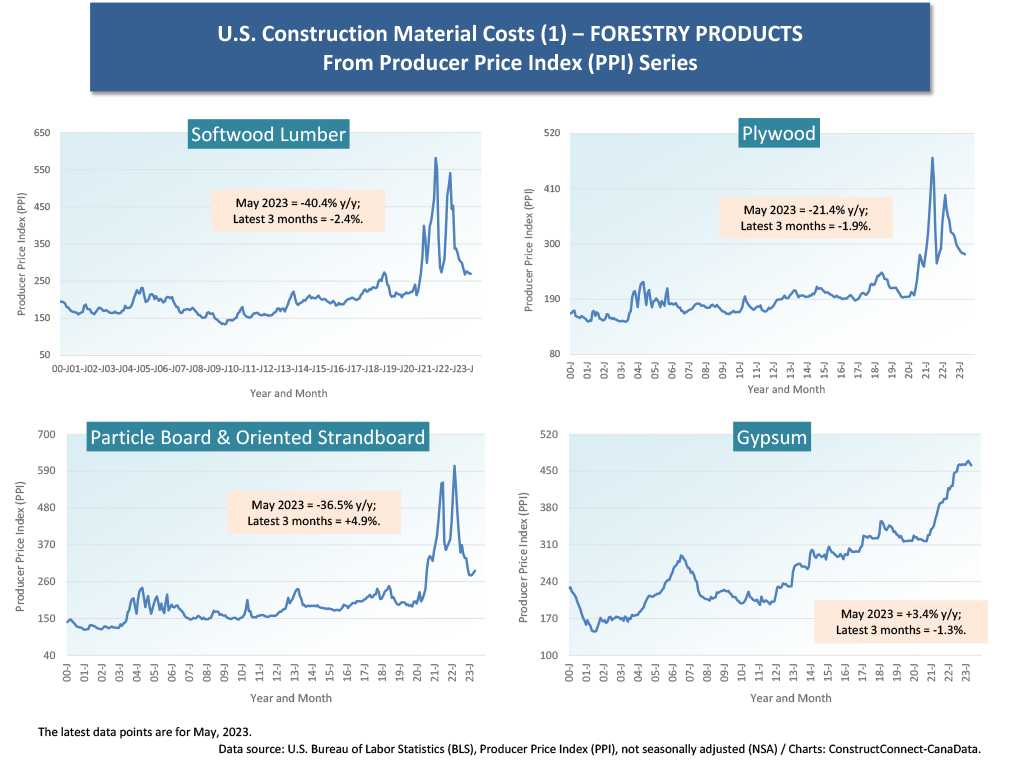
In Cluster Chart 1, the forestry product PPI sub-indices have come well off their previous highs. Gypsum, though, is at its peak and scuttling sideways.
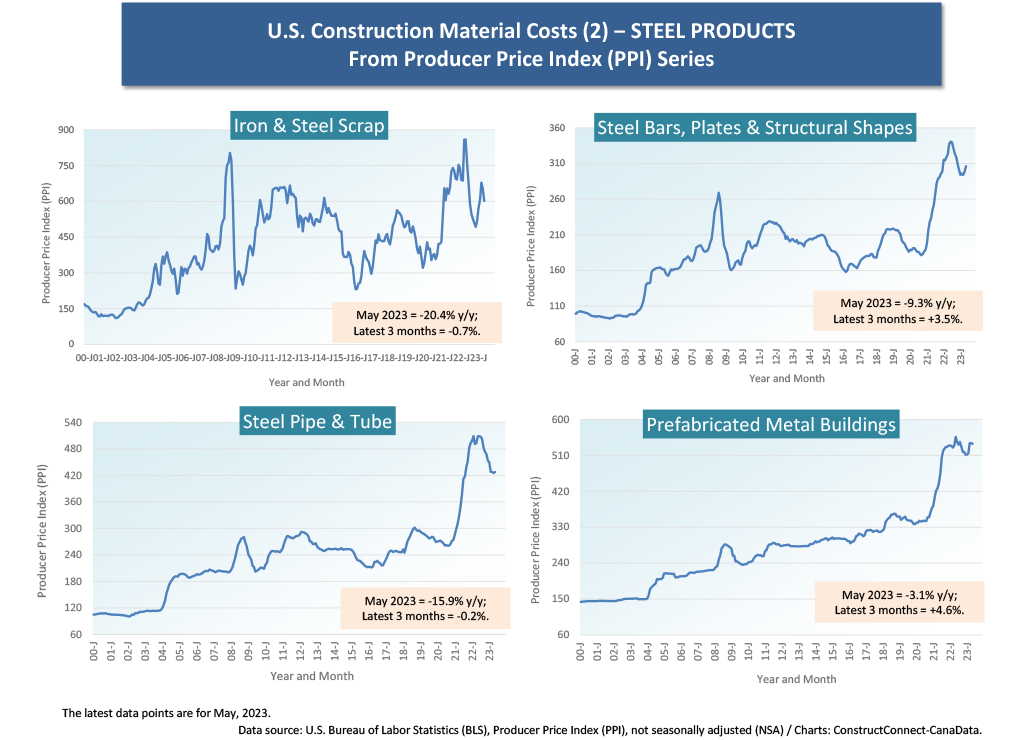
The steel sub-indices in Cluster Chart 2 have backed off from their summits, but they remain elevated relative to historical positions.
The cement-related sub-indices in Cluster Chart 3 are a surprise. They’re giving little indication that much thought is being given to retreats.
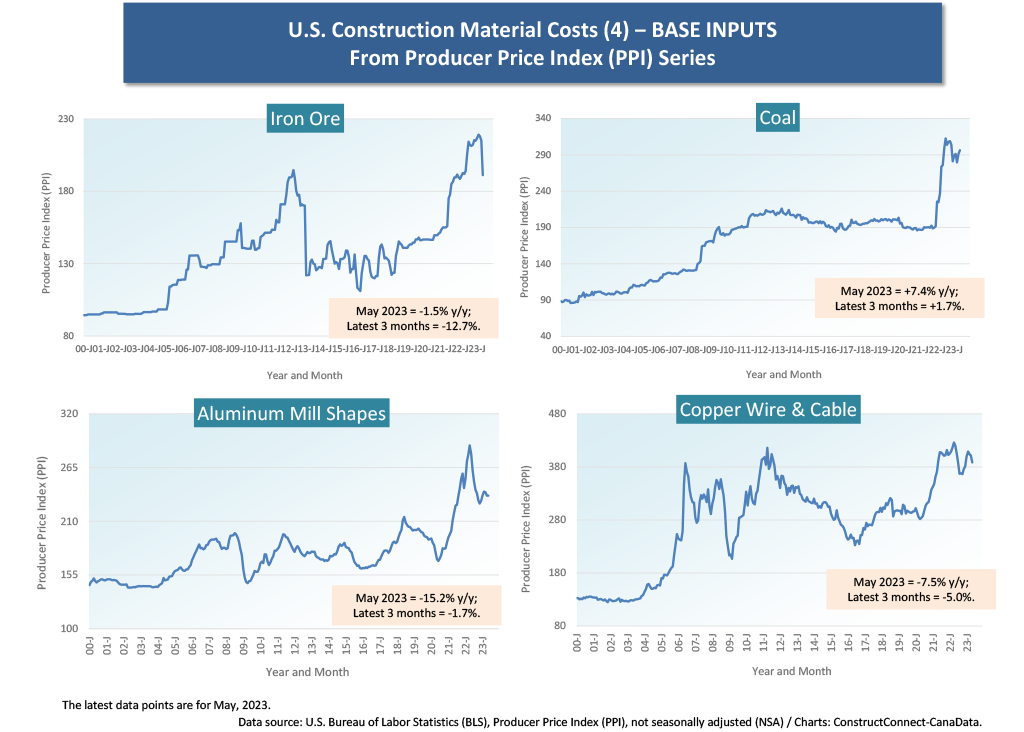
The base input sub-indices in Cluster Chart 4 have taken steps backwards, but they too continue to be at levels higher than old-time norms.
Cluster Chart 5’s energy-related sub-indices have past patterns of significant volatility. They are currently about in the middle of their ranges. Insulation materials, though, are sticky at their peak.
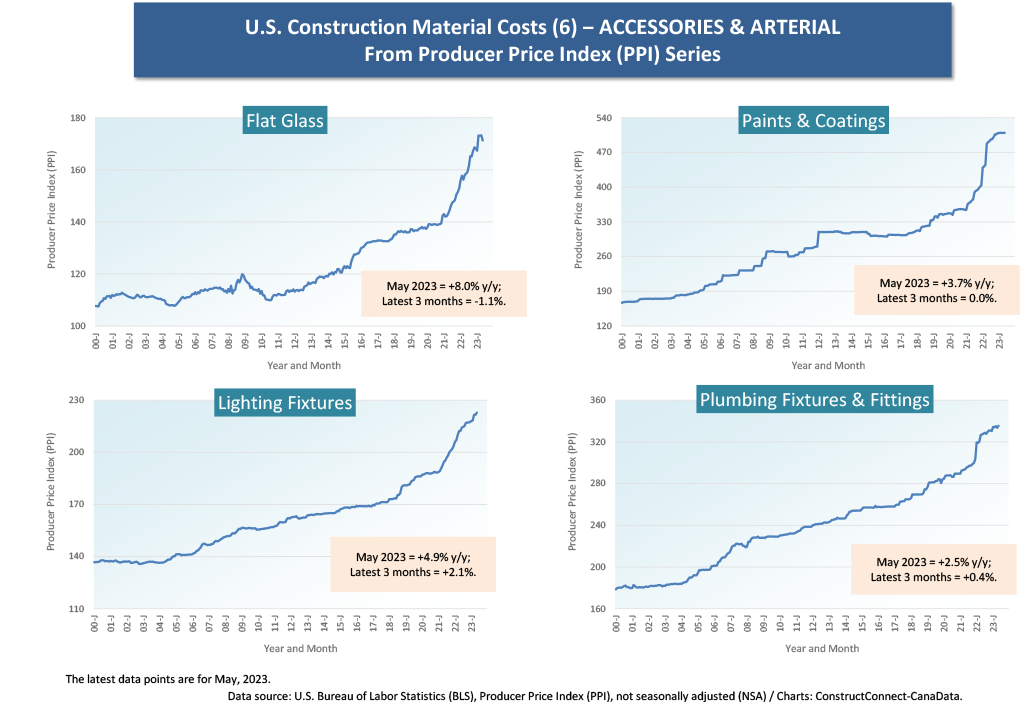
In Cluster Charts 6 and 7, ̶ for glass, paints and coatings, light and plumbing fixtures, heating and cooling equipment, etc., ̶ the curves go up and they show almost no signs of relenting.
Table 1 at the end of this article has more detailed information on the relevant PPI construction input sub-series.
Graph 1
Graph 2
Graph 3
Graph 4
Cluster Chart 1
Cluster Chart 2
Cluster Chart 3
Cluster Chart 4
Cluster Chart 5
Cluster Chart 6
Cluster Chart 7
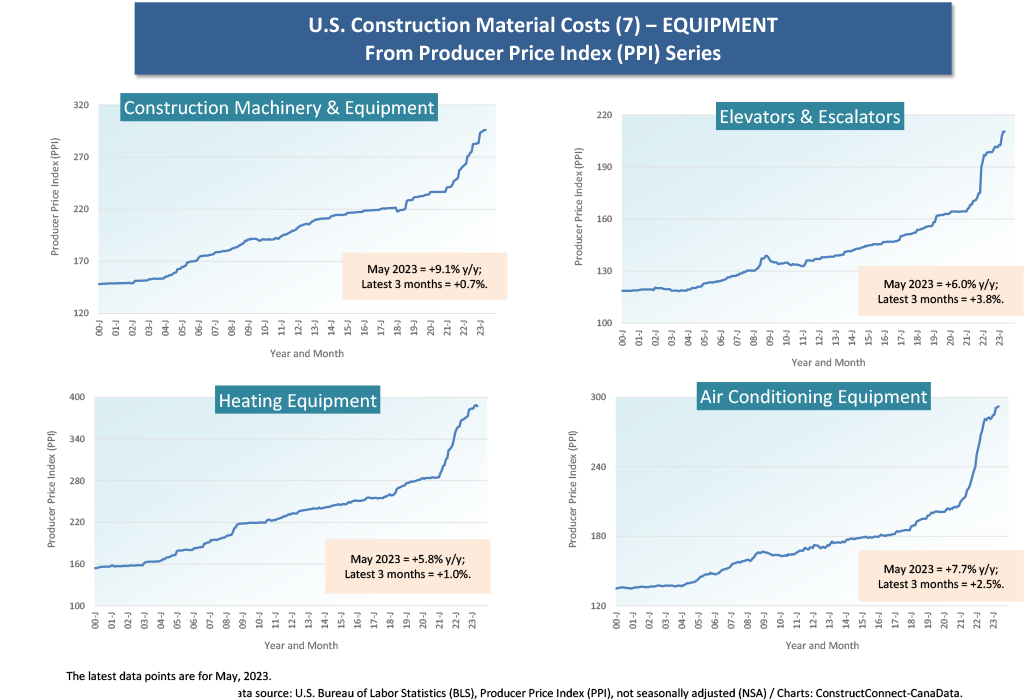
Table 1
Alex Carrick is Chief Economist for ConstructConnect. He has delivered presentations throughout North America on the U.S., Canadian and world construction outlooks. Mr. Carrick has been with the company since 1985. Links to his numerous articles are featured on Twitter @ConstructConnx, which has 50,000 followers.


Recent Comments