
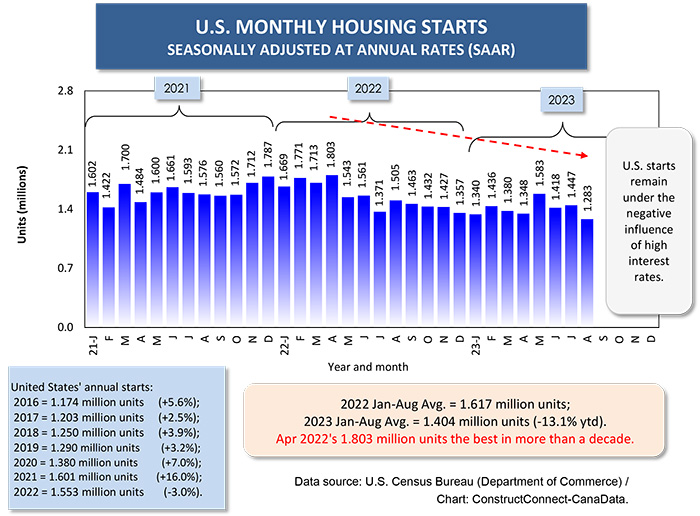
The month-to-month descending path of U.S. housing starts due to progressive increases in interest/mortgage rates and shock-inducing new and resale home prices has not yet ended (see Graph 1). April 2023’s level of new residential groundbreakings was -28.8% compared with March 2022, moving from 1.803 million units to 1.283 million (both seasonally adjusted and annualized).
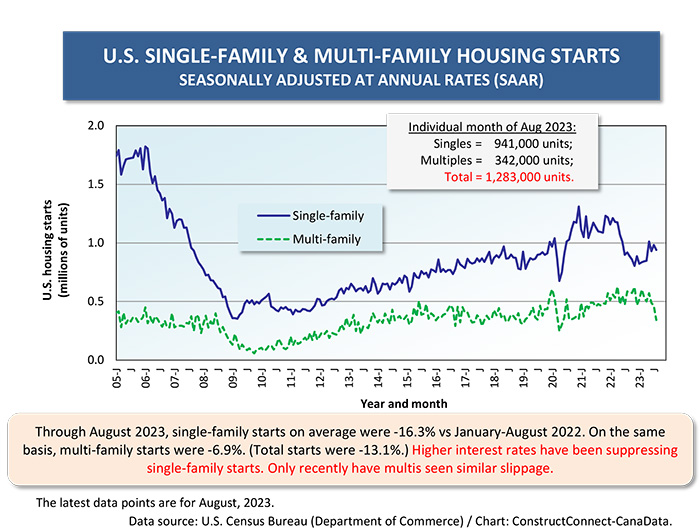
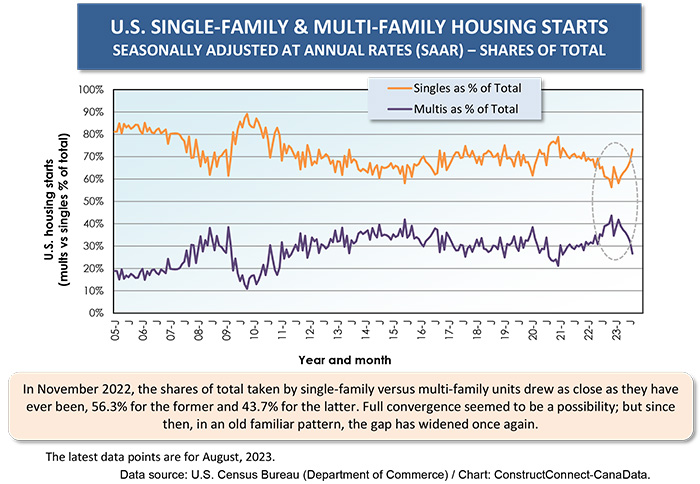
Until recently, the downturn was entirely concentrated in the single-family market. Over the last couple of months, however, multi-family starts have also been caught in the downdraft. Where once it appeared there might be convergence of the shares of total unit starts contributed by singles versus multiples, the gap has once again widened considerably, with singles now at more than 70% and multis at less than 30% (Graph 4).
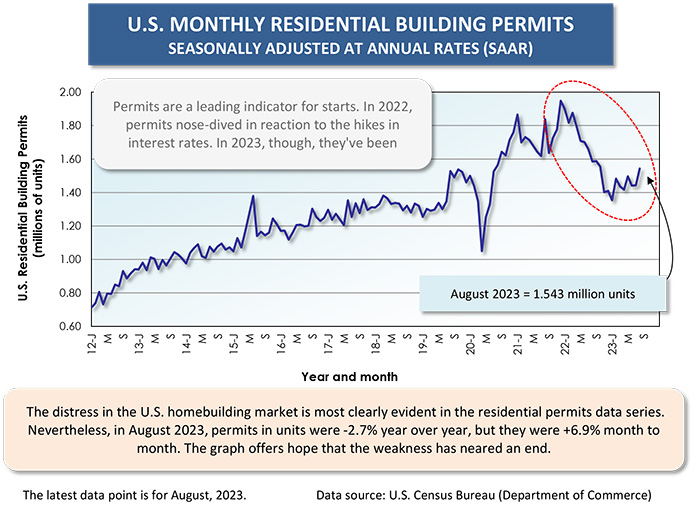
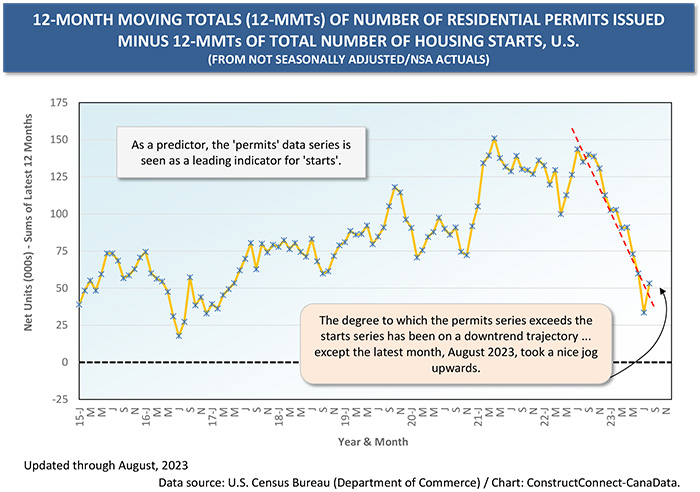
 The residential permits data does offer some hope that the slide in starts may be reaching an end. Permits point the way to shovels in the ground (i.e., the starts). The steep descent of permits in 2022, has transitioned to a saw-toothed climb in 2023 (Graph 5). And the sharp compression of the difference between permits and starts, both as 12-month moving totals, has reversed in the latest month (Graph 6).
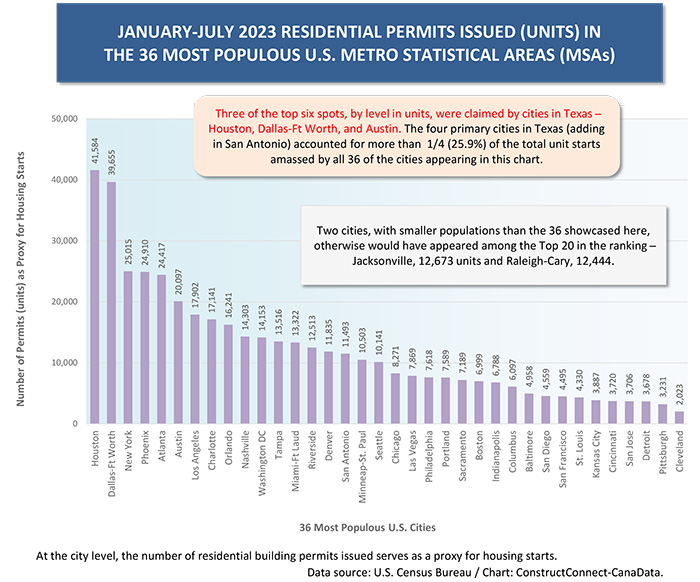
The incredible number of residential building permits being issue by the two most populous cities in Texas remains a compelling story. At 41,600 units and 39,700 units respectively year to date through July, Houston and Dallas-Fort Worth have commanding leads over all other major U.S. urban centers (Graph 8). The next-ranked cities of New York, Phoenix, and Atlanta are well back with approximately 25,000 units each, year to date.
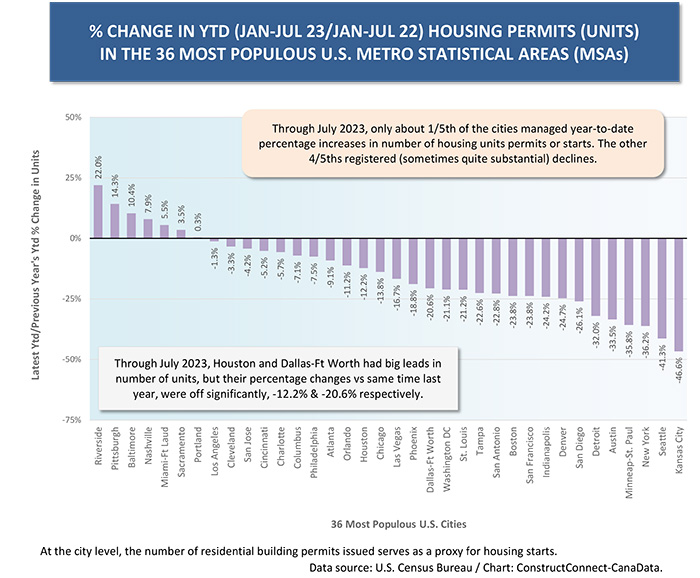
Houston and Dallas-Ft Worth are accounting for nearly one-fifth (18.6%) of total residential permits issued in the nation’s 36 largest population centers. The four major cities in Texas (i.e., drawing in Austin and San Antonio as well) are providing one-quarter (25.9%) of the 36-city total. This dominance is happening despite year-over-year unit declines in all four instances: Houston, -12.2%; Dallas-Ft Worth, -20.6%; San Antonio, -22.8%; and Austin, -33.5%.
One in three Americans lives in one of four big-population states: California (39.0 million people on July 1, 2022); Texas (30.0 million); Florida (22.2 million); and New York (19.7 million).
Between July 1, 2021, and July 1, 2022, while the population of the entire U.S. grew by +0.4%, the change in resident count for Florida was +1.9%; for Texas, +1.6%; California, -0.3%; and New York, -0.9%. Texas is among a select number of states with large population gains.
Also interesting are population density statistics. Among the Big 4 states, New York has the greatest number of people per square mile, at 418; Florida is a close second, 415; California is much less dense 250; and Texas is comparatively wide-open, at 115 persons per square mile.
Housing Starts in Canada
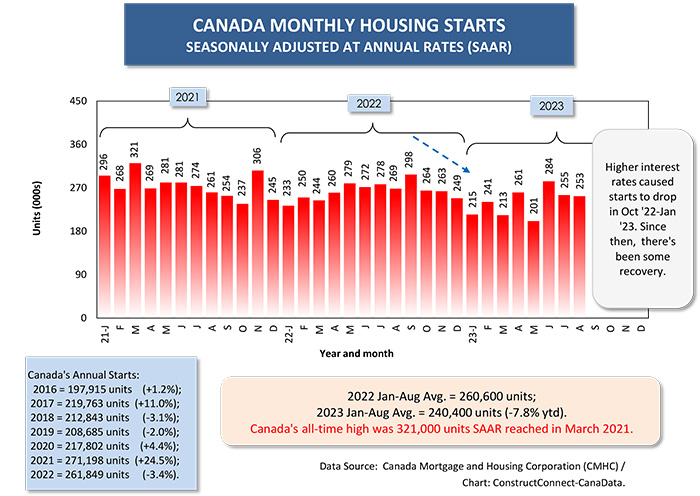
In Canada, housing starts fell sharply in the back half of 2022. In 2023, though, while bouncing around a bit from month to month, they’ve basically stabilized around 240,000 units annualized (Graph 10).
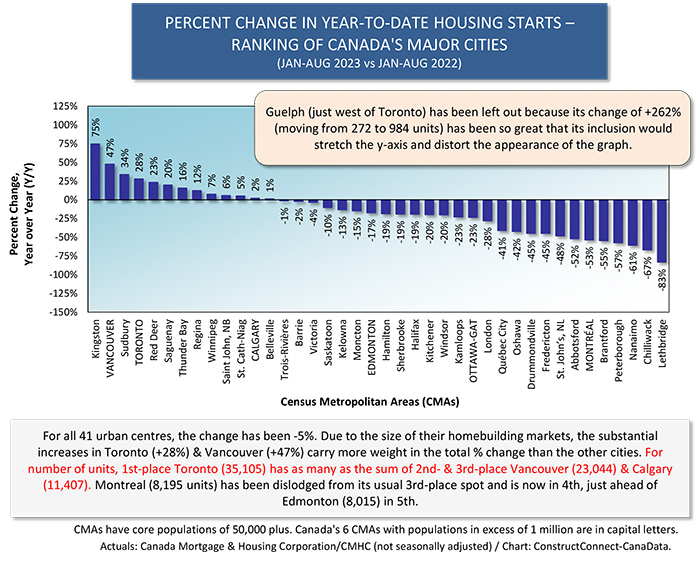
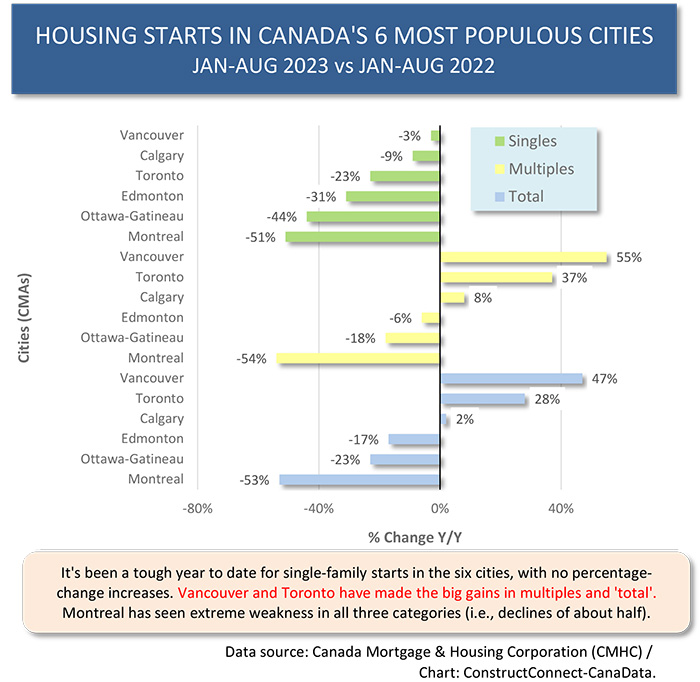
Among Canada’s major cities, Vancouver and Toronto have been standing out for large percentage gains in unit starts, +47% and +28% respectively, through August 2023.
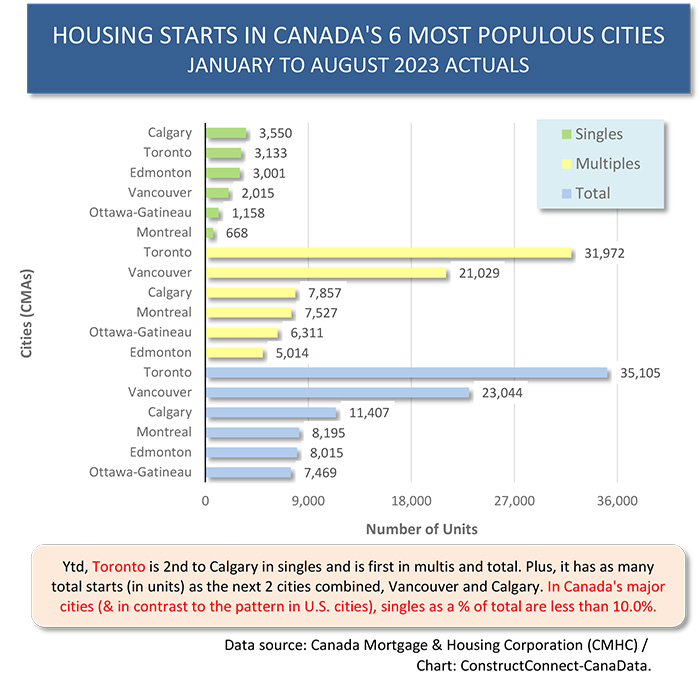
Also noteworthy is that the number of housing starts in first-place Toronto this year so far, at 35,100 units, is greater than for the second- and third-ranked cities combined, Vancouver (23,000 units) and Calgary (11,400 units) (Graph 12).
Calgary has bumped Montreal (8,200 units) back into fourth spot, just ahead of Edmonton (8,000), for number of housing units started. Montreal has had a terrible year for housing starts, down by more than half in all three categories: singles (-51%); multiples (-54%); and total (-53%) (Graph 13).
In a joint U.S.-Canadian overview, Toronto is among the elite players for housing starts, but it’s still not on a par with Houston and Dallas-Ft Worth.
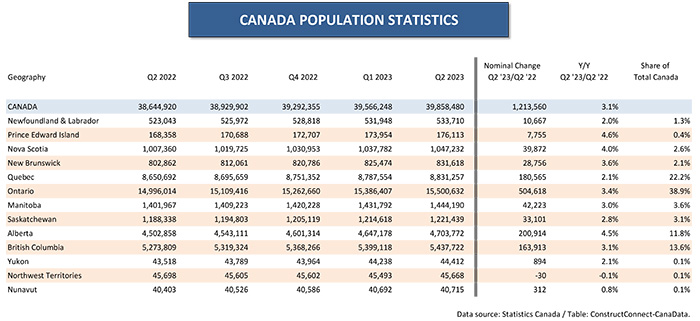
No doubt high mortgage rates and exorbitant home prices place heavy weights on Canadian homebuilding. But there’s a factor in Canada that must inevitably play the most crucial of roles, the extraordinary population growth that is occurring in the country (Table 1).
Governments at every level are grappling with the question of how to accommodate all the new people, driven by various forms of immigration (permanent, temporary, work-related, foreign student, etc.) who are taking up residence in Canada.
The national population growth rate in the latest recorded period, Q2 2023 versus Q2 2022, was +3.1%. Alberta’s figure was +4.5%. Ontario, at +3.4%, was also above the national average.
Canadian annual housing starts north of 300,000 units must quickly become the norm.
There’s been a longstanding rule of thumb that the population of the United States is 10 times greater than Canada’s. Due to the disparity in their population growth rates, that ‘old saw’ no longer applies. The ratio, according to the population clocks for both countries, has now diminished to 8.3 to 1.0.
Graph 1
Graph 2
Graph 3
Graph 4
Graph 5
Graph 6
Graph 7
Graph 8
Graph 9
Graph 10
Graph 11
Graph 12
Graph 13
Graph 14
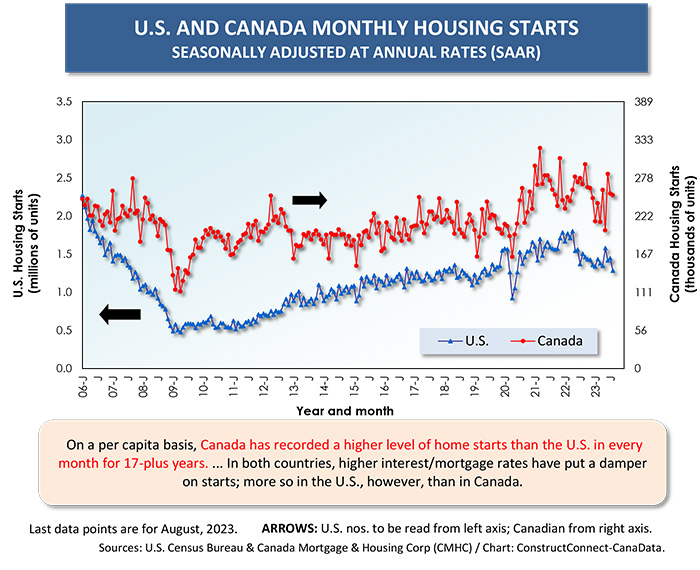
Table 1
Alex Carrick is Chief Economist for ConstructConnect. He has delivered presentations throughout North America on the U.S., Canadian and world construction outlooks. Mr. Carrick has been with the company since 1985. Links to his numerous articles are featured on Twitter @ConstructConnx, which has 50,000 followers.


Recent Comments