Forecaster Charts & Tables
Foreign Trade
Improving export sales propel construction in resource development and manufacturing plant expansions.
Canada's Foreign Trade: The Merchandise Trade Balance
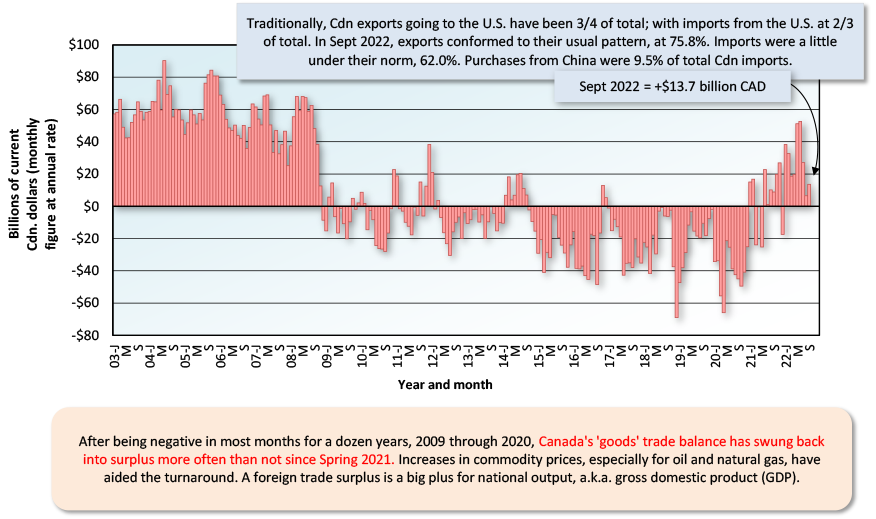
The last data point is for September 2022.
Based on seasonally adjusted monthly figures, projected at an annual rate.
Data source: Statistics Canada / Chart: ConstructConnect – CanaData.
U.S. Foreign Trade: Goods & Services Balance
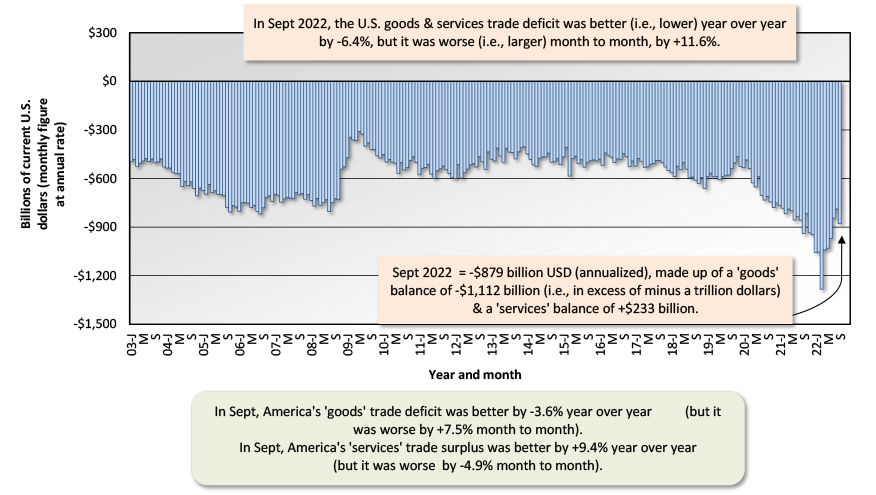
The last data point is for September 2022.
Based on seasonally adjusted monthly figures, projected at an annual rate.
Data source: Bureau of Economic Analysis (BEA) / Chart: ConstructConnect – CanaData.
Canada’s Key Export Product Sales by Province
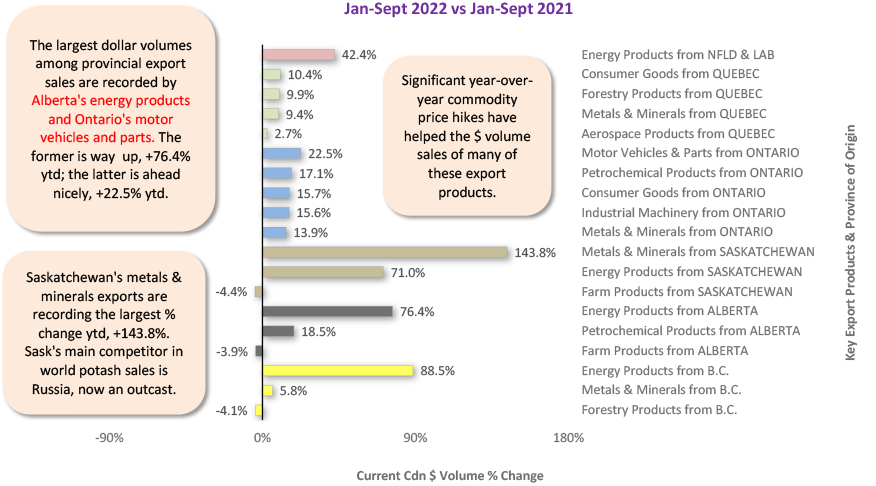
Jan-Sept 2022 vs Jan-Sept 2021.
Data source: Statistics Canada Table 12-10-0119-01/Chart: ConstructConnect — CanaData.
Geographic Sources of Total U.S. Foreign Trade Deficit in Goods
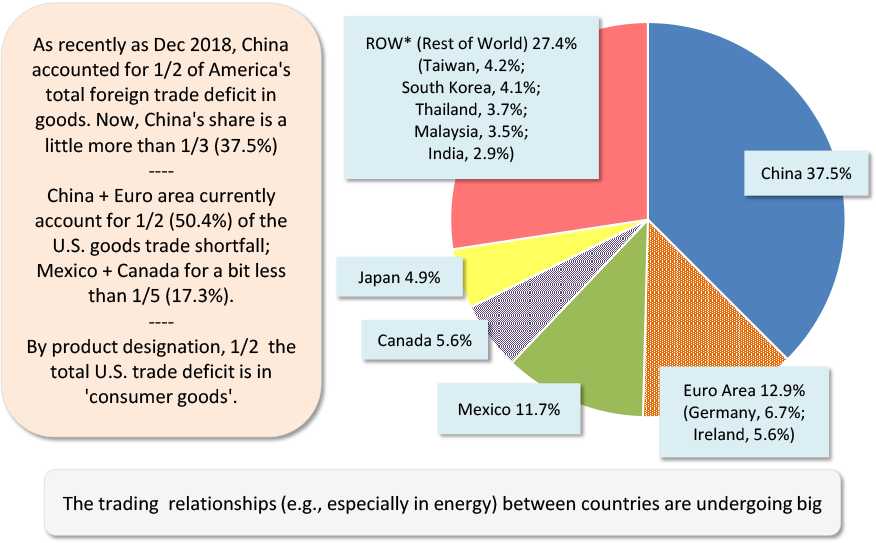
Data source: U.S. Census Bueau and Bureau of Economic Analysis (BEA)/Chart: ConstructConnect — CanaData.
Canada’s Foreign Trade by Major Goods and Commodities
N/A or “not applicable” is when the signs don’t match or the percent change is too high.
An explanation of the percent change when both the before and after numbers are negative: when a negative becomes more negative, that’s a plus (i.e., a greater deficit.) When a negative become less negative, that’s a minus (i.e., a smaller deficit).
Data source: Statistics Canada Table 12-10-0121-01 (seasonally adjusted current dollar monthly figures).
Table: ConstructConnect — CanaData.
Recent Comments