Forecaster Charts & Tables
Inflation
Inflation that becomes excessive drives up interest rates, fueling the cost of future construction projects.
U.S. vs Canada Core* Inflation (CPIs Less Food and Energy)
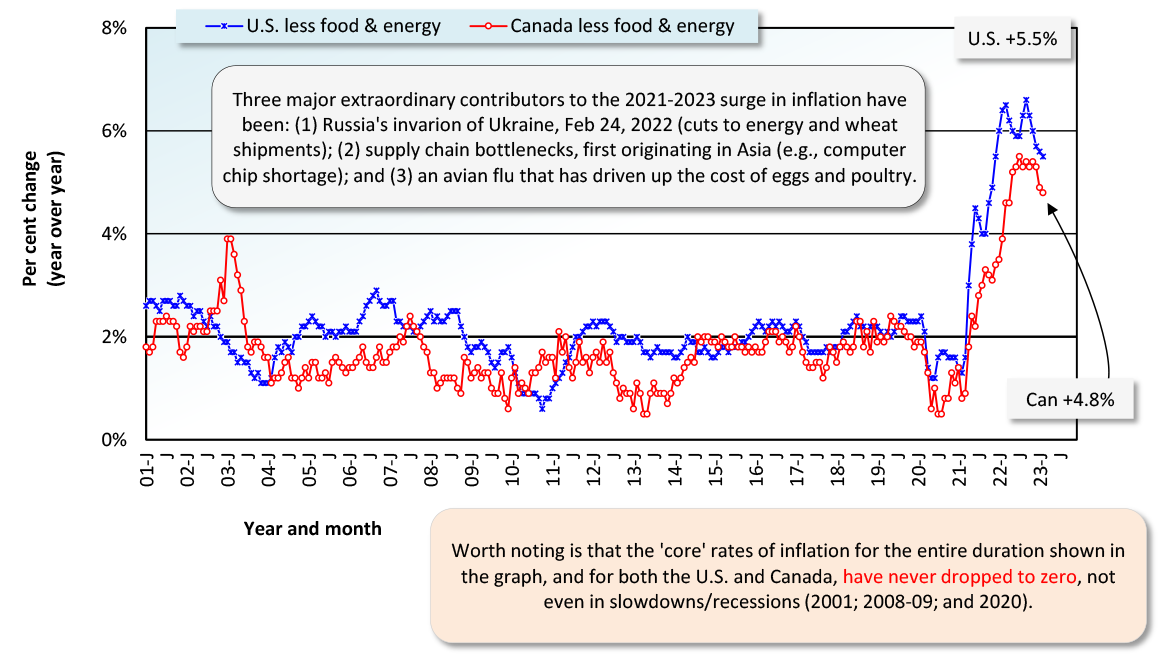
Latest data points are for February 2023.
*Core is all-items inflation less its often most volatile sub-components, food and energy.
Sources: Statistics Canada and U.S. Bureau of Labor Statistics (BLS) (Based on not seasonally adjusted/NSA index values.)
Chart: ConstructConnect-CanaData.
Canada Inflation: All Items CPI vs Core* (Not Seasonally Adjusted)
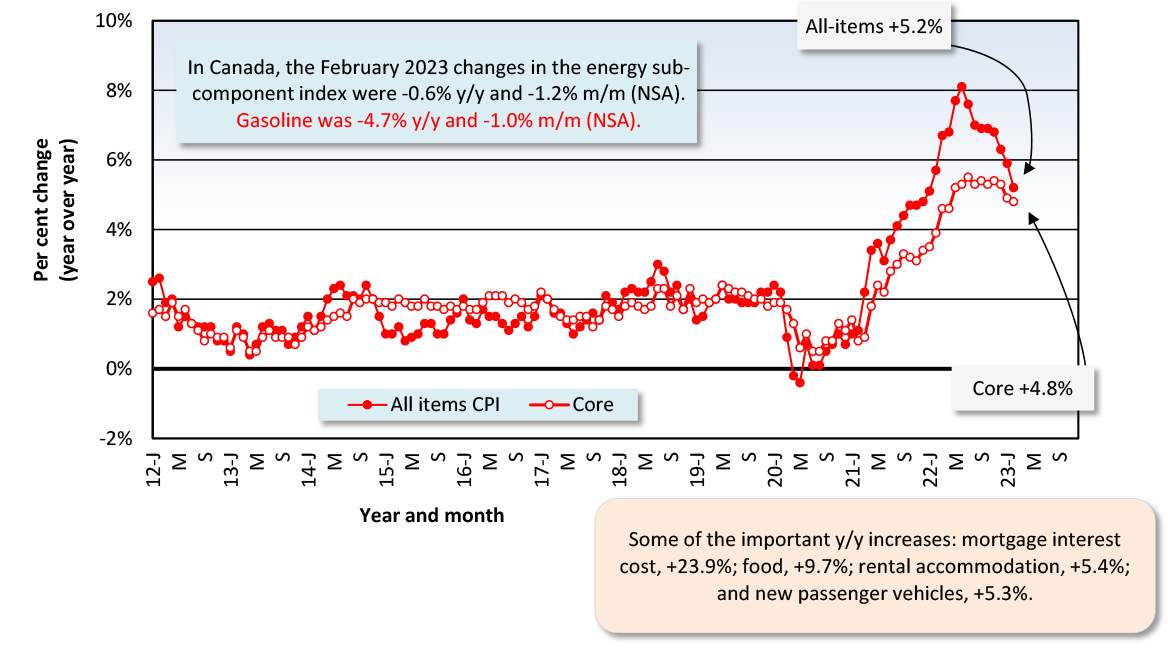
The latest data points are for February 2023.
The Canada figure (CPI) is the All Items Consumer Price Index.
*Core inflation is CPI-U less its often most volatile sub-components, food and energy.
Data source: Statistics Canada / Chart: ConstructConnect — CanaData.
U.S. Inflation: All Items (CPI-U) vs All Items Less Food & Energy (i.e., ‘Core’*) (Not Seasonally Adjusted)
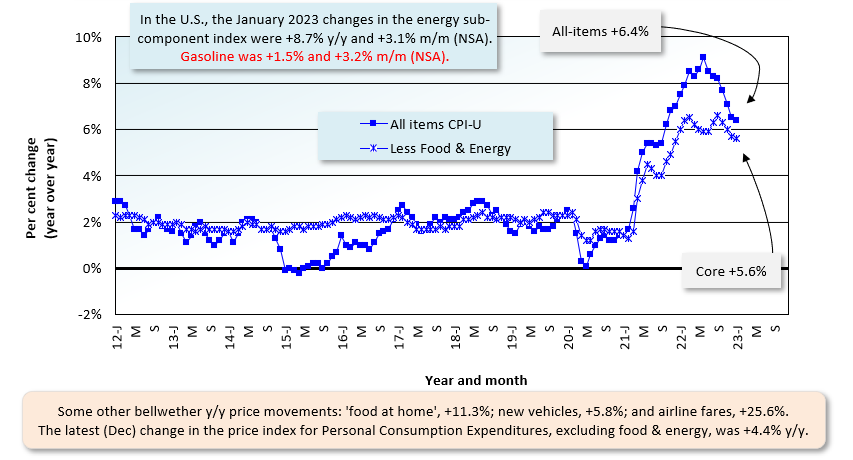
The latest data points are for February 2023.
The U.S. figure (CPI-U) is the All Items Consumer Price Index for All Urban Consumers.
*Core inflation is CPI-U less its often most volatile sub-components, food and energy.
Data source: U.S. Bureau of Labor Statistics (Department of Labor).
Chart: ConstructConnect — CanaData.
U.S. vs Canada All-Items Inflation (CPI & CPI-U)
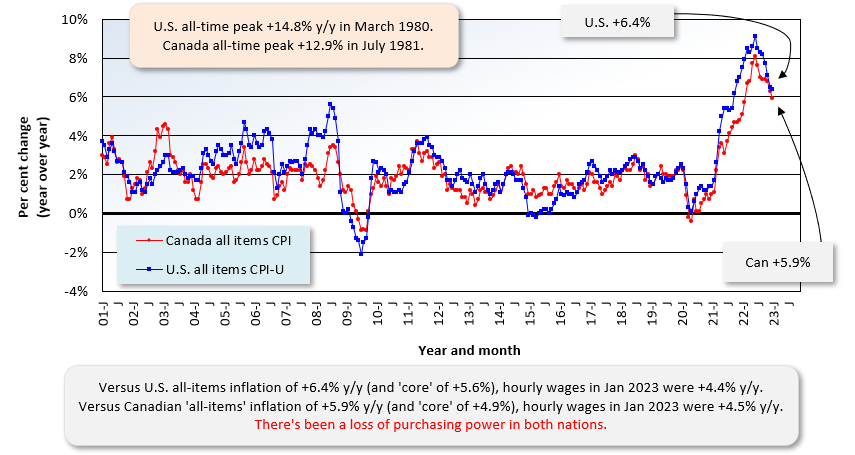
Latest data points are for January 2023.
Based on not seasonally adjusted (aka NSA) index values.
Data sources: Statistics Canada and U.S. Bureau of Labor Statistics (BLS).
Chart: ConstructConnect-CanaData.
Inflation Measures (Year over Year) U.S. and Canada
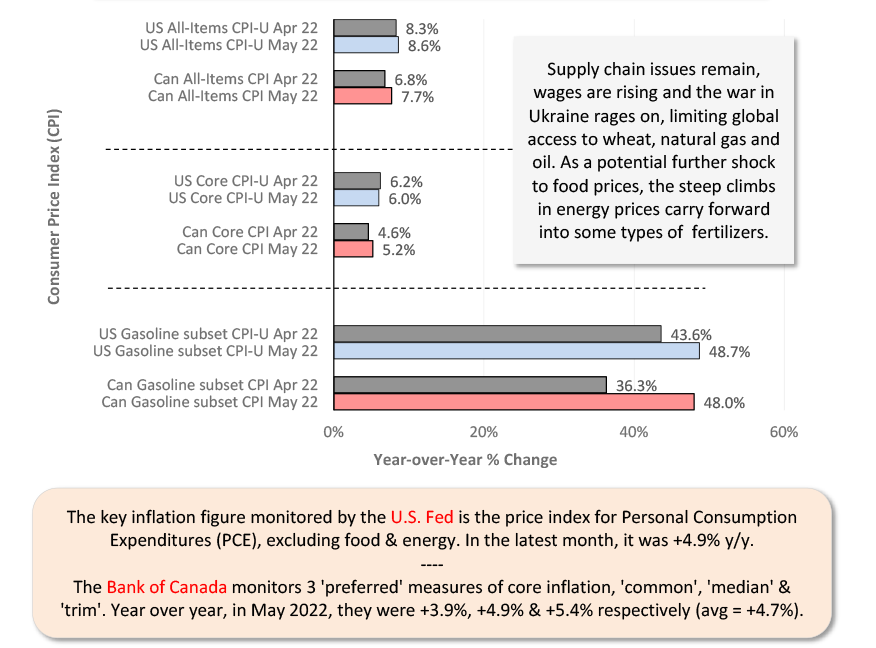
(Previous Month & Current Month – April & May 2022)
*’Core’ inflation for both countries excludes highly price-volatile items − i.e., mainly food & energy products.
Data sources: Bureau of Labor Statistics & Statistics Canada / Chart: ConstructConnect-CanaData.
Hi I’d like to inquire about the Reed Index for Ontario. How can i obtain this data?