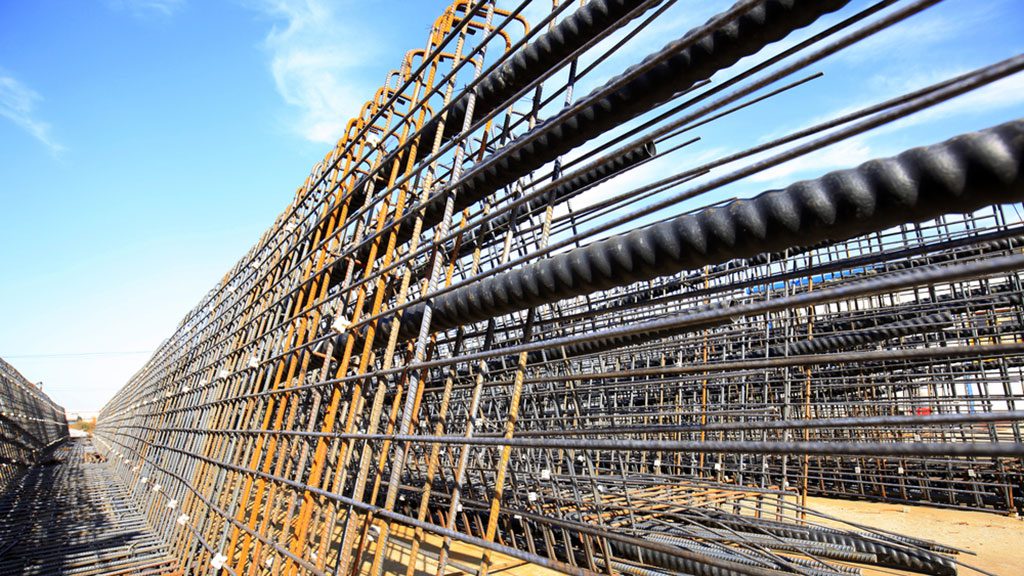
Soaring lumber and steel prices are all the talk in construction circles these days. Short of going directly to suppliers or specialty newsletters for information, the best source of data on construction material cost movements is to be found in the Producer Price Index (PPI) figures published by the Bureau of Labor Statistics (BLS).
 for Construction Soft in June, +2.2% Y/Y")
The January 2021 PPI numbers confirm that lumber- and steel-related markets, as well as some others, are, indeed, ‘hot’.
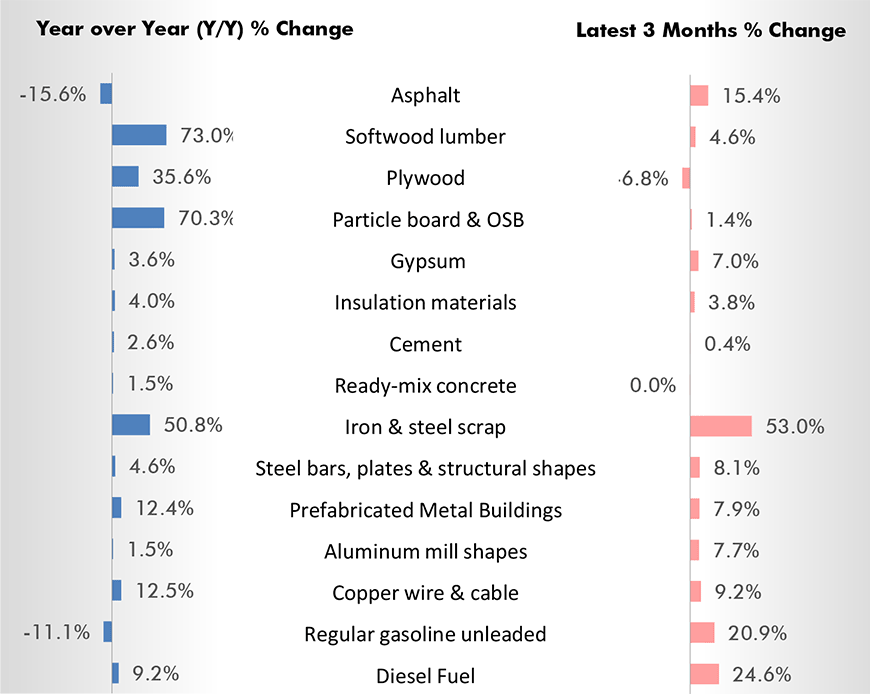
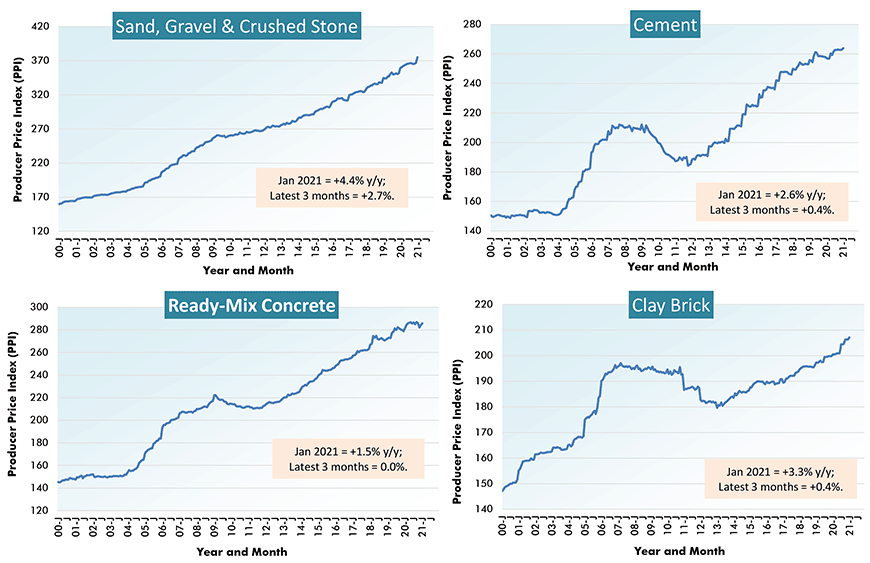
Graph 1 sets out PPI percentage changes for 15 crucial construction material inputs over two distinct time frames, the past year and the latest three months.
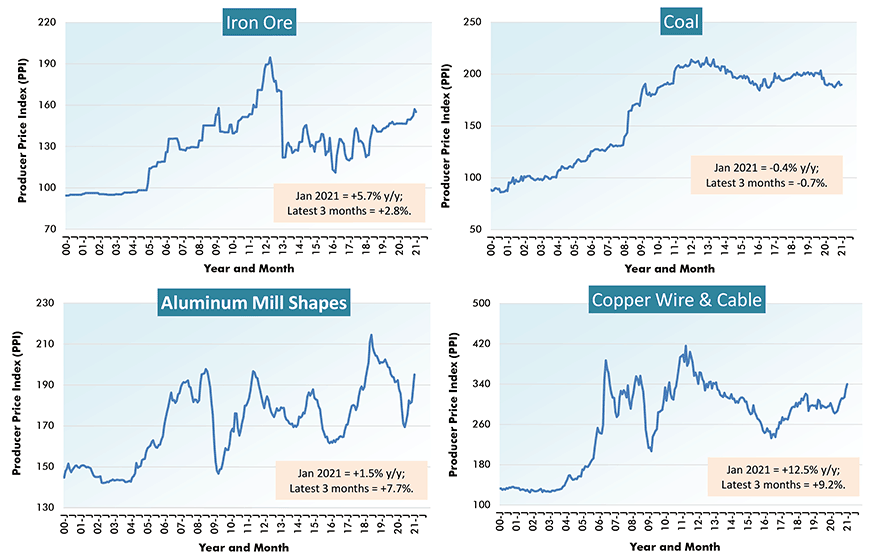
On a year-over-year basis, the biggest price movements have been recorded by softwood lumber, +73.0%; particle board and oriented strand board (OSB), +70.3%; iron and steel scrap, +50.8%; plywood, +35.6%; copper wire and cable, +12.5%; and prefabricated metal buildings, +12.4%.
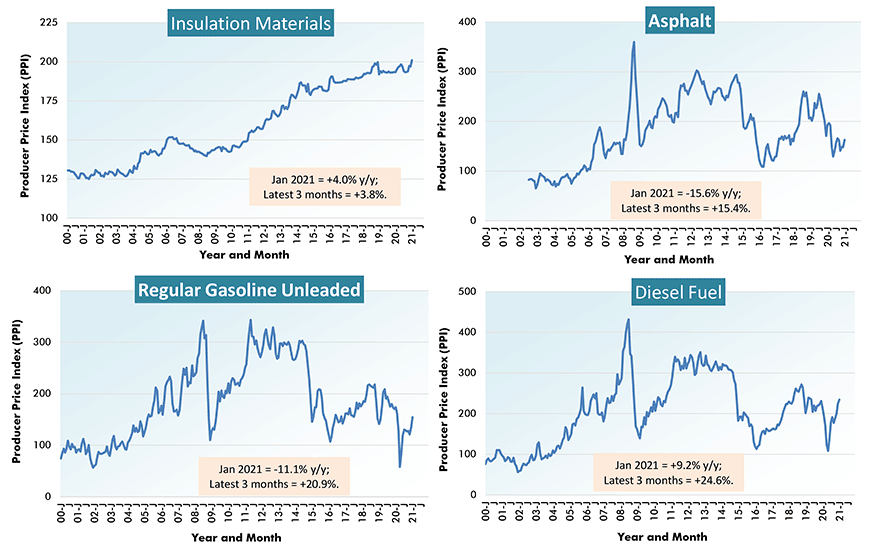
Over the past three months, the advances have been led by iron and steel scrap, +53.0%; diesel fuel, +24.6%; regular gasoline, +20.9%; asphalt, +15.4% (although it’s still -15.6% y/y); copper wire and cable, +9.2%; steel bars, plates and structural shapes, +8.1%; prefabricated metal buildings, +7.9%; aluminum mill shapes, +7.7%; and gypsum, +7.0%.
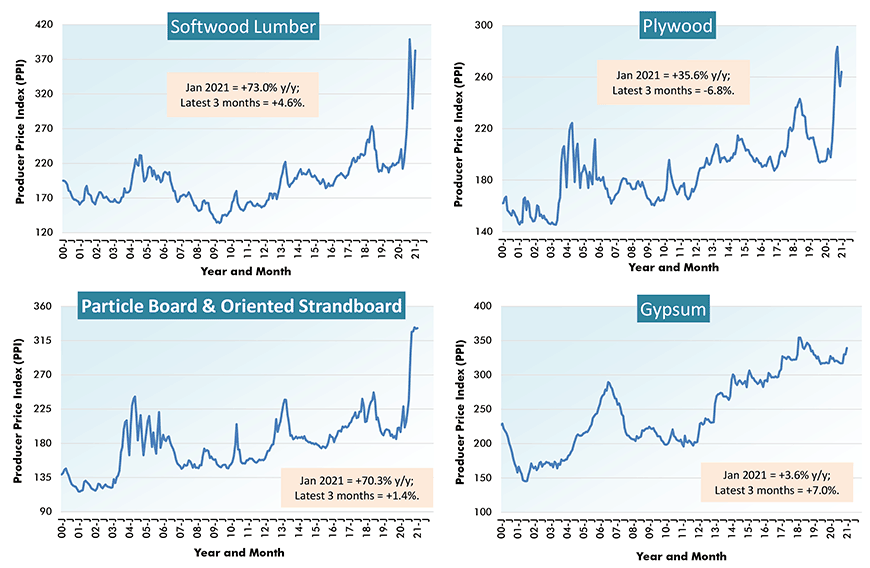
Demand (with accompanying cost increases) for materials derived from the forestry sector are being driven by an upsurge in single-family home building and a heightened enthusiasm for renovation projects on the part of stay-at-home workers. The three lumber-related curves in Graph 2 have broken above previous peaks recorded over the last 20 years.
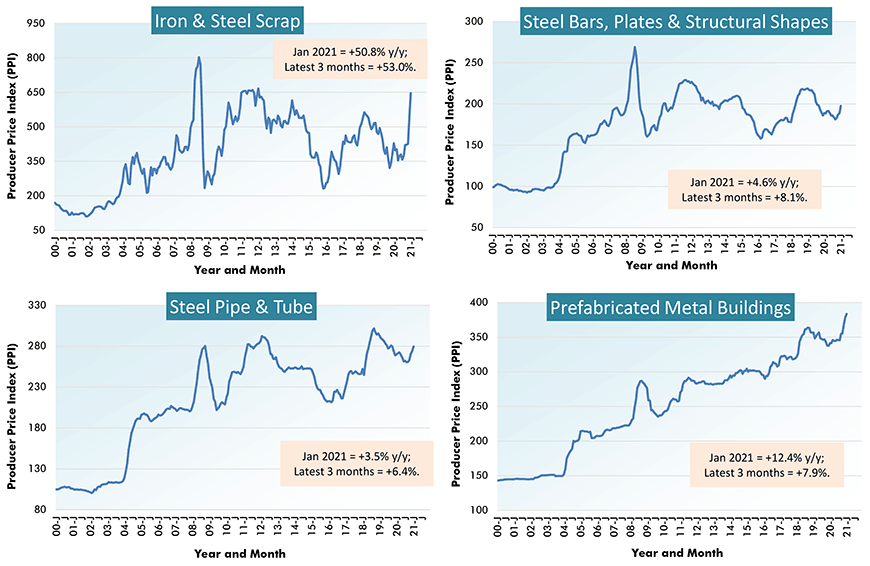
Steel prices have been more elevated in the U.S. than elsewhere around the world. With people less willing to take public transit during the pandemic, the popularity of used cars and trucks (not to mention bicycles) has spiked, diminishing the availability of the steel scrap that goes into electric-arc furnaces (see iron and steel scrap in Graph 3).
China was struggling with extreme excess capacity in steelmaking, but that’s likely to become less of a problem as Beijing embarks on a new round of massive infrastructure spending.
U.S. steel prices are generally expected to soften as 2021 unfolds, with lines being re-opened and additional production from new mills in Kentucky and Texas coming onstream.
From Producer Price Index (PPI) Series – January 2021
Charts: ConstructConnect.
Charts: ConstructConnect.
Charts: ConstructConnect.
Charts: ConstructConnect.
Charts: ConstructConnect.
Charts: ConstructConnect.
Table 1 sets out the PPI results for a broad spectrum of construction materials and type-of-structure categories.
In the ochre-shaded section at the bottom of the table, the cost increase of material inputs for ‘new construction’ is said to be +6.9% year over year. The materials component cost of residential work is moving higher faster than for nonresidential work, +7.6% y/y to +5.9% y/y.
Delving deeper into types-of-structure, the cost of materials going into educational projects is particularly ‘on the boil’, +7.3% y/y. By comparison, the ‘highways and streets’ category is restrained, +3.5% y/y.
In the blue-shaded section at the top of Table 1, the PPI index changes are all much quieter. They are the price movements for ‘final demand construction’. They’re not just what contractors see with respect to material inputs. They’re what owners encounter when they put their projects out for bidding. They include labor, profit margins and various carrying (e.g., borrowing) and administrative costs.
The ‘final demand construction’ PPI index was only +0.8% y/y in January. Clearly contractors are ‘eating’ all manner of input cost hikes in their efforts to find work in a pandemic-reduced marketplace.
% Change in the January 2021 Index from:
| 3 Years | 1 Year | 6 months | 3 months | 1 month | |||||
| Ago | Ago | Ago | Ago | Ago | |||||
| Final Demand/Service/Commodity/Energy/Input: | |||||||||
| Final Demand Construction | 9.7% | 0.8% | -0.2% | 0.3% | 0.2% | ||||
| New warehouse building construction | 8.1% | -0.2% | 0.1% | 0.6% | 0.2% | ||||
| New school building construction | 10.7% | 0.6% | -0.5% | 0.2% | 0.0% | ||||
| New office building construction | 10.3% | 1.3% | 0.4% | 0.8% | 0.5% | ||||
| New industrial building construction | 12.0% | 1.7% | 0.0% | 0.3% | 0.1% | ||||
| New health care building construction | 8.5% | 0.3% | -1.3% | -0.4% | -0.4% | ||||
| Architectural & engineering services | 4.8% | 0.8% | 1.9% | 1.6% | 0.9% | ||||
| Construction machinery & equipment | 9.8% | 1.2% | 1.1% | 1.1% | 1.0% | ||||
| Asphalt | 1.6% | -15.6% | 3.4% | 15.4% | 10.1% | ||||
| Plastic construction products | 10.4% | 6.7% | 6.1% | 2.5% | 0.8% | ||||
| Softwood lumber | 64.1% | 73.0% | 41.2% | 4.6% | 14.0% | ||||
| Hardwood lumber | 2.7% | 14.5% | 14.1% | 10.6% | 3.2% | ||||
| Millwork | 16.3% | 10.9% | 8.5% | 3.2% | 3.2% | ||||
| Plywood | 20.2% | 35.6% | 15.5% | -6.8% | 4.4% | ||||
| Particle board & oriented strandboard (OSB) | 58.6% | 70.3% | 40.1% | 1.4% | 0.3% | ||||
| Gypsum | 3.0% | 3.6% | 6.4% | 7.0% | 2.8% | ||||
| Insulation materials | 5.3% | 4.0% | 3.6% | 3.8% | 2.1% | ||||
| Construction sand, gravel & crushed stone | 13.9% | 4.4% | 2.5% | 2.7% | 2.2% | ||||
| Cement | 5.6% | 2.6% | 0.4% | 0.4% | 0.3% | ||||
| Ready-mix concrete | 7.0% | 1.5% | -0.2% | 0.0% | 0.6% | ||||
| Precast concrete products | 13.1% | 3.0% | 2.7% | 1.1% | -0.6% | ||||
| Prestressed concrete products | 6.9% | -0.4% | -0.4% | 1.1% | 1.1% | ||||
| Brick (clay) | 6.3% | 3.3% | 1.3% | 0.4% | 0.4% | ||||
| Coal | -3.9% | -0.4% | 0.8% | -0.7% | 0.2% | ||||
| Iron ore | 26.7% | 5.7% | 3.6% | 2.8% | -1.3% | ||||
| Iron & steel scrap | 30.0% | 50.8% | 80.6% | 53.0% | 20.6% | ||||
| Steel bars, plates & structural shapes | 10.9% | 4.6% | 6.2% | 8.1% | 4.7% | ||||
| Steel pipe & tube | 10.9% | 3.5% | 6.7% | 6.4% | 2.1% | ||||
| Fabricated structural metal products | 9.9% | 3.2% | 3.1% | 2.6% | 0.7% | ||||
| Prefabricated Metal Buildings | 19.2% | 12.4% | 10.9% | 7.9% | 1.3% | ||||
| Aluminum mill shapes | 3.2% | 1.5% | 13.4% | 7.7% | 3.8% | ||||
| Flat glass | 5.0% | 2.9% | 2.1% | 2.1% | -0.6% | ||||
| Paints, architectural coatings | 13.9% | 2.6% | 0.1% | 0.1% | -0.1% | ||||
| Lighting fixtures | 9.4% | 1.2% | 0.9% | -0.5% | 0.1% | ||||
| Plumbing fixtures & fittings | 8.8% | 1.8% | 1.1% | -0.1% | 0.0% | ||||
| Elevators & escalators | 6.9% | 0.6% | 0.1% | -0.1% | 0.0% | ||||
| Heating equipment | 9.5% | 0.4% | 0.4% | 0.2% | -0.2% | ||||
| Air conditioning equipment | 10.6% | 3.7% | 2.4% | 1.8% | 1.1% | ||||
| Copper wire & cable | 15.1% | 12.5% | 14.5% | 9.2% | 3.2% | ||||
| Regular gasoline unleaded | -14.2% | -11.1% | 18.4% | 20.9% | 15.2% | ||||
| Diesel Fuel | 2.1% | 9.2% | 30.7% | 24.6% | 4.2% | ||||
| Inputs to new construction | 12.2% | 6.9% | 7.1% | 2.0% | 2.2% | ||||
| Inputs to new residential construction | 12.6% | 7.6% | 7.1% | 0.2% | 2.0% | ||||
| Inputs to new non-res construction | 11.7% | 5.9% | 7.0% | 4.2% | 2.5% | ||||
| Inputs to commercial construction | 11.6% | 5.7% | 6.6% | 4.4% | 2.2% | ||||
| Inputs to healthcare structures | 12.3% | 6.5% | 6.9% | 3.8% | 2.3% | ||||
| Inputs to industrial structures | 12.2% | 5.0% | 6.5% | 4.9% | 2.4% | ||||
| Inputs to highways & streets | 9.2% | 3.5% | 5.9% | 4.5% | 2.4% | ||||
| Inputs to power & communication structures | 10.0% | 5.1% | 6.7% | 4.3% | 2.4% | ||||
| Inputs to educational & vocational structures | 13.3% | 7.3% | 7.3% | 3.6% | 2.3% | ||||
| Construction materials (PPI ‘Special Index’) | 12.8% | 9.2% | 7.5% | 3.4% | 2.7% |
The ‘service’, ‘commodity’ and ‘energy’ indices (in the middle section of the table) are based on ‘factory-gate’ sales prices.
The ‘input’ indices (at bottom) reflect costs faced by contractors. They exclude capital investment (i.e., machinery & equipment), labor & imports.
The ‘input’ indices are built up from the ‘service’ (design, legal, transport & warehousing, etc.) ‘commodity’ and ‘energy’ indices.
Table: ConstructConnect.
Please click on the following link to download the PDF version of this article:
Economy at a Glance Vol. 17, Issue 32 and 33 – Soaring Lumber & Steel Prices Confirmed by Latest PPI Results – PDF
Alex Carrick is Chief Economist for ConstructConnect. He has delivered presentations throughout North America on the U.S., Canadian and world construction outlooks. Mr. Carrick has been with the company since 1985. Links to his numerous articles are featured on Twitter @ConstructConnx, which has 50,000 followers.


Recent Comments