
In this, the latest mid-month Nuggets report, I’ll focus on three major and interlocking (or interdependent) economic indicators: retail sales, inflation and housing starts.

Retail Sales
My world of economic analysis is being rocked in unprecedented fashion. Maybe ‘shattered’ is the better word.
For example, I’m used to studying year-over-year percentage changes to gain an understanding of what is going on in certain segments of the economy. Retail sales is a perfect example. In current dollar terms (i.e., not adjusted for inflation), they used to range from flat as a lower boundary to maybe +7% y/y as an upper limit.
When the coronavirus first struck in the Spring of last year, retail sales plummeted, yielding double-digit percentage-change drops for ‘total’ and many shopkeeper sub-categories. Now, a year later, the rebound that’s underway is being vastly exaggerated by the comparison with 2020’s deeply distressed results. Looking at April 2021/April 2020, we’re dealing with ‘funhouse’ numbers on the upside.
Total retail sales in the latest reporting month (April 2021) were +46.1% year over year. Motor vehicle and parts dealer sales were +111.6% y/y; furniture and home furnishing store sales, +196.4% y/y; and how about this for a pick-up, clothing and clothing accessory store sales, +726.8% y/y. Building material and garden equipment store sales were +33.8% y/y and non-store (i.e., Internet platform) retail sales, which have maintained upward momentum throughout the past otherwise difficult year, +14.5% y/y.
Clearly, one needs to switch vantage points. A good approach is to shorten the timeline. Total retail sales month to month in April 2021 were -0.3%; furniture and home furnishing stores, -0.7%; building material and garden equipment suppliers, -0.4%; and non-store retailers, -0.6%. Motor vehicle and parts dealers managed +2.9% m/m.
The bottom line is that April 2021 was not a particularly good month for U.S. retail sales. There is, however, a warming ray of light coming from ‘food services and drinking place’ sales. These are not part of retail sales, but they are a key component of consumer spending, on the ‘services’ rather than ‘goods’ side. They were down for the count during much of the past 12 months. In April 2021, however, they rose from the mat to be +116.8% y/y and +3.0% m/m.
Inflation
Until April 2021, the all-items Consumer Price Index (CPI) inflation rate in the U.S. had not been above +3.0% y/y since November 2011. Mainly, during the latest decade, it has been below +2.0% y/y. In April of this year, the CPI shot up to +4.2% y/y. Two of the biggest movers were gasoline, +49.6% y/y, and ‘used cars and trucks’, +21.0% y/y.
There have been bargain prices during the pandemic for such items as clothing and hotel/motel stays (e.g., items for which the need and the demand dried up precipitously), but those days are coming to an end. Even the Federal Reserve has warned that inflation will be heating up. But the Fed contends the spike in the general price level will be short-lived.
The problem with inflation is that it can quickly become ingrained. Furthermore, there are currently forces at work that almost guarantee it will be a lingering issue. ‘Real’ (i.e., after inflation) gross domestic product (GDP) growth projections for 2021 over 2020 are in the range of +6.0% to +8.0%, whereas the annual average from 2000 to 2019 was only a little over +2.0%.
The surge in demand will put a strain on supply chains, especially with deglobalization holding sway as a theme in the background. On the wages side, there may still be a significant number of individuals who are unemployment, but talk of labor shortages is widespread, nonetheless. Due to the accelerated societal changes that have occurred during the pandemic, the mismatch between skill sets and the jobs that are available has become more exaggerated.
Housing Starts
U.S. housing starts during the first two decades of this century averaged 1.25 million units annually. In the current year, their monthly levels in millions of units, seasonally adjusted and annualized (SAAR), have been 1.6 in January; 1.4 in February; 1.7 in March; and 1.6 in April. The average of the four months is 1.6 million units. So yes, there is a ‘mini’ U.S. housing construction boom underway.
In Canada, housing starts since 2000 have been remarkably consistent at close to 200,000 units each year. The monthly performances in 2021, however, have been 308,000 in January; 272,000 in February; 335,000 in March; and 269,000 in April. This year’s monthly average has been 296,000 units, or half again higher than normal. So yes, emphatically, there is a maxi housing construction boom underway north of the border.
The strong home building results in both the U.S. and Canada are being achieved at a time when population growth has slowed to a crawl. Concerning the ‘natural increase’ in population, deaths have been much higher than usual in the last 14 months and births have been down. And, with borders closed, immigration has been suppressed.
As some of the negative influences on population growth reverse in the year ahead, how much greater will be the pressure to proceed with new housing construction? Of course, there’s the possibility that sometime in 2022, higher interest rates, especially if rapid inflation continues to be a bugbear, will act as a brake on new housing demand.
One of the most apparent consequences of the boost in housing starts has been the take-off in softwood lumber and particle board prices, both more than doubling on a year-over-year basis. For contractors, though, the rapid escalation in material input prices extends far beyond forestry products. For much more on this subject, go to the article titled, Shockingly High Material Cost Hikes Set Out in 2 Tables and 24 Graphs.
Table 1: U.S. and Canadian Jobs Markets – April 2021
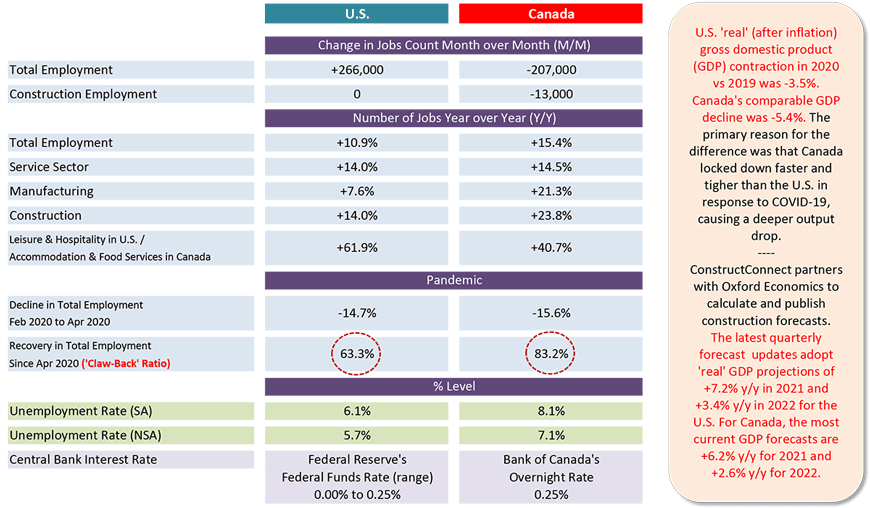
U.S. labor data is from a ‘payroll survey’ / Canadian labour data is from a ‘household survey’.
Canadian NSA unemployment rate ‘R3’ is adjusted to U.S. concepts (i.e., it adopts U.S. equivalent methodology).
Table: ConstructConnect.
Please click on the following link to download the PDF version of this article:
Economy at a Glance Vol. 17, Issue 75 – Mid-May Economic Nuggets Report with Focus on Retail Sales, Inflation and Housing Starts – PDF
Alex Carrick is Chief Economist for ConstructConnect. He has delivered presentations throughout North America on the U.S., Canadian and world construction outlooks. Mr. Carrick has been with the company since 1985. Links to his numerous articles are featured on Twitter @ConstructConnx, which has 50,000 followers.


Recent Comments