
Due to its complexity, much of the subject matter concerning the economy requires detailed editorial commentary, often supported by relevant tables and graphs.
At the same time, though, there are many topics (e.g., relating to demographics, housing starts, etc.) that cry out for compelling ‘shorthand’ visualizations.
Whichever path is followed, the point of the journey, almost always, is to reach a bottom line or two.
To provide additional value, ConstructConnect is now pleased to offer an ongoing series of 1,000-word charts.
These will help readers sort out the ‘big picture’ more clearly.
These 1,000-word charts look at the U.S. and Canada’s foreign trade, as of May 2021.
Graph 1: United States’ Foreign Trade: Goods and Services Balance − May 2021
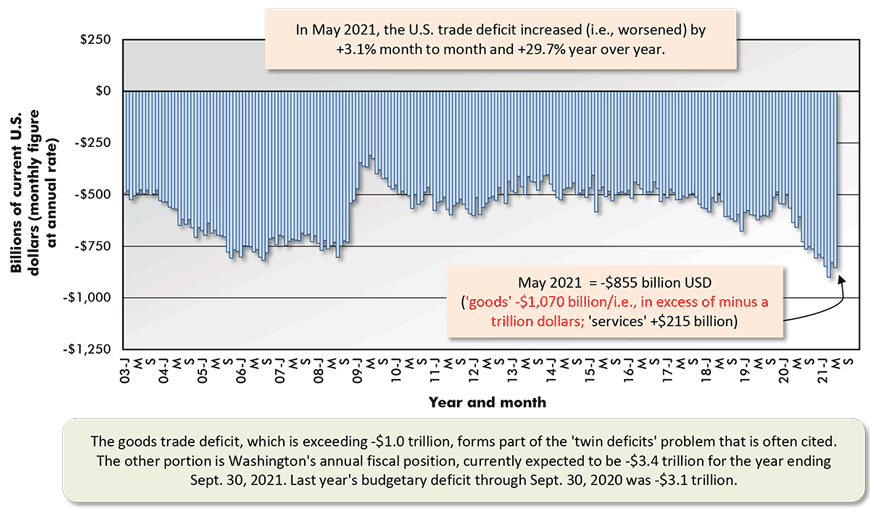
The last data point is for May 2021.
Based on seasonally adjusted monthly figures, projected at an annual rate.
Data source: Bureau of Economic Analysis (BEA).
Chart: ConstructConnect.
Graph 2: Geographic Sources of U.S. Total Foreign Trade Deficit in Goods – May 2021
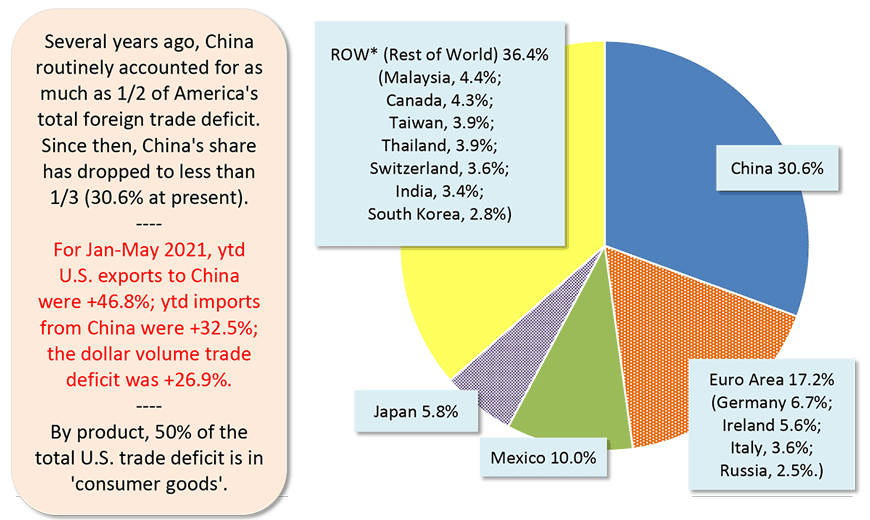
Data source: U.S. Census Bureau and Bureau of Economic Analysis (BEA).
Chart: ConstructConnect.
Graph 3: 12 of the Top Suppliers of U.S. Oil Imports
Year to Date (YTD) May, 2021
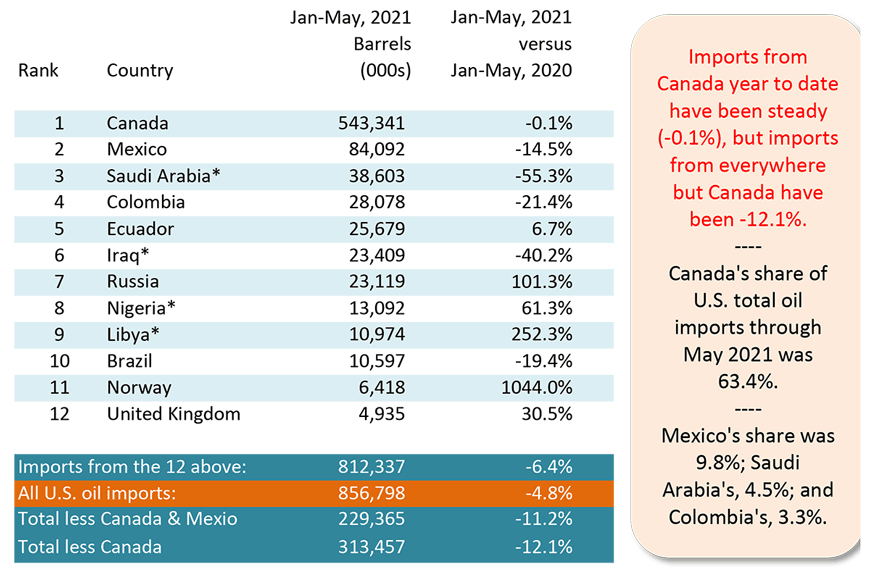
* OPEC nations.
Data source: Bureau of Economic Analysis (BEA).
Chart: ConstructConnect.
Graph 4: Foreign Sources of U.S. Imported Oil
% of Total Barrels – Jan-May 2021
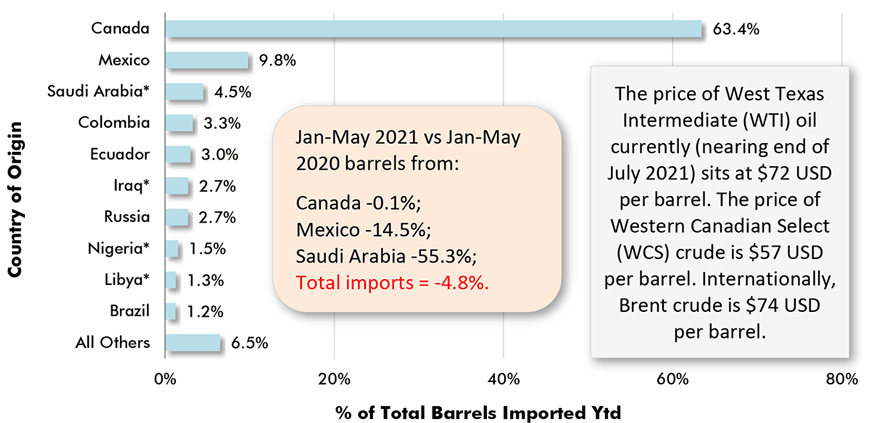
* Asterisk indicates country among OPEC members. Ecuador left OPEC in January 2020.
Data source: Census Bureau & Bureau of Economic Analysis (BEA).
Chart: ConstructConnect.
Graph 5: Canada’s Foreign Trade: The Merchandise Trade Balance − May 2021
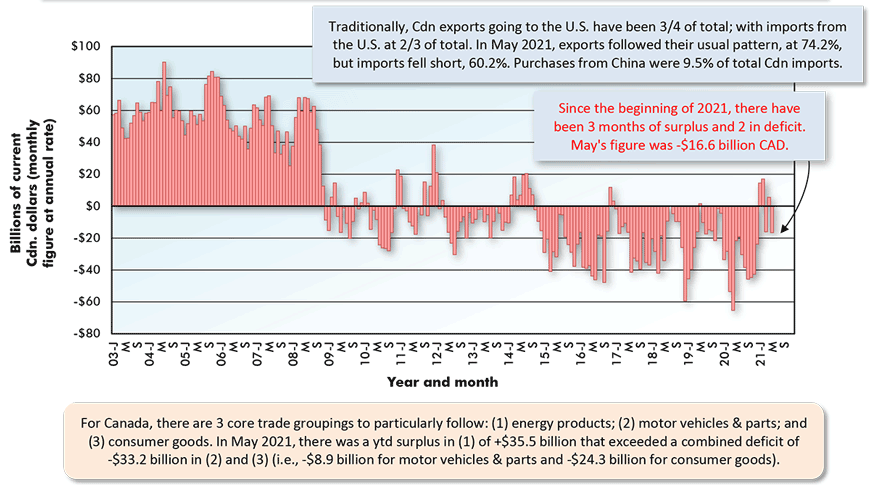
The last data point is for May 2021.
Based on seasonally adjusted monthly figures, projected at an annual rate.
Data source: Statistics Canada.
Chart: ConstructConnect.
Graph 6: Provincial Export Sales, Jan-May 2021
Ranked by $ Volume (also showing YTD % changes – i.e., vs Jan-May 2020)
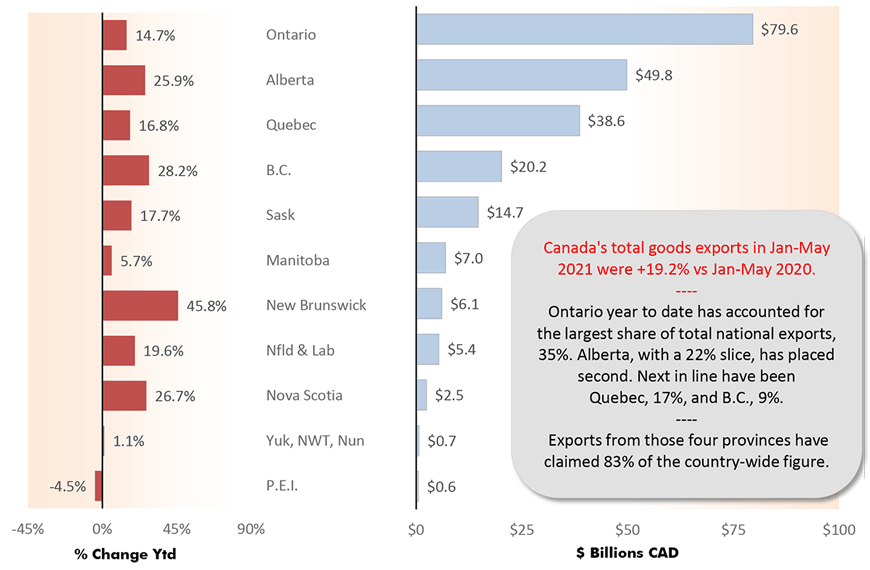
Data source: Statistics Canada.
Chart: ConstructConnect.
Graph 7: Canada’s Key Export Product Sales by Province
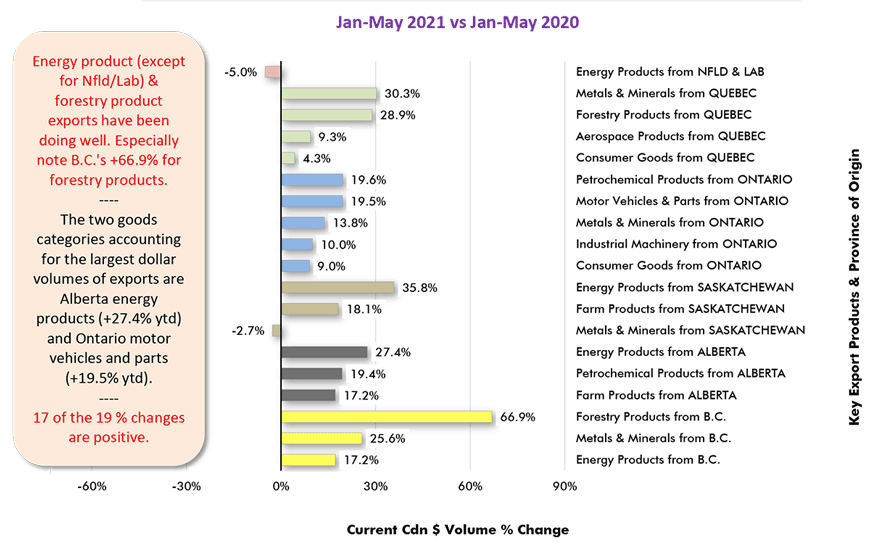
Data source: Statistics Canada Table 12-10-0119-01.
Chart: ConstructConnect.
Please click on the following link to view the latest Foreign Trade charts and tables: CanaData Forecaster Charts & Tables – Foreign Trade
Alex Carrick is Chief Economist for ConstructConnect. He has delivered presentations throughout North America on the U.S., Canadian and world construction outlooks. Mr. Carrick has been with the company since 1985. Links to his numerous articles are featured on Twitter @ConstructConnx, which has 50,000 followers.


Recent Comments