Currently, there’s no letup in the rising tide of construction material costs.
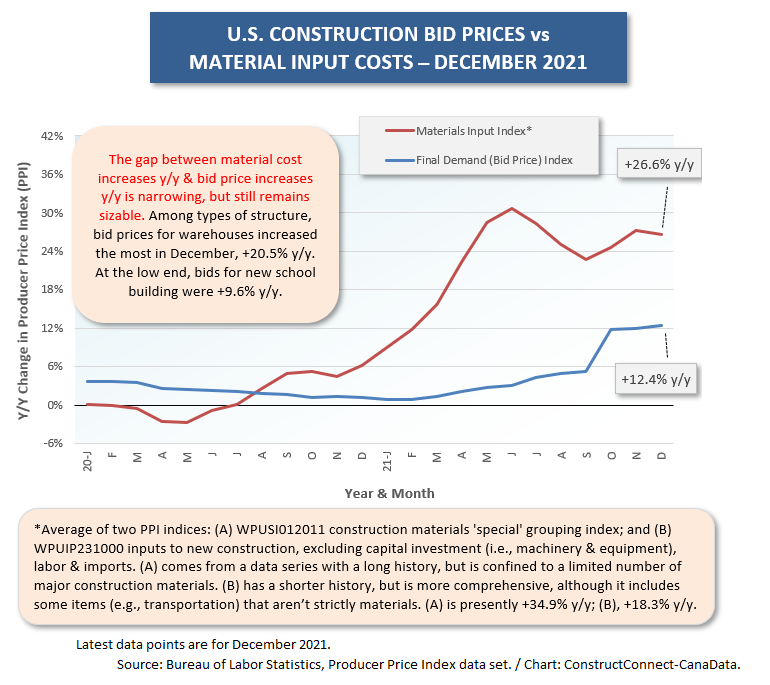
Graph 1 shows that the average year-over-year increase for two material cost indices published along with Producer Price Index (PPI) results by the Bureau of Labor Statistics (BLS) is forging ahead more than twice as speedily as bid prices (i.e., +26.6% y/y vs +12.4%).
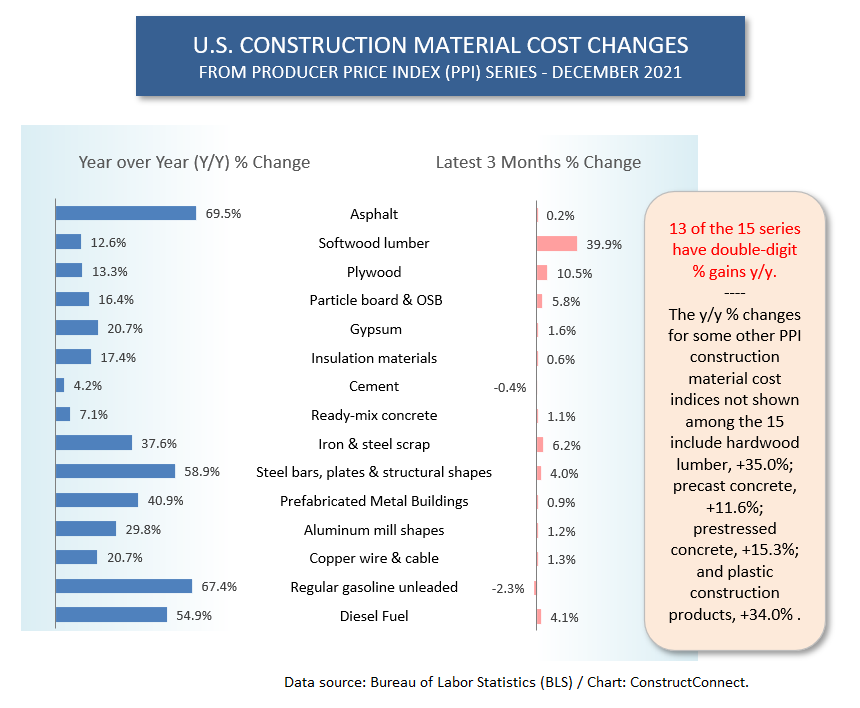
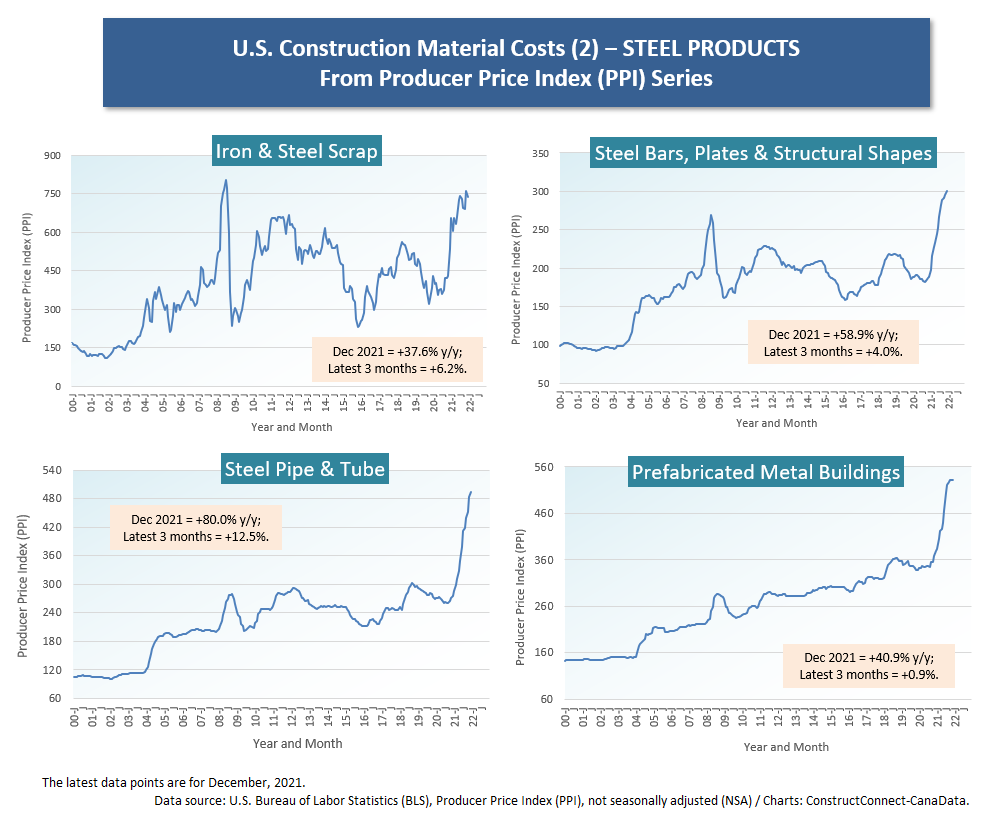
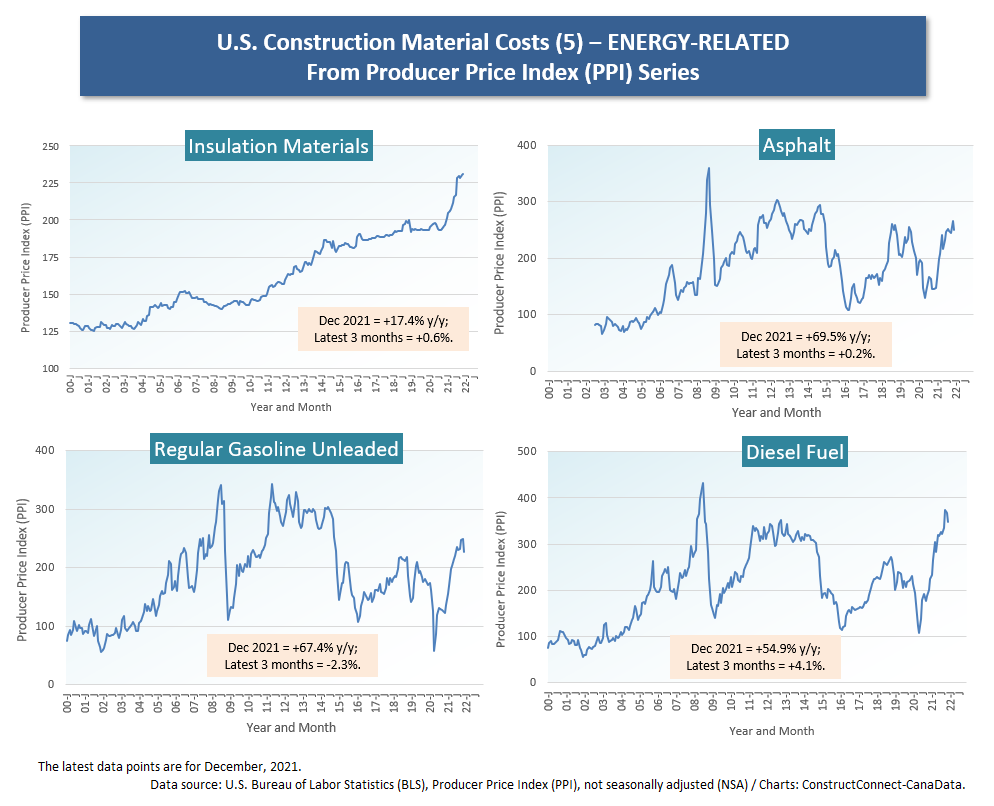
 Graph 2 showcases that 13 of 15 major construction input indices published by the BLS registered double-digit year-over-year percentage increases in December 2021. After energy-related prices (i.e., +69.5% for asphalt; +67.4% for regular unleaded gasoline; and +54.9% for diesel fuel), the largest gain was +58.9% for steel bars, plates, and structural shapes.
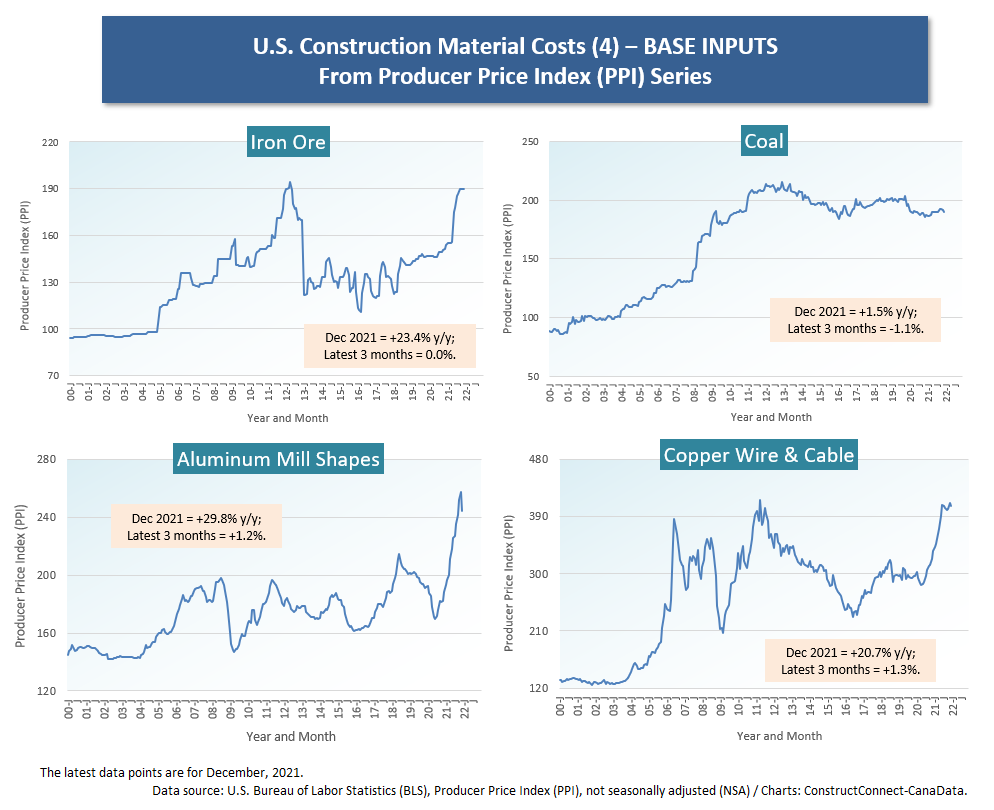
Aluminum mill shapes and copper wire and cable weren’t up to quite the same degree, but +29.8% y/y and +20.7% y/y are nothing to scoff at nonetheless,
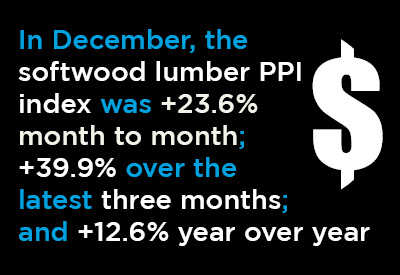
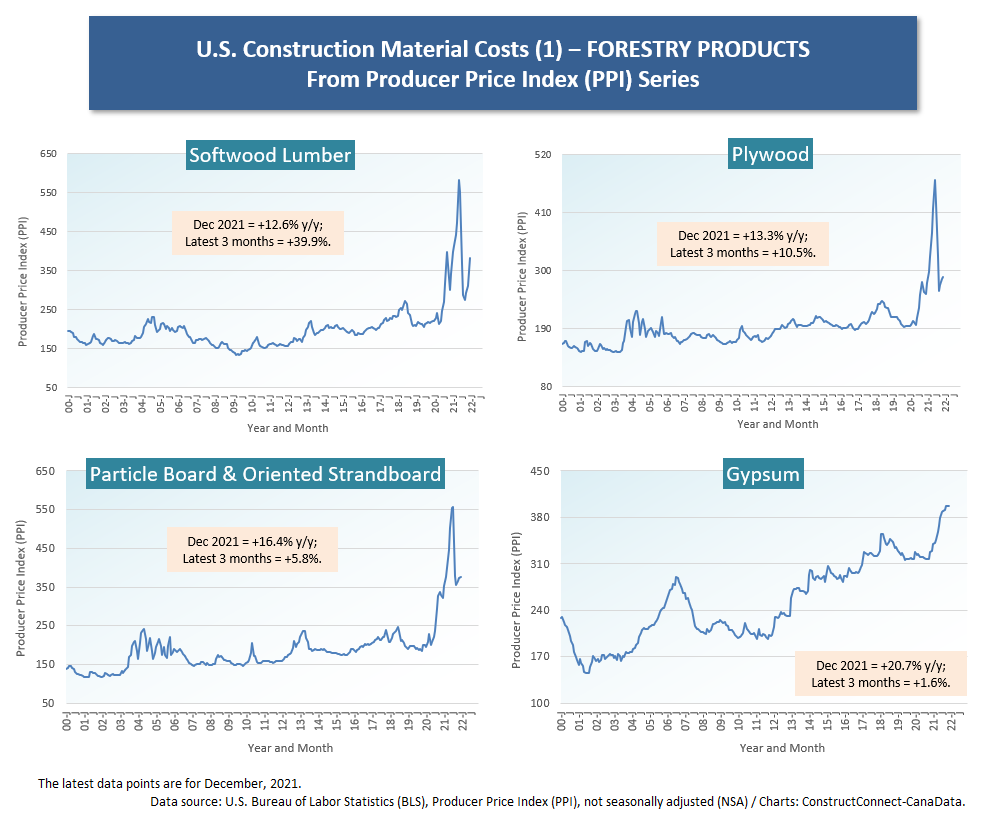
The softwood lumber cost index achieved an enormous peak in June of last year, but then it plummeted by about half. That respite, however, appears to be over. In December, the softwood lumber PPI index was +23.6% month to month; +39.9% over the latest three months; and +12.6% year over year.
Compared with three years ago, the softwood lumber price index is +82.4%. Nor is softwood lumber the only forestry product with an outsized price gain over the past three years. The ‘particle board and oriented strand board (OSB)’ index has nearly doubled, +95.2%.
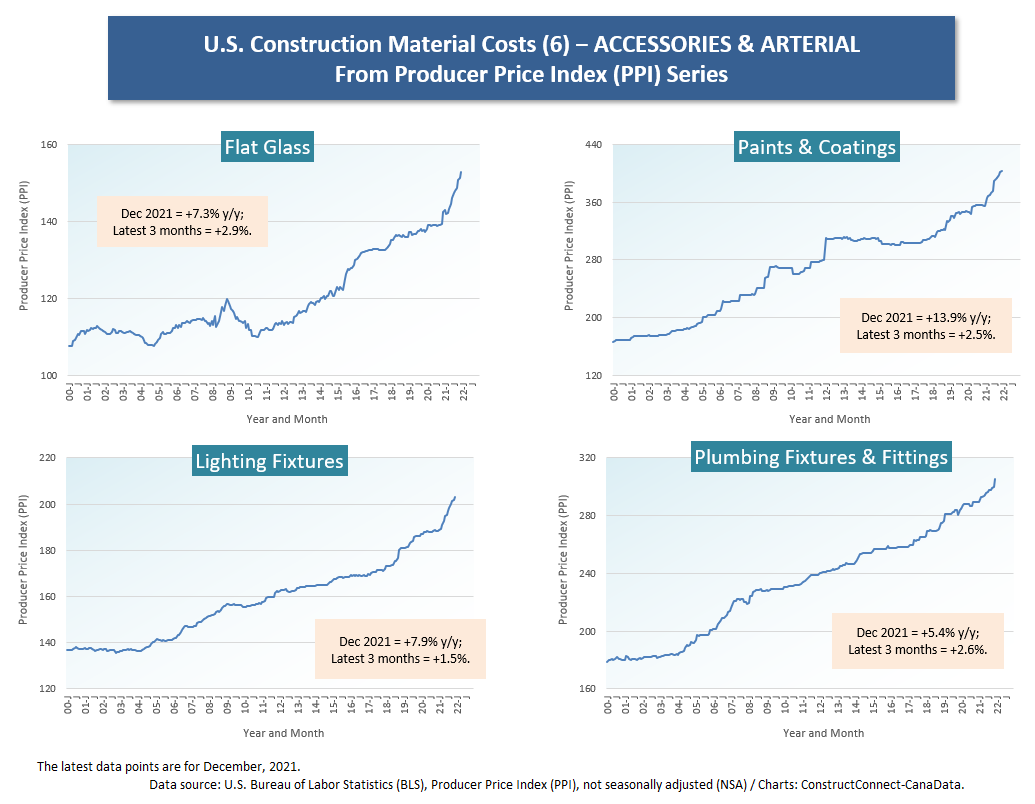
Cluster charts 1 through 7 show the monthly histories of the price indices for construction inputs, January 2000 to the present. Each of the seven cluster charts focuses on a product category – e.g., forestry products; cement and related products; base metal products; energy-related products; etc.
The theoretical grounding of PPI indices is that they monitor product prices at the moment they exit through factory or other production site gates.
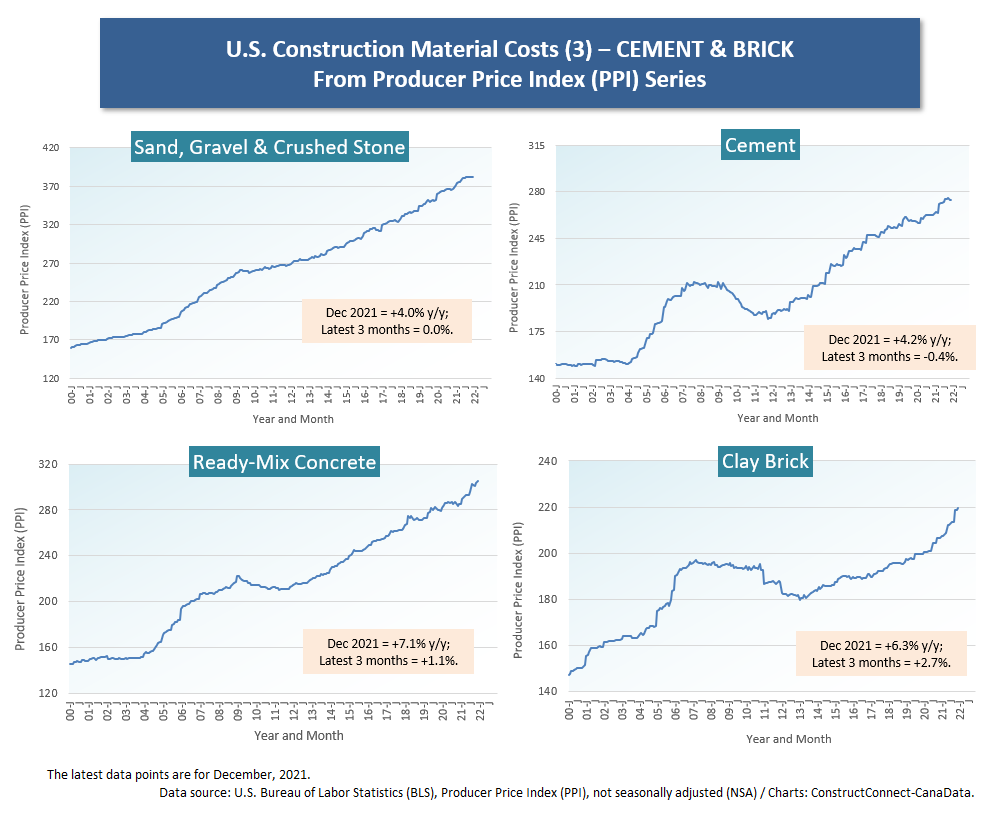
Sharp climbs in the curves over the last year or so are evident in all the cluster charts. (The cement and brick cluster chart may be most muted, but even there, clay brick has recently been bending upwards more emphatically.)
Cluster Chart 2 for steel products shows some truly stunning increases among its four sub- graphics, especially for ‘steel pipe and tube’.
Cluster Charts 6 and 7 feature surprising price take-offs for inputs that usually move upwards sedately, including ‘flat glass’, ‘lighting fixtures’, ‘elevators and escalators’, ‘heating equipment’ and ‘air conditioning equipment.’
Table 1 sets out more extensive results for a multitude of construction inputs, plus some ‘type of structure’ groupings. On that score, the blue-shaded and ochre-shaded sections of Table 1 are most interesting. In the blue section, bid prices for warehouse buildings are up the most year over year, +20.5%. In the blue section, the input increases for all the structure types laid out range from +15% to +20% year over year.
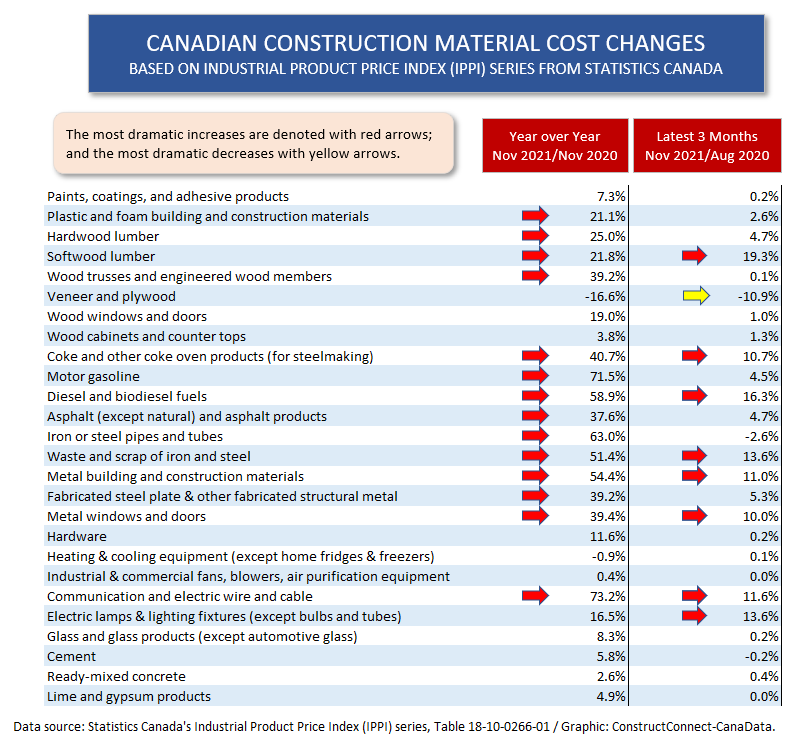
Table 2 shows that prices for Canadian material and other construction inputs are increasing in just as dramatic fashion as most of their counterparts in the U.S. Statistics Canada’s Industrial Product Price Index (IPPI) series is the ideological equivalent of the U.S. PPI series.
Graph 1
Graph 2
Cluster Chart 1
Cluster Chart 2
Cluster Chart 3
Cluster Chart 4
Cluster Chart 5
Cluster Chart 6
Cluster Chart 7
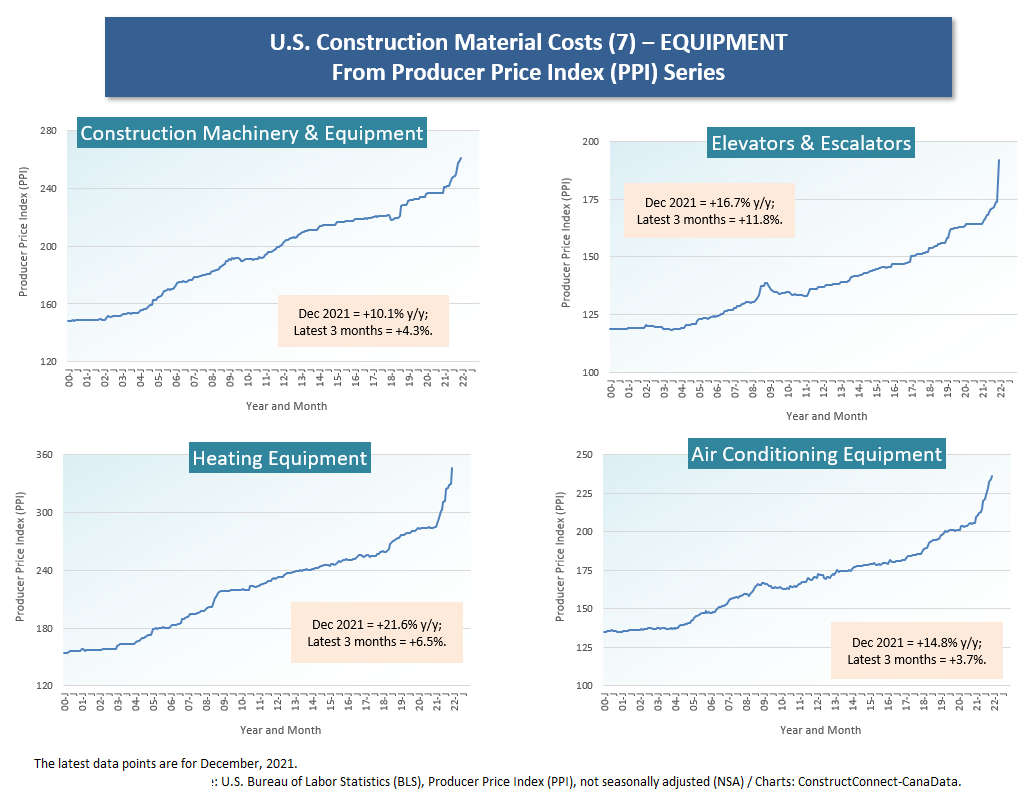
Table 1
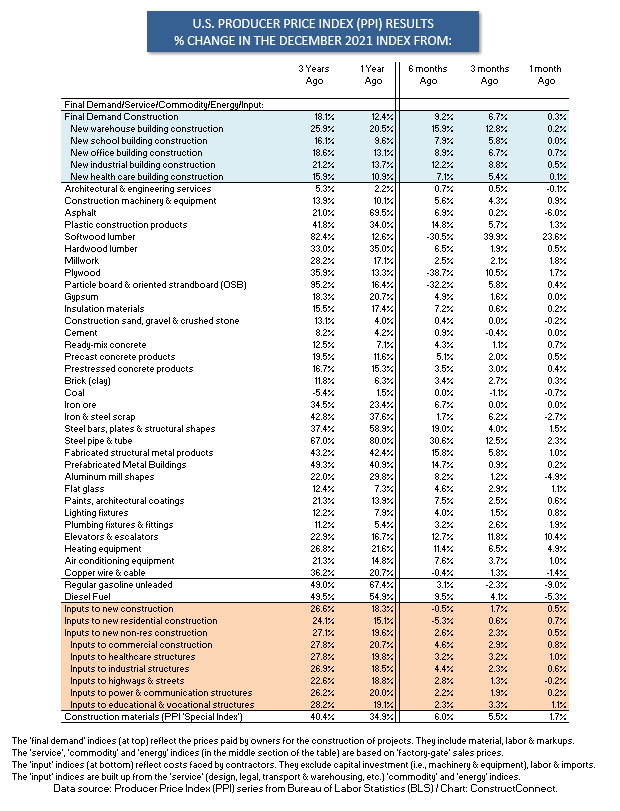
Table 2
Alex Carrick is Chief Economist for ConstructConnect. He has delivered presentations throughout North America on the U.S., Canadian and world construction outlooks. Mr. Carrick has been with the company since 1985. Links to his numerous articles are featured on Twitter @ConstructConnx, which has 50,000 followers.


Recent Comments