
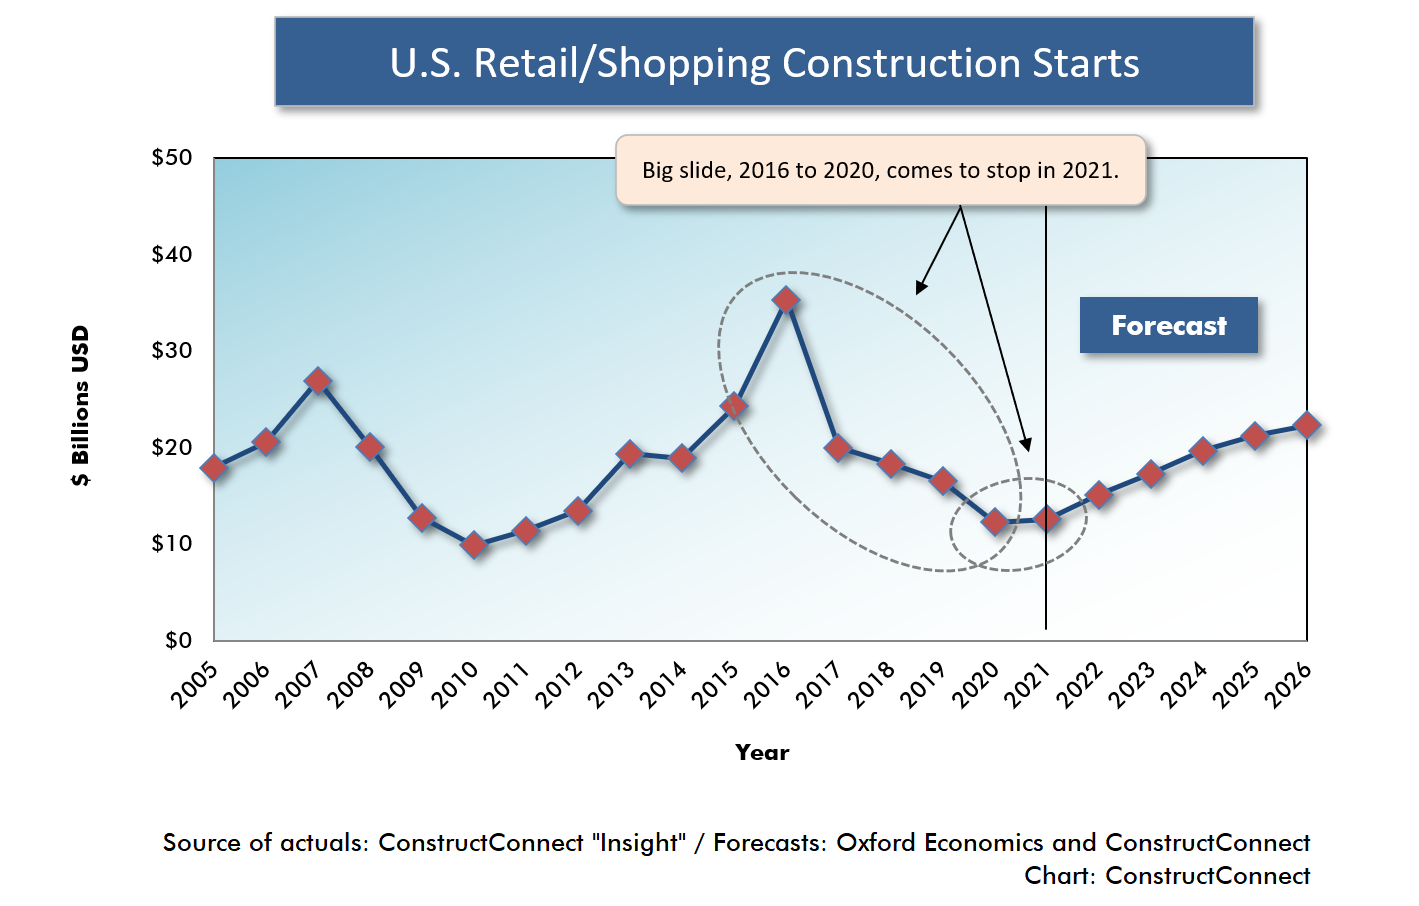
In 2017, several years before the coronavirus health crisis, ‘bricks and mortar’ retail construction starts began a steep slide that lasted through the following four years.
An interesting thing happened in 2021, however. The free-fall in physical retail/shopping starts came to a stop and a slight uptick was registered.
 The dollar volume of shopping/retail starts was quite low last year, $12.6 billion, but it was ahead by a small amount compared with 2020’s $12.3 billion.
Graph 1 shows the history of the ‘starts’ numbers. ConstructConnect is expecting this category of construction will be on a mild recovery path going forward.
With the huge burst in buying that has taken place over the Internet and by way of e-auction houses, it’s easy to forget that for many families, shopping in malls used to be an integral part of their entertainment on weekday evenings and/or on the weekend.
The endemic version of the COVID threat that is emerging will soon permit a closer return to pre-pandemic behavior patterns.
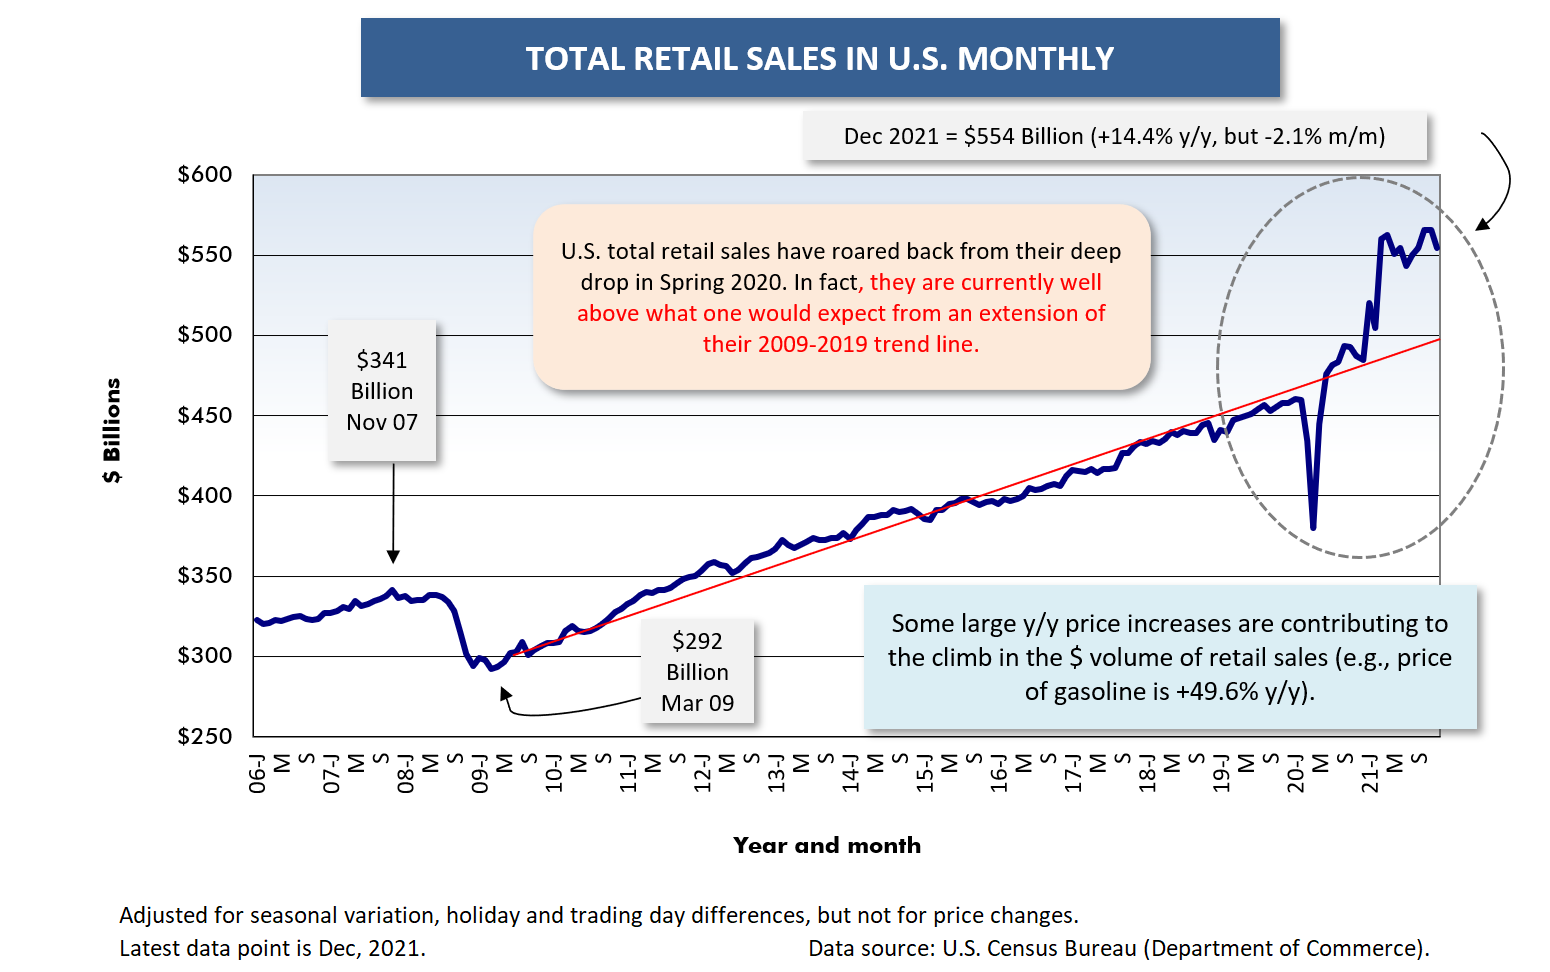
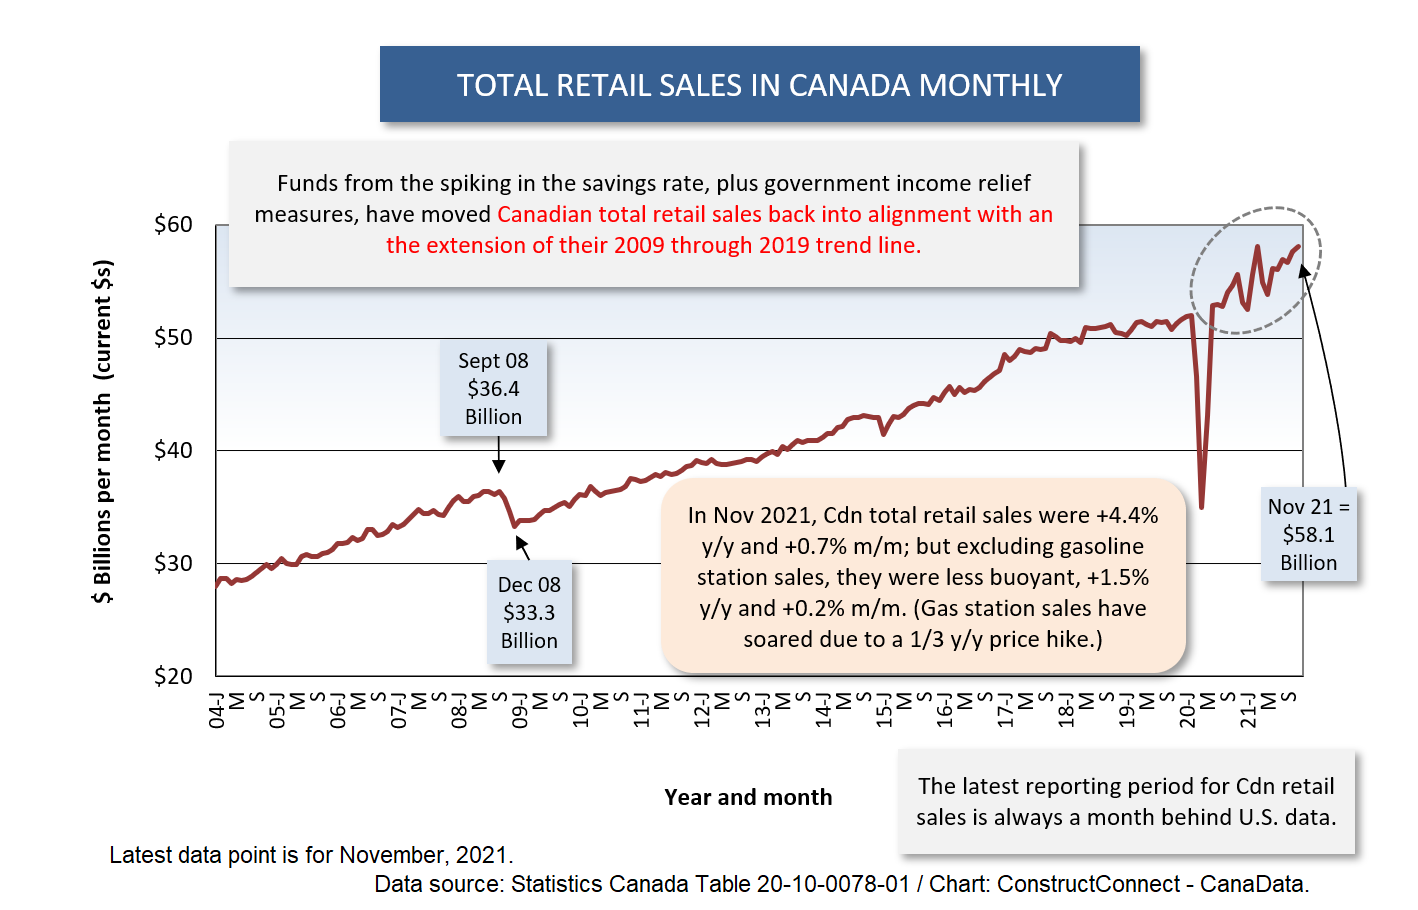
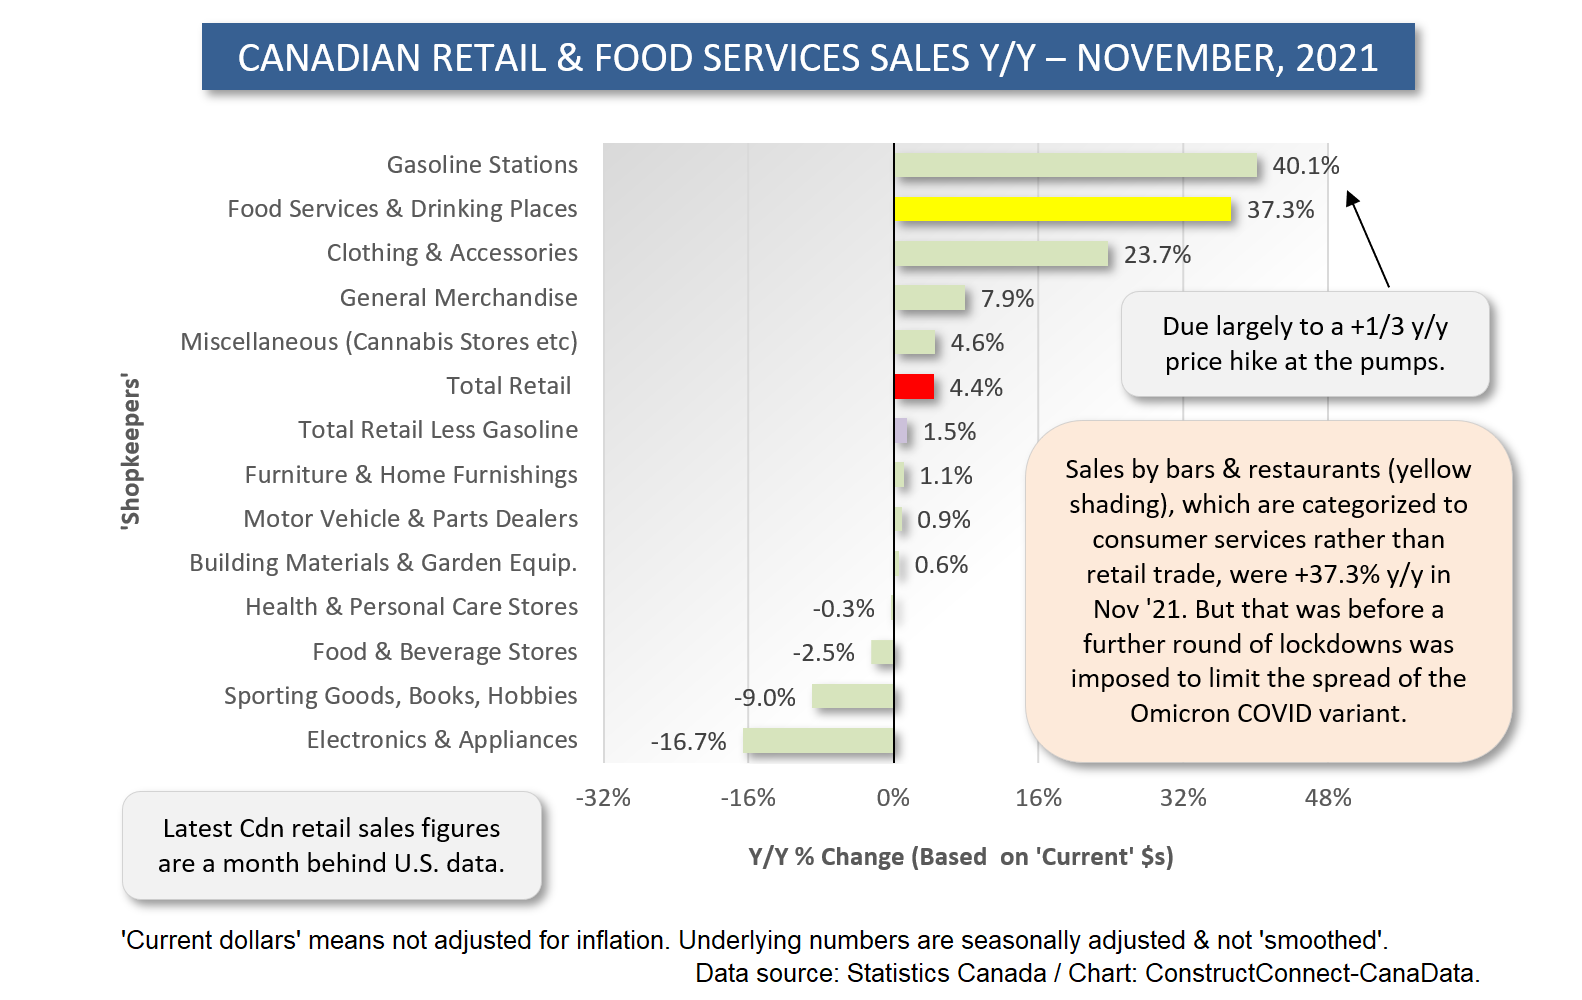
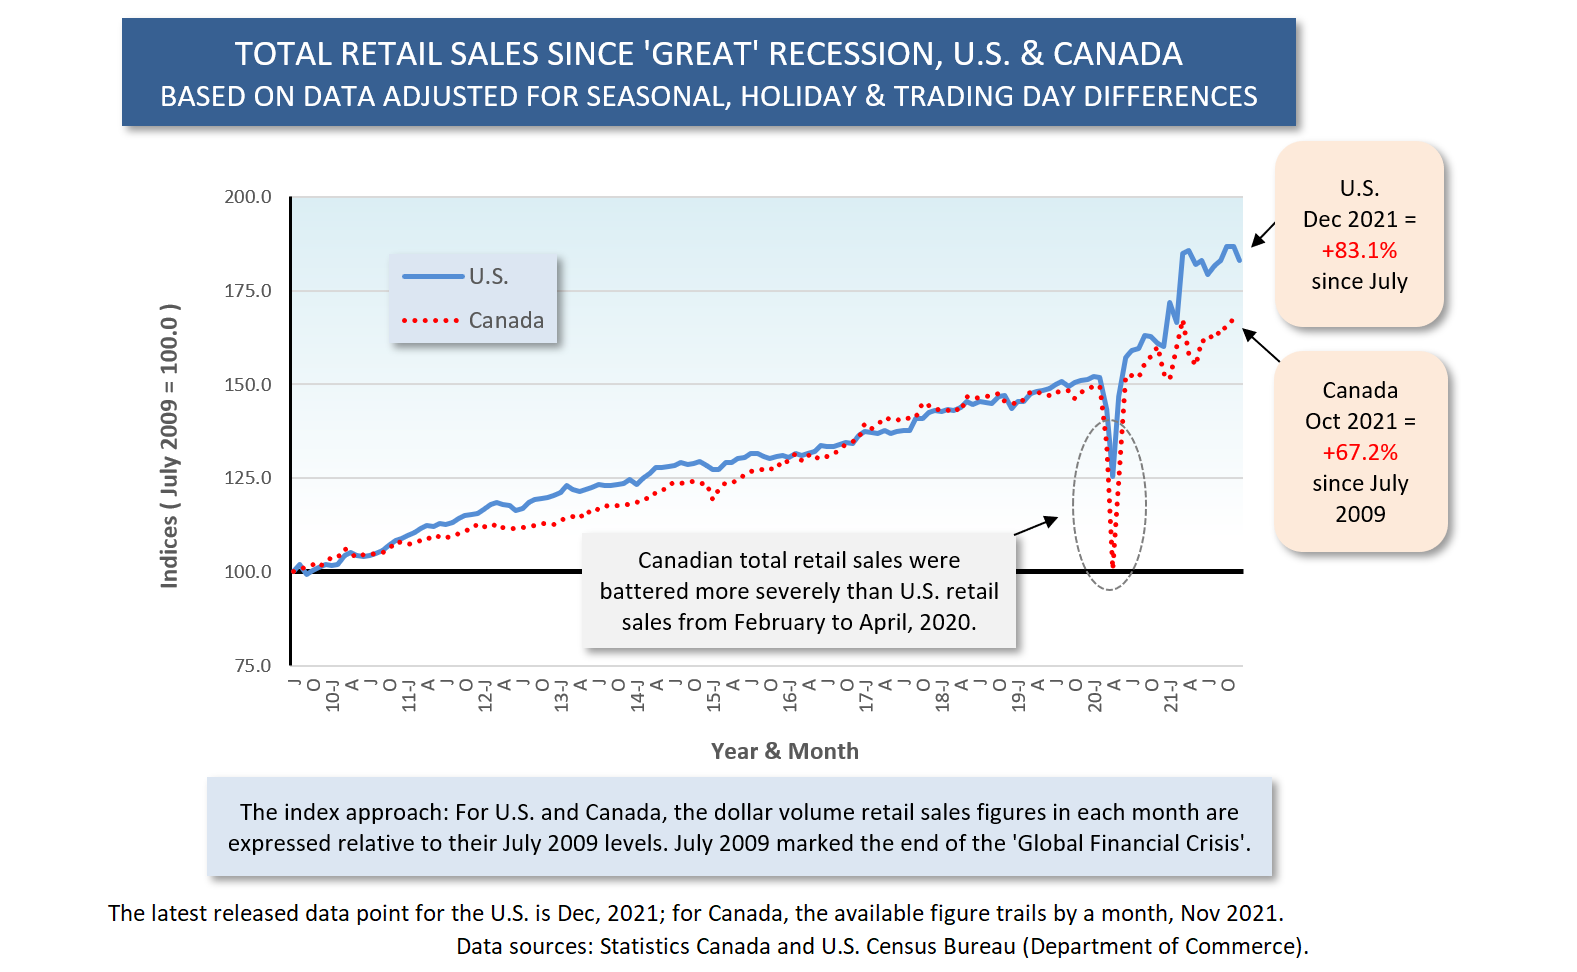
U.S. total retail sales in the keeping-our-fingers-crossed waning days of the pandemic are setting a torrid pace, +14.4% year over year. In Canada, total retail is much less ebullient, at +4.4% y/y.
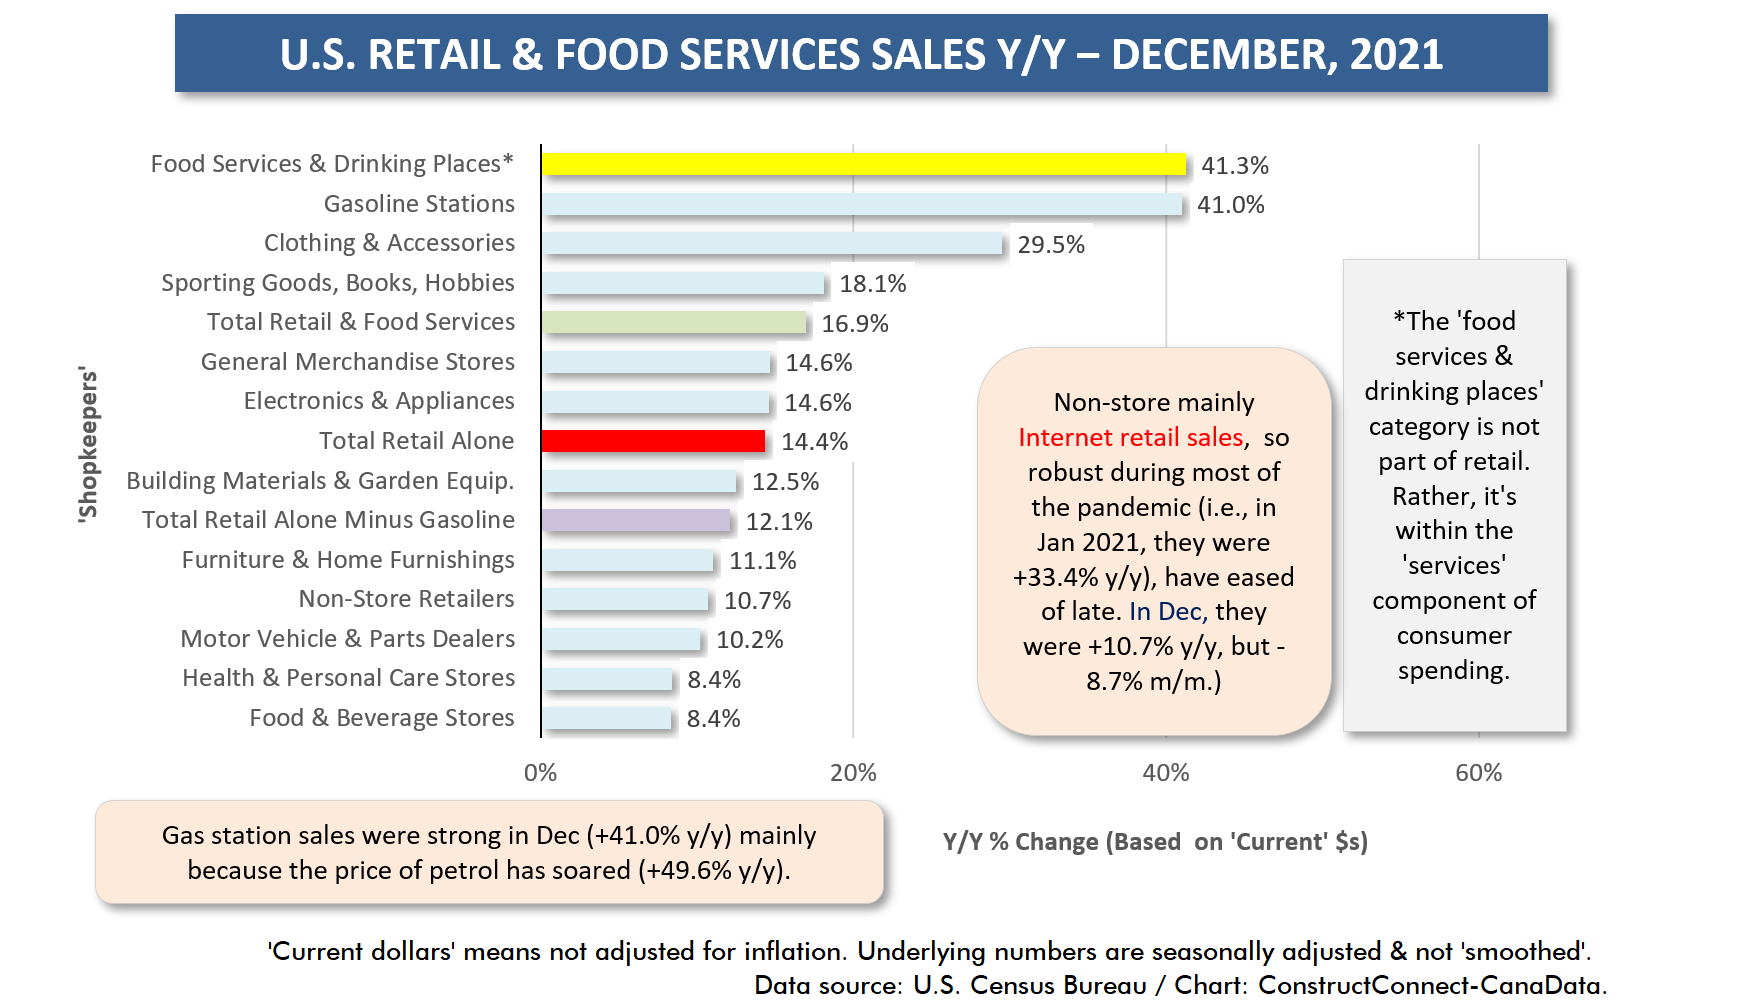
The non-store (i.e., Internet) component of U.S. total retail receipts is relatively more modest at +10.7% y/y.
A Flip Side to Inflation for Construction
There’s no doubt that high savings (accumulated during lockdowns), pent-up demand and more recently, strong wage gains, are fueling the burst in U.S. retail sales. But another significant contributing factor is inflation.
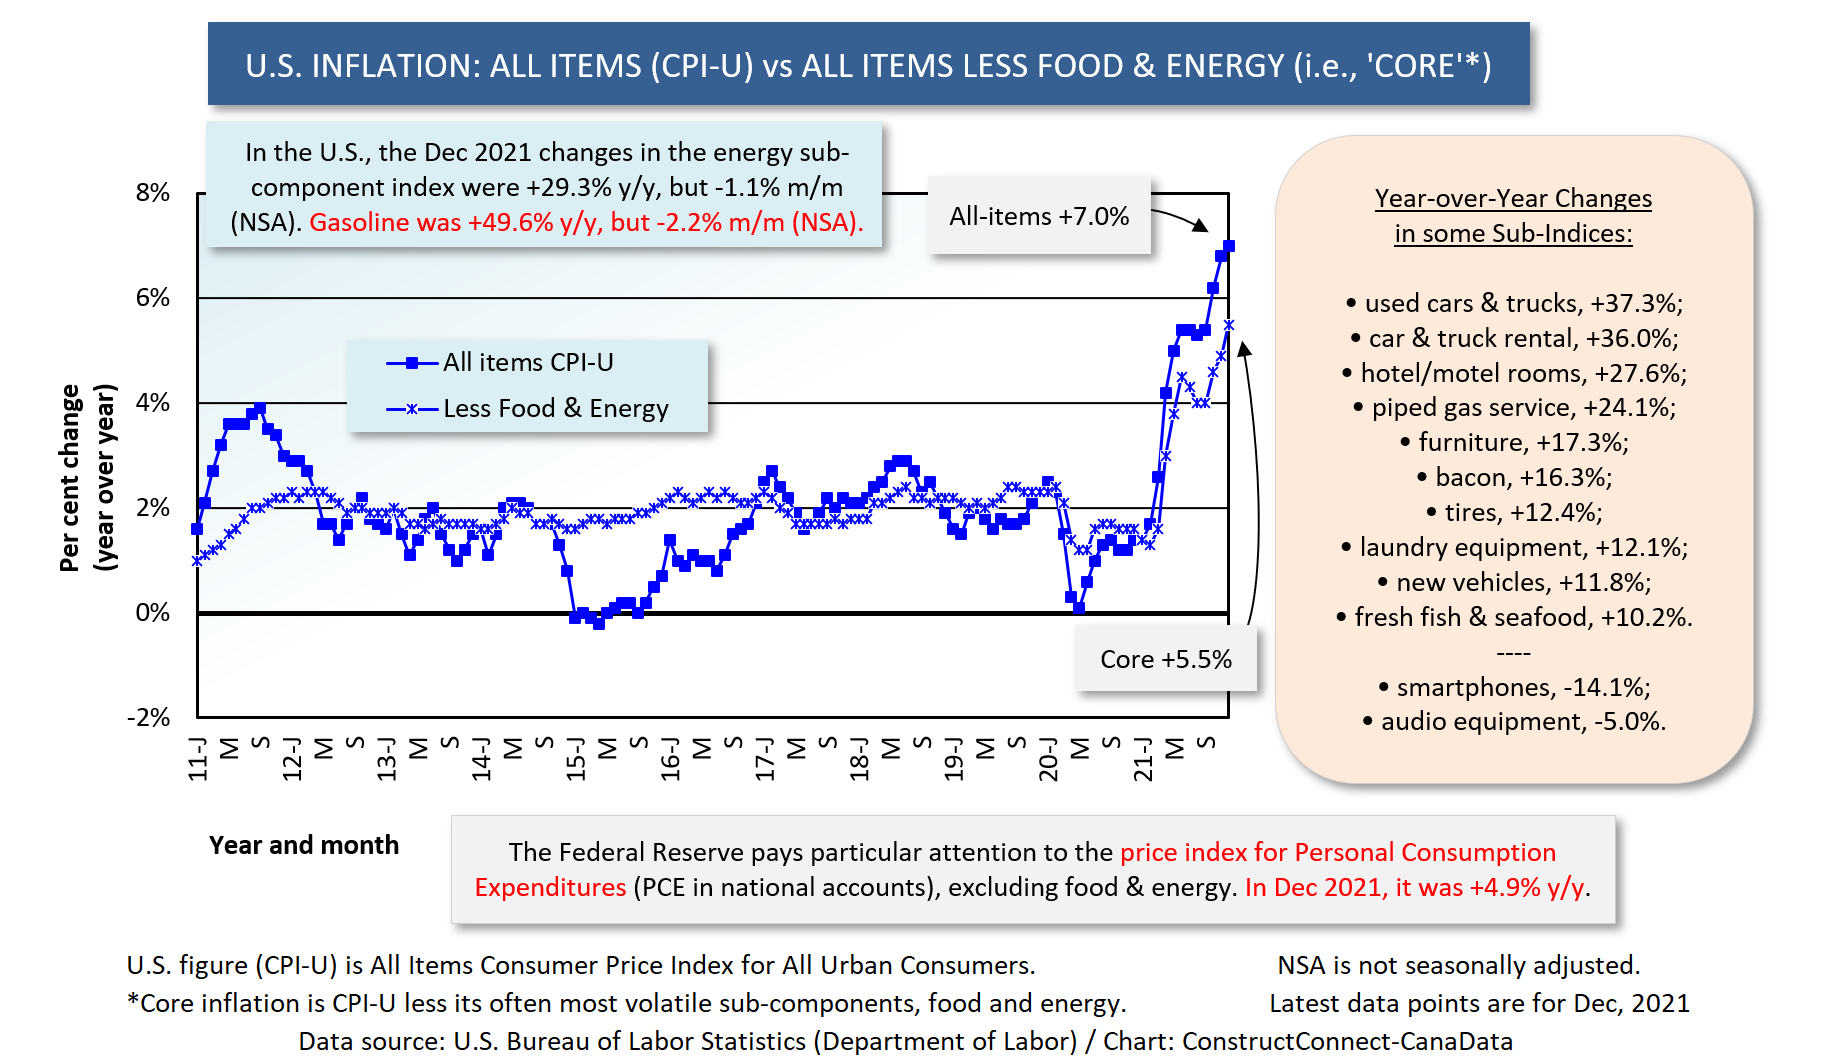
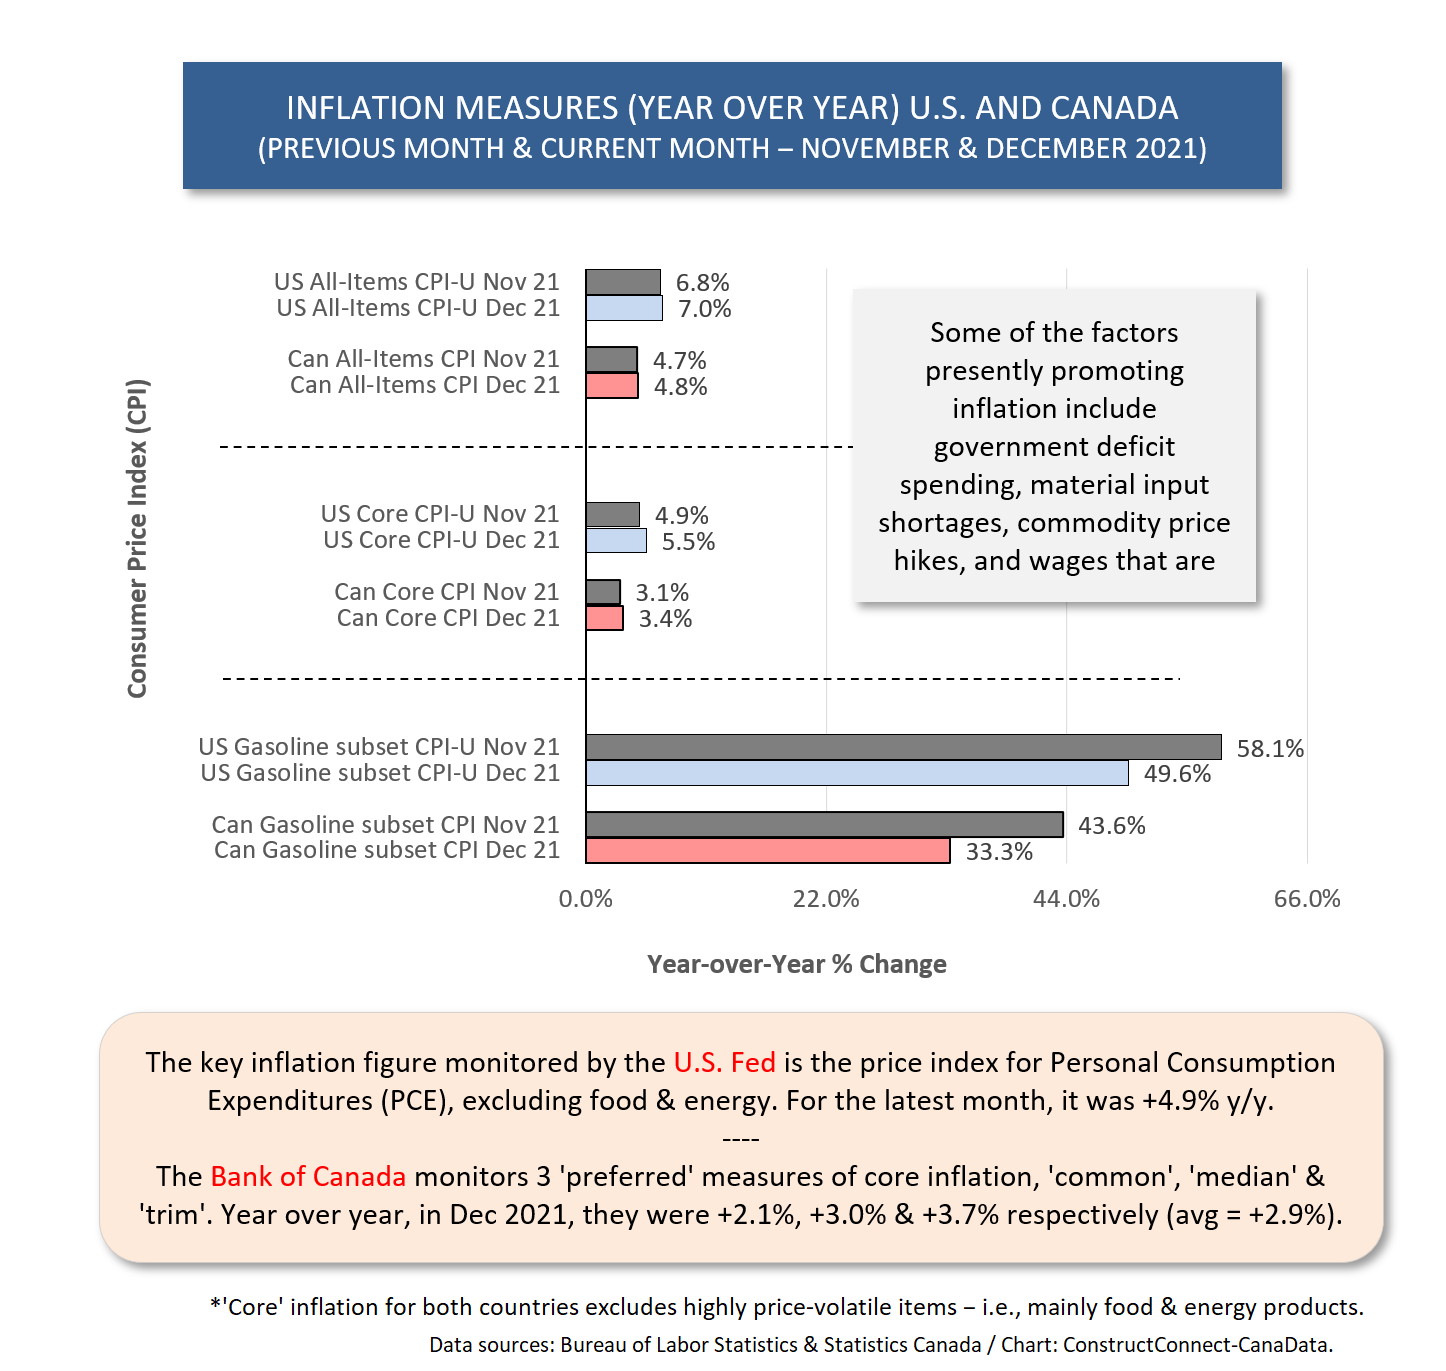
For example, gasoline station sales are so exaggerated, at +41.0% y/y, because the price of petrol has climbed by half (+49.6%) versus the same time last year.
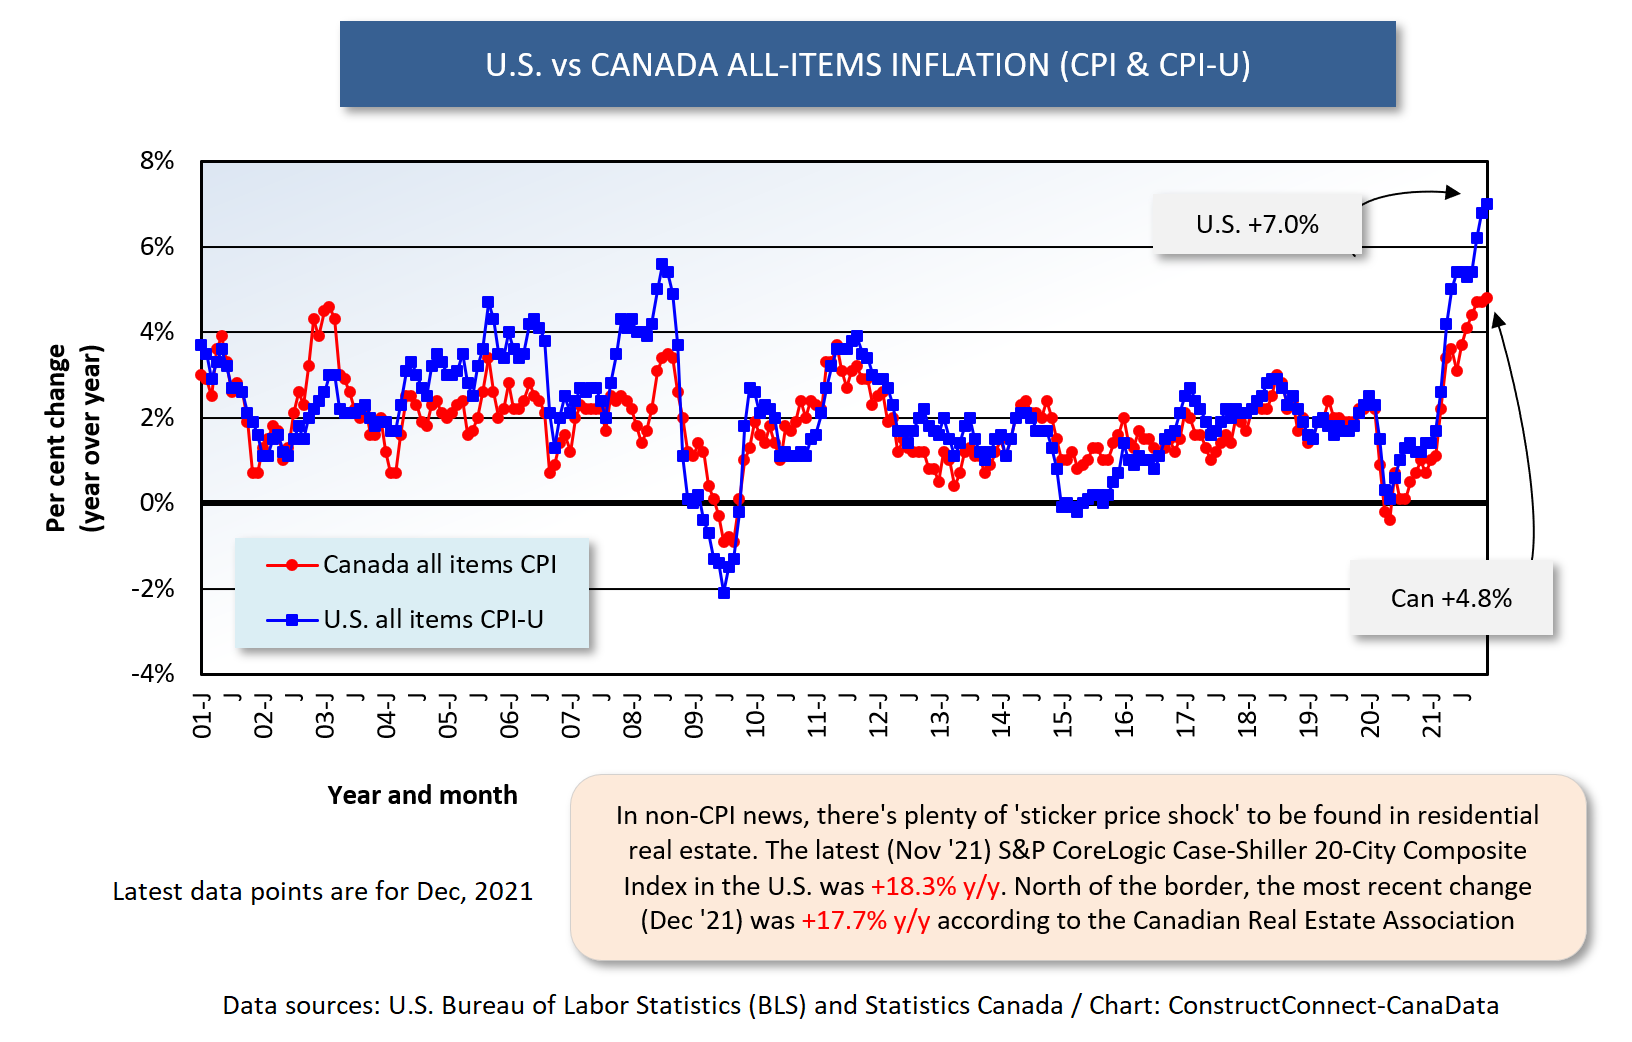
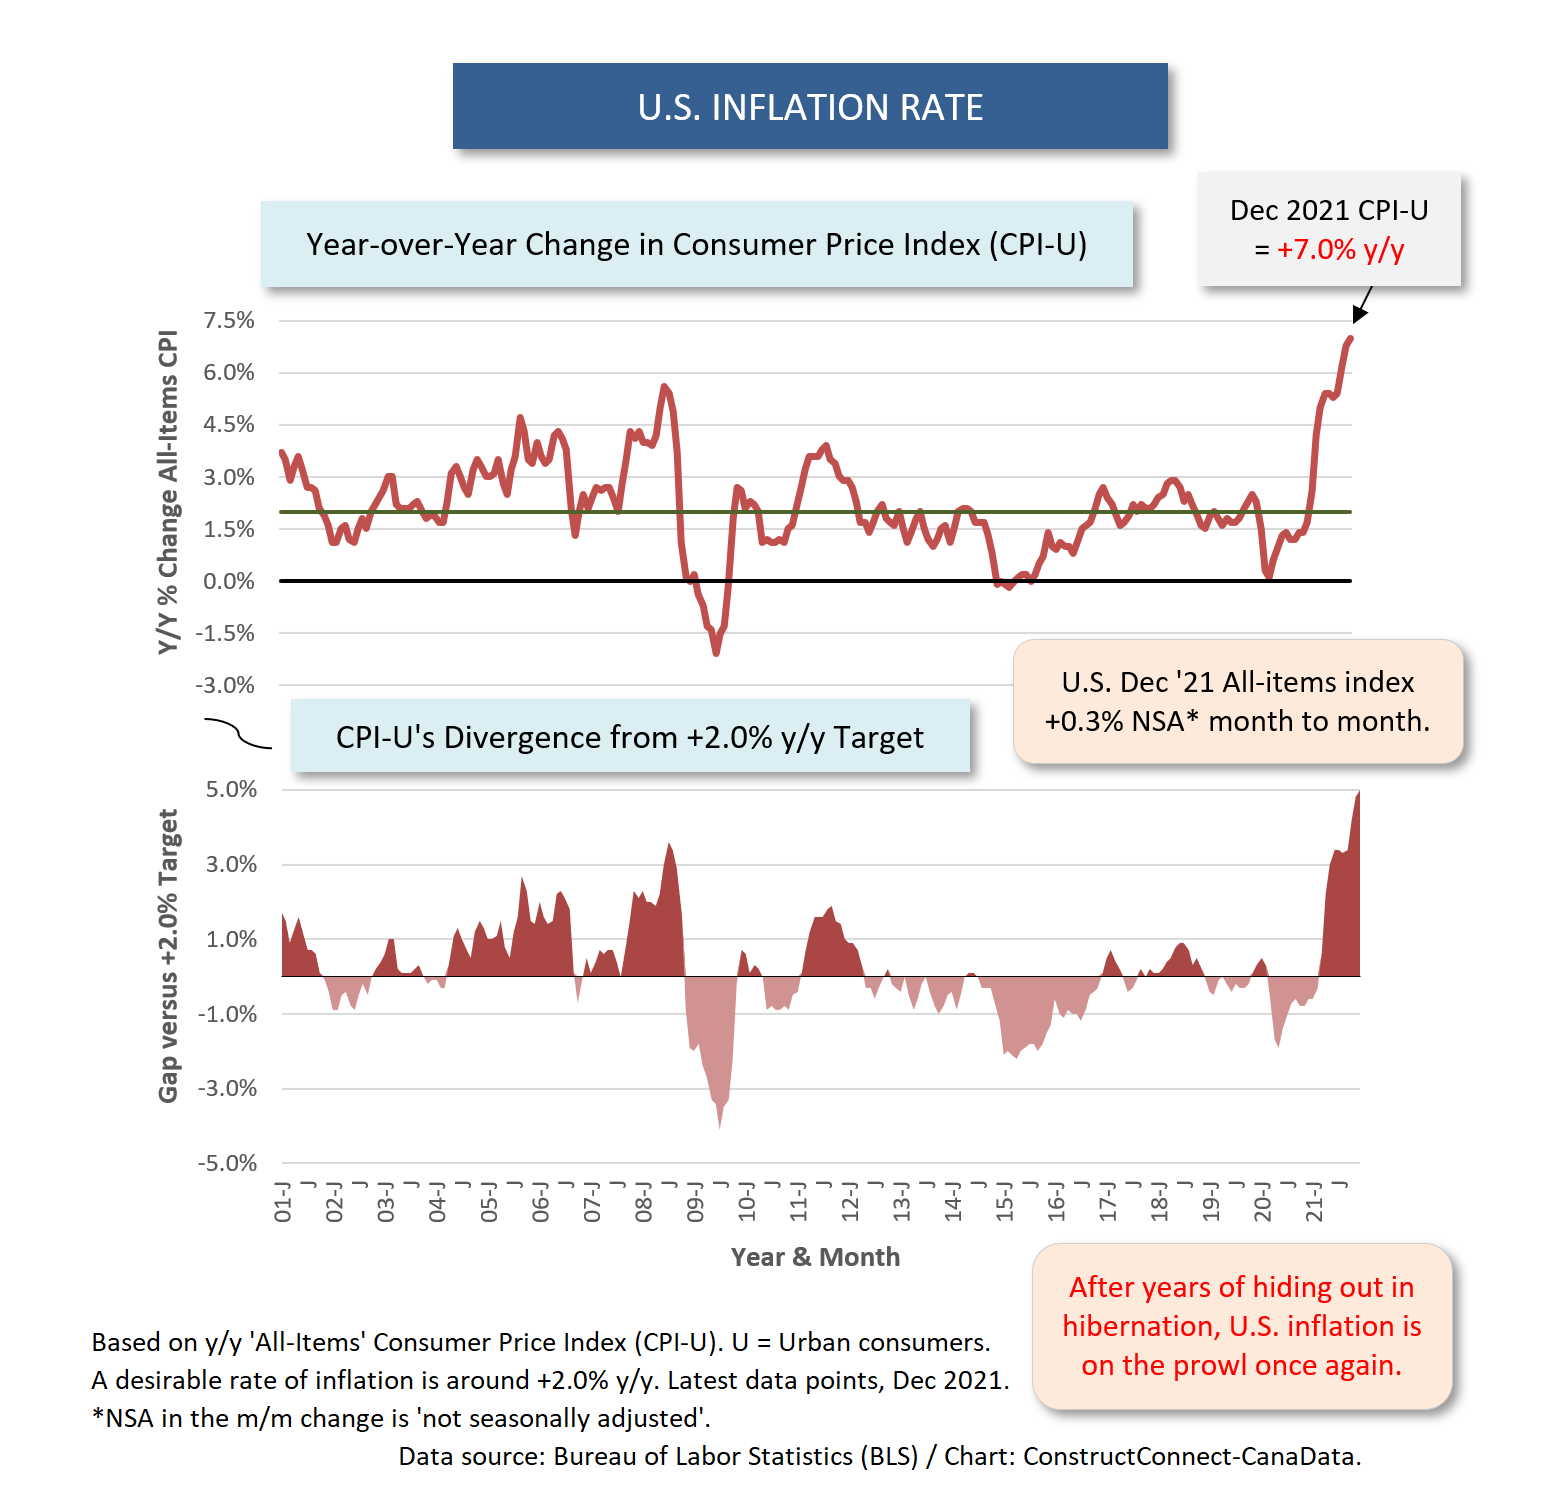
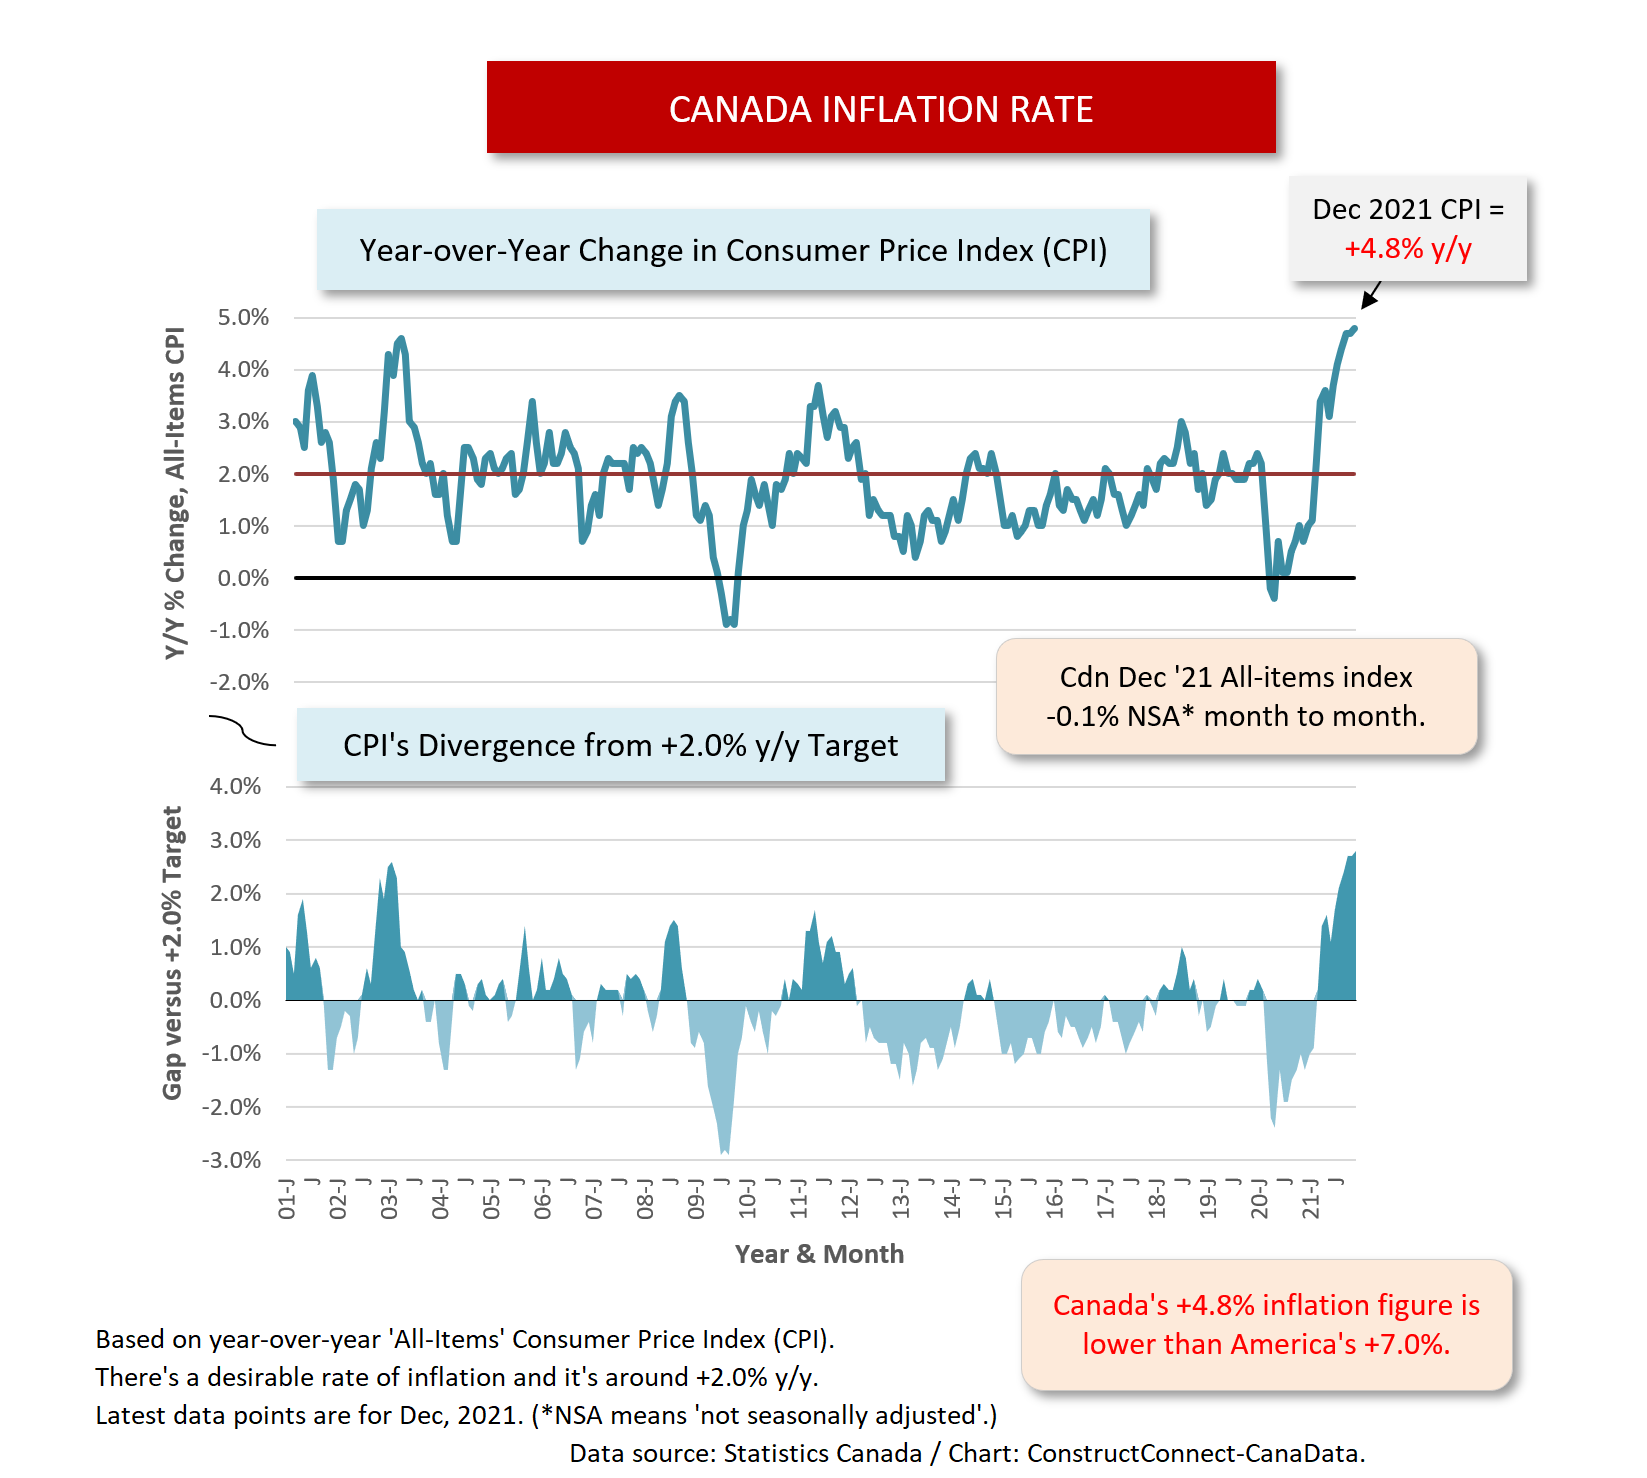
A higher rate of inflation in the U.S. than in Canada, +7.0% y/y compared with +4.8%, also helps explain why retail sales have been speeding along at a faster clip south of the border than to the north (Graph 8).
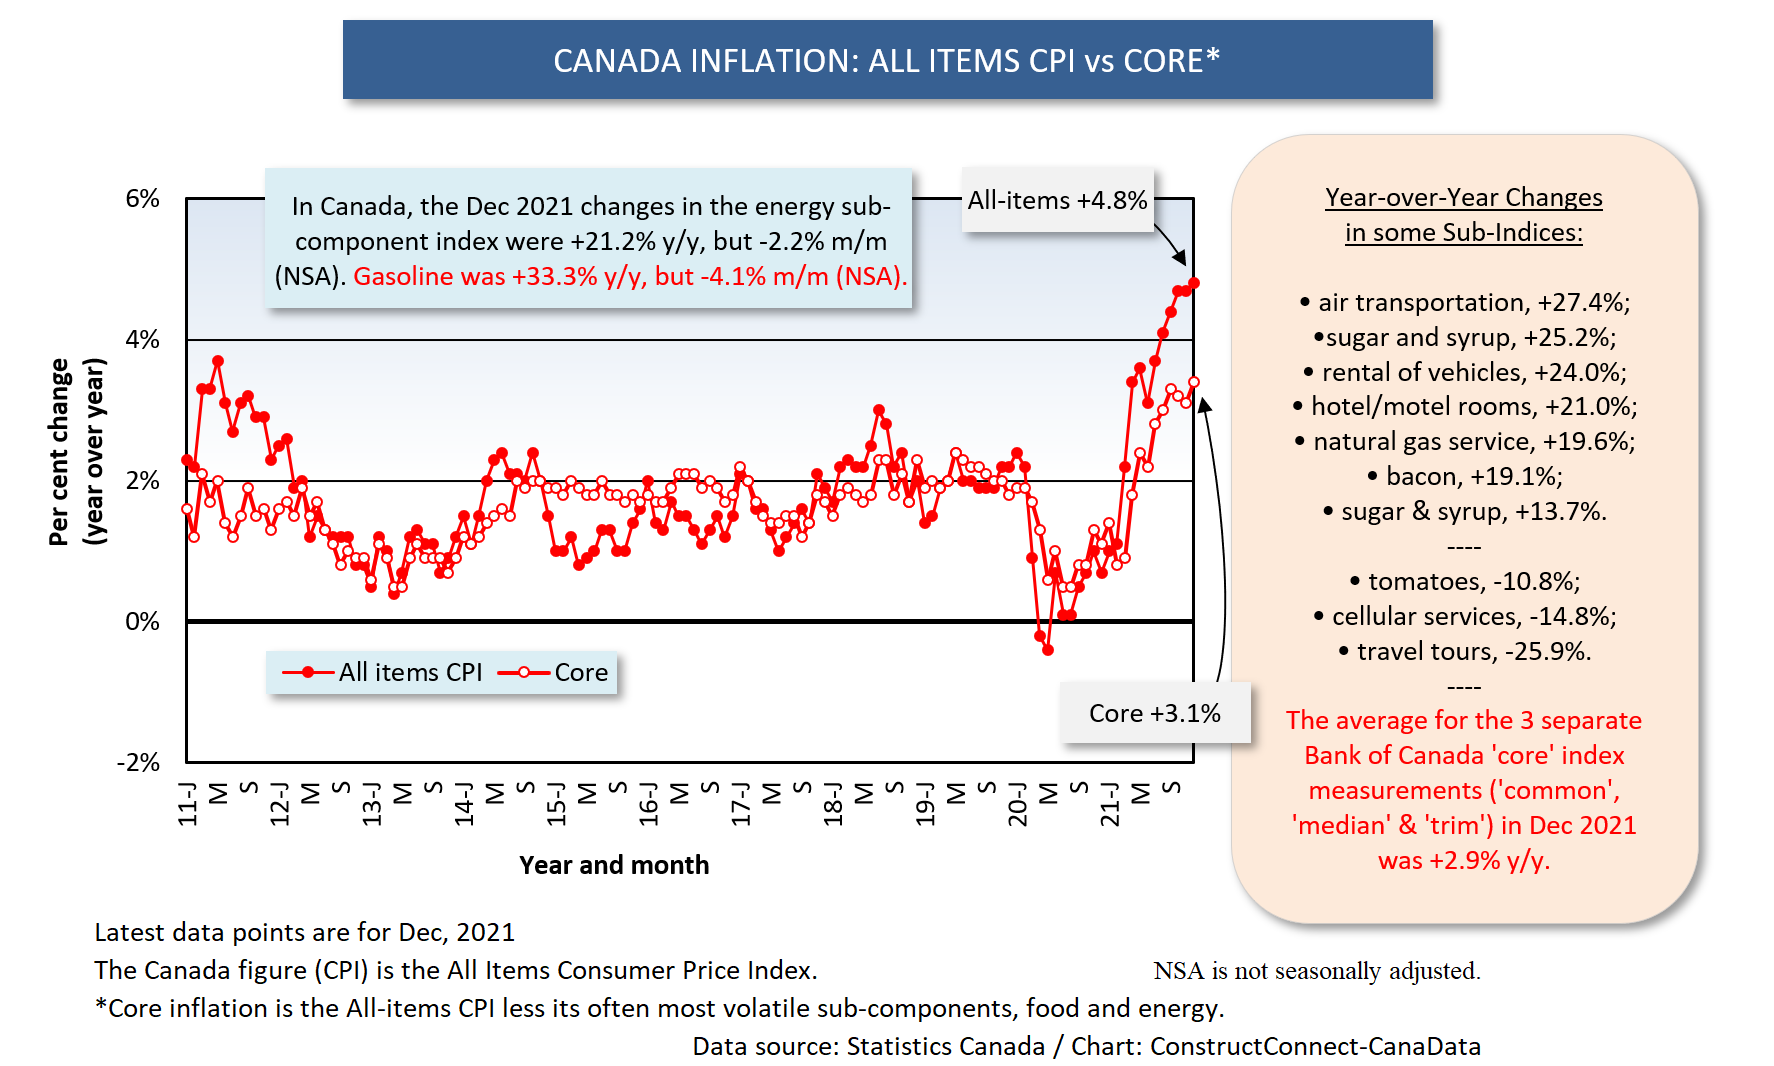
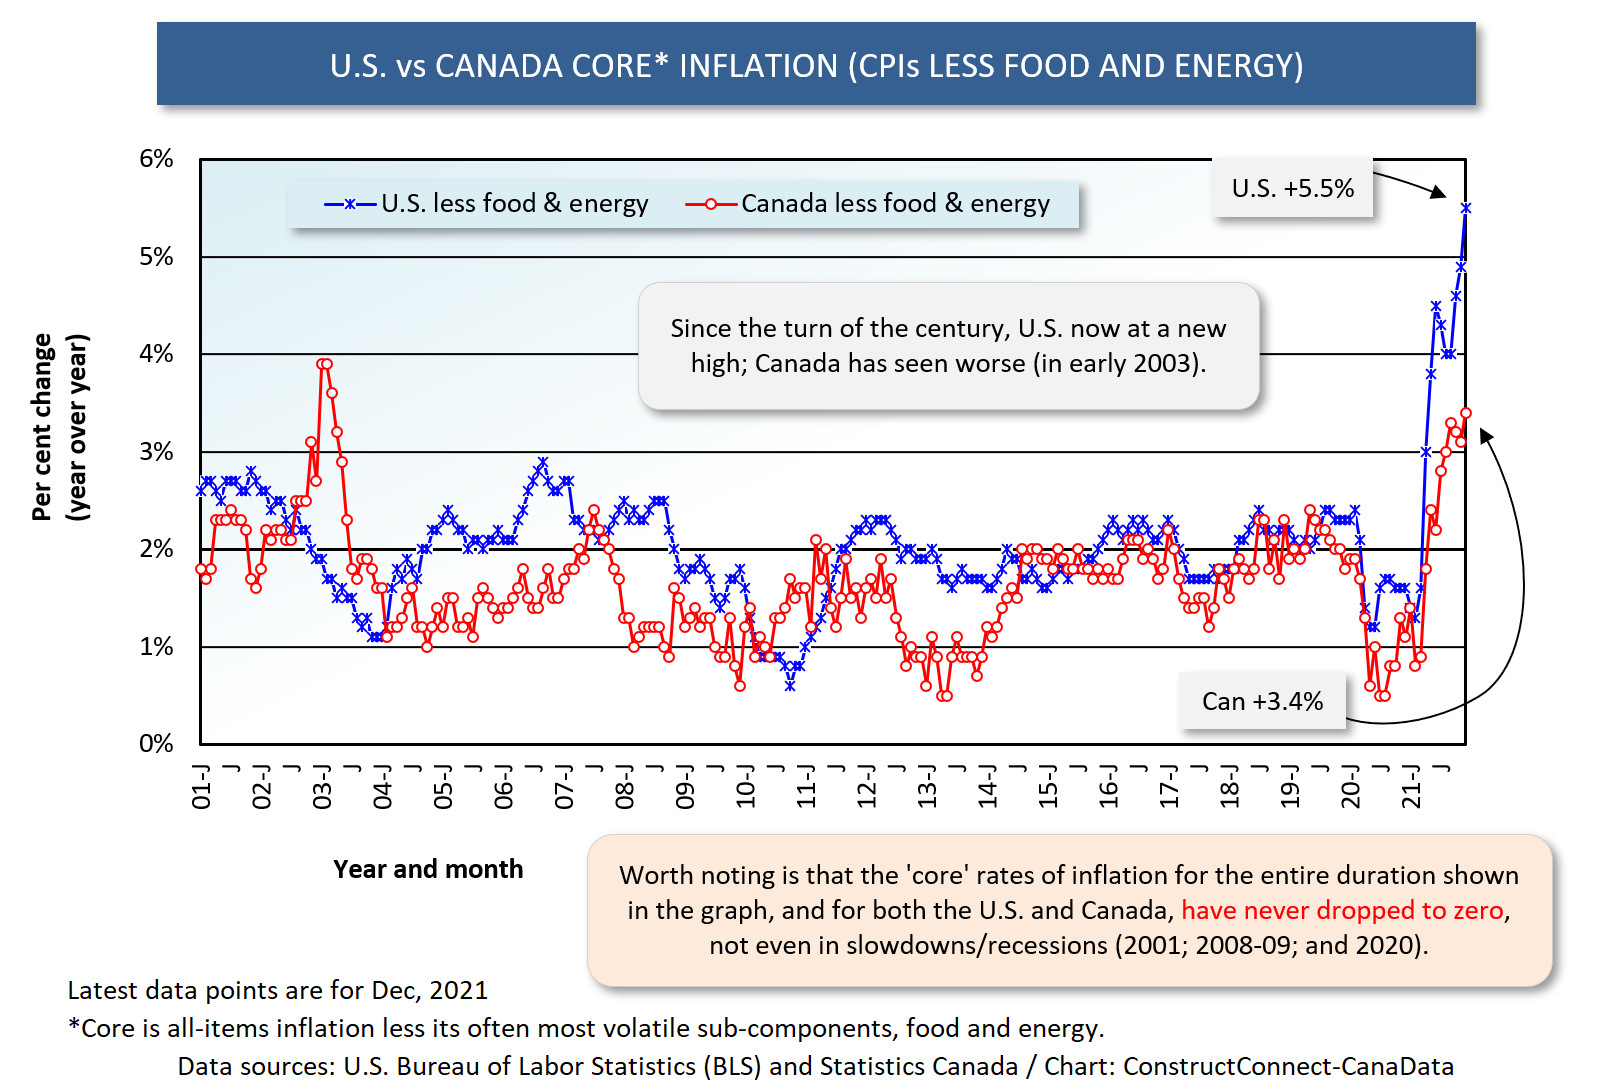
The inflation numbers for the two countries are set out in Graphs 9 through 15. Exploring beyond just the headline rates of +7.0% and +4.8%, the ‘core’ consumer price index (CPI) advances, which exclude often volatile food and energy items, are currently +5.5% in the U.S. and +2.9% in Canada.
Hacking even deeper into the undergrowth, the Federal Reserve pays particular attention to another measure of ‘core’ inflation tied to personal consumption expenditures (PCE), less food and energy, and it is presently +4.9% y/y. The Bank of Canada likes three measures termed ‘common’, ‘median’ and ‘trim’ and their latest average is +2.9% y/y.
According to any of the foregoing percent changes, the U.S. is struggling more with inflation than Canada. And that means there’s more pressure on the Fed than the BoC to lift interest rates.
There’s a flip side to the consumer price inflation issue that speaks to the outlook for construction activity. With each step back from globalization, in recognition of the dangers it poses to supply lines, dramatic price increases are incentives for domestic manufacturers to ramp up production and expand their plants.
Construction’s ‘Bricks and Mortar’ Lifeline
General and sub-trade contractors, plus do-it-yourselfers, continue to support a local ‘bricks and mortar’ retail or wholesale experience. There’s little impulse buying over the Internet.
There’s been some speculation that Amazon, one day, may try its hand at supplying materials to construction job sites. Alarmingly, the image of drones carrying heavy bundles across busy city streets comes to mind. (Surely, safeguards would be put in place.)
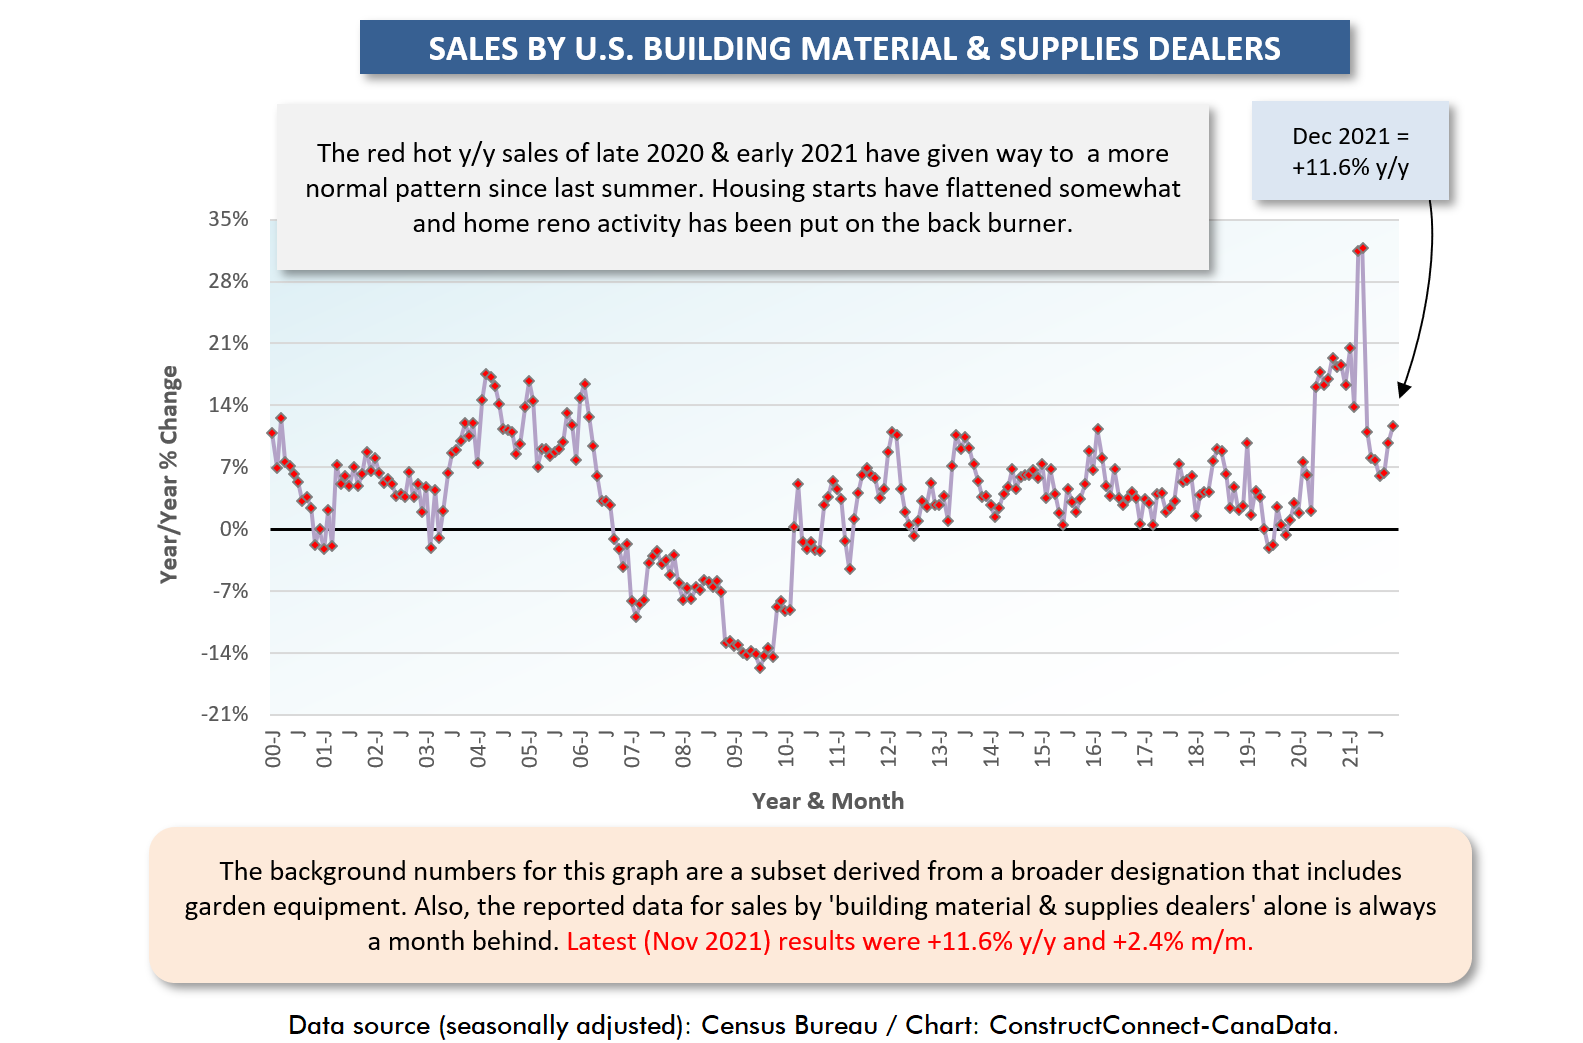
‘Building materials and supplies dealer’ sales in the U.S. in December were +11.6% year over year (Graph 4). Again, price hikes (for forestry, steel, copper, etc. products) played a role in that double-digit percentage-change advance.
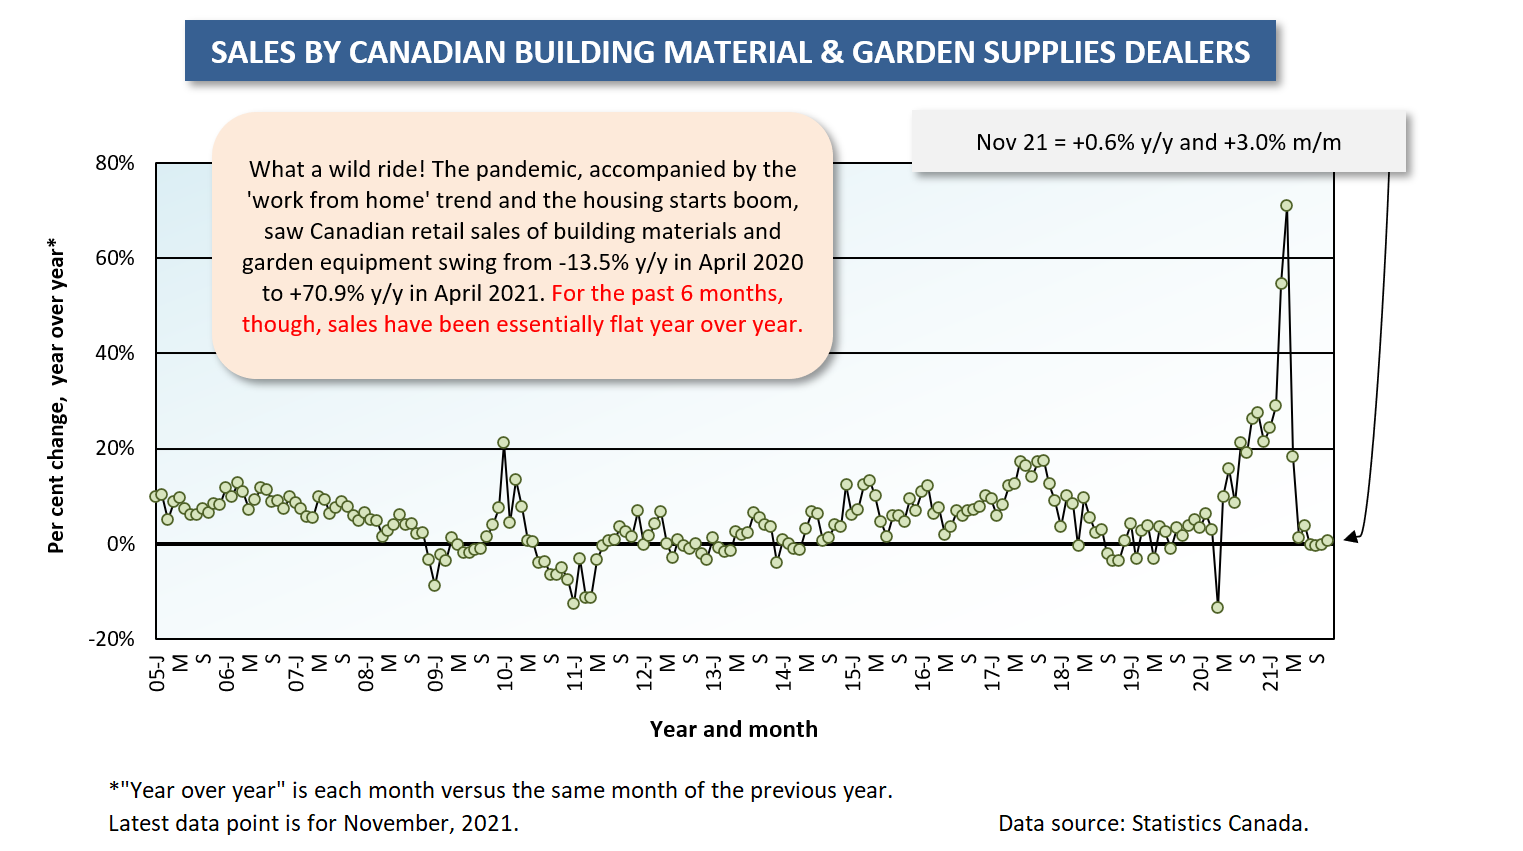
The latest y/y increase in sales by building material suppliers in Canada was only +0.6% y/y (Graph 7). The subdued Canadian result seems a bit of a mystery, given the maxi housing boom that is underway. But know that in April 2021, the y/y change was +71%, establishing an improved base from that point forward.
Graph 1
Graph 2
Graph 3
Graph 4
Graph 5
Graph 6
Graph 7
Graph 8
Graph 9
Graph 10
Graph 11
Graph 12
Graph 13
Graph 14
Graph 15
Alex Carrick is Chief Economist for ConstructConnect. He has delivered presentations throughout North America on the U.S., Canadian and world construction outlooks. Mr. Carrick has been with the company since 1985. Links to his numerous articles are featured on Twitter @ConstructConnx, which has 50,000 followers.


Recent Comments