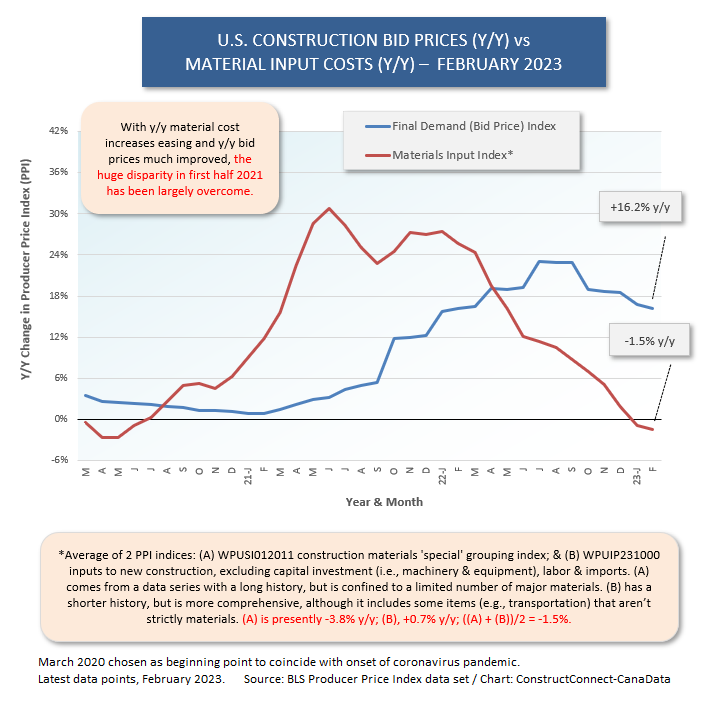
In 2021 and continuing into early 2022, construction material costs, with the pandemic in full swing and interest rates effectively zero, shot up on a year-over-year basis like never before (see Graph 1). Contractors were largely caught by surprise and did not feel they could raise their bid prices right away. Individually, they were worried about winning contracts and surviving.
 In 2022, an easing in material costs began while, at the same time, bid prices gradually stepped higher. As we move into the Spring of 2023, bid prices on a year-over-year basis, are now considerably higher than material cost increases. In fact, the latter has become negative.
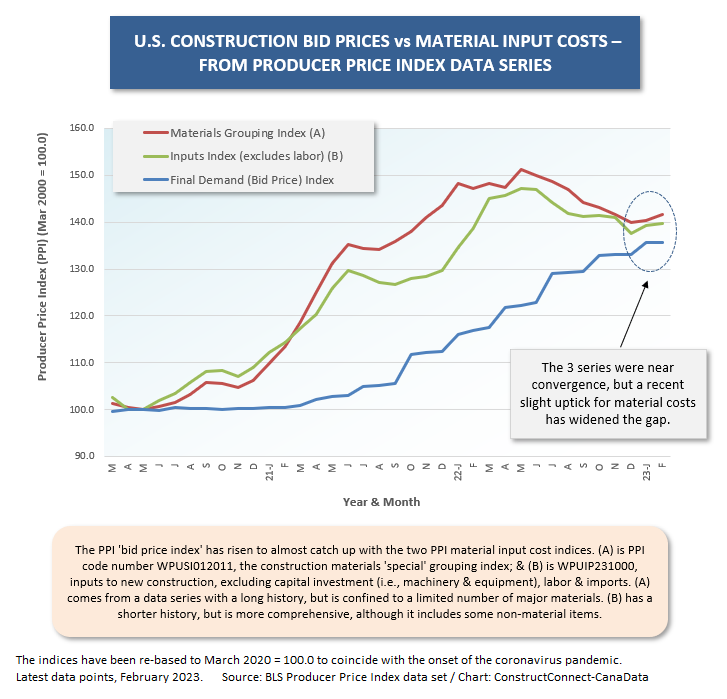
Where do material costs and bid prices stand relative to March 2020 when the pandemic began? Graph 2 answers that question. Graph 2 departs from looking at percentage changes. Rather, it concentrates on the actual values of the indices. The index numbers for material costs and bid prices are re-based to March 2020 equal to 100.0. The series have now converged to about the same spot. Since March 2020, they have increased between +35% and +40%.
Something else jumps out from a look at Graph 2. The two material cost indices, after sliding for more than a year, are now heading up once again, albeit only slightly.
While it’s not the main subject of this article, Graph 3 extends the analysis of contractors’ costs. Graph 3 shows that the year-over-year increase in material input costs may no longer be the main pressure point. Instead, wages are now accounting for bigger cost hikes on a y/y basis.
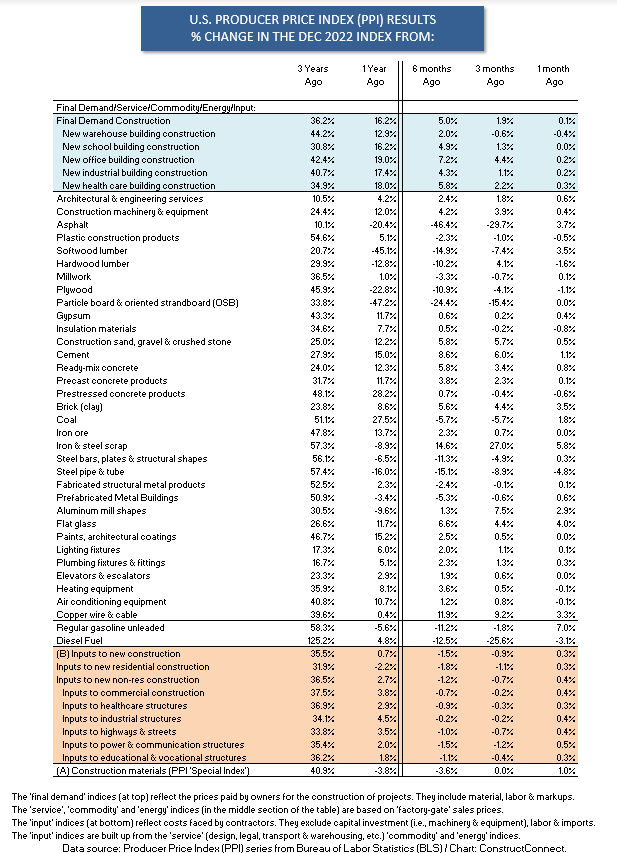
The differences between current y/y increases in bid prices and material input costs is highlighted in the blue- and orange-colored sections of Table 1. At the bottom of the table (orange section) the PPI material inputs to new construction indices range from a low of -2.2% y/y for residential structures to a high of +4.5% y/y for industrial structures. At the top of the table (blue section), the final demand (i.e., ‘bid price’) indices range from a low of +12.9% for new warehouse construction to a high of +19.0% for new office building construction.
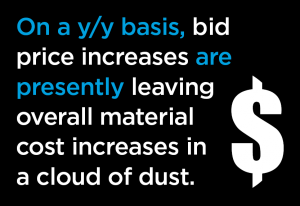
On a y/y basis, bid price increases are presently leaving overall material cost increases in a cloud of dust. Nevertheless, there are some material cost increases that, after soaring in COVID’s early days, have not settled back down, and appear to be quite sticky on their new elevated perches.
Graph 1 and Cluster Charts 1 to 7, with accompanying commentary (scroll down), provide insight into cost performances in the various corners of the construction materials marketplace.
Graph 1
Graph 2
Graph 3
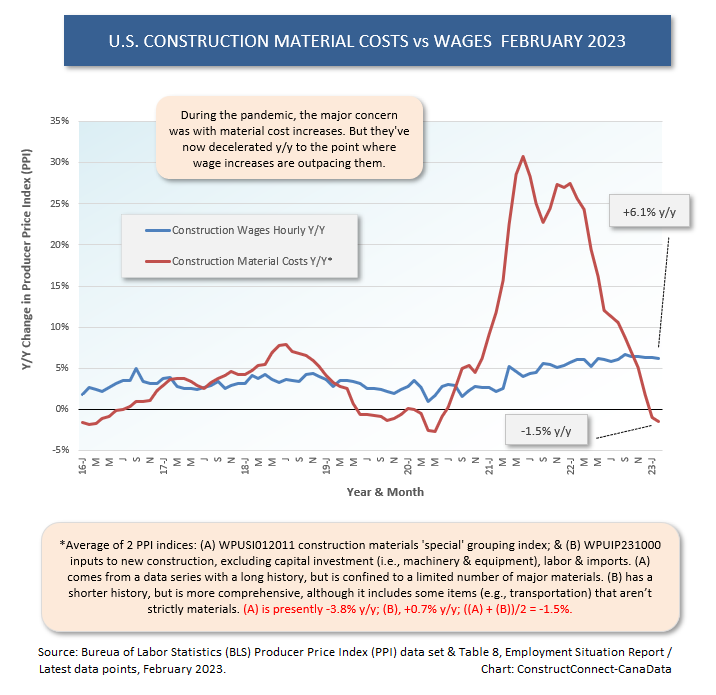
Table 1
Graph 4
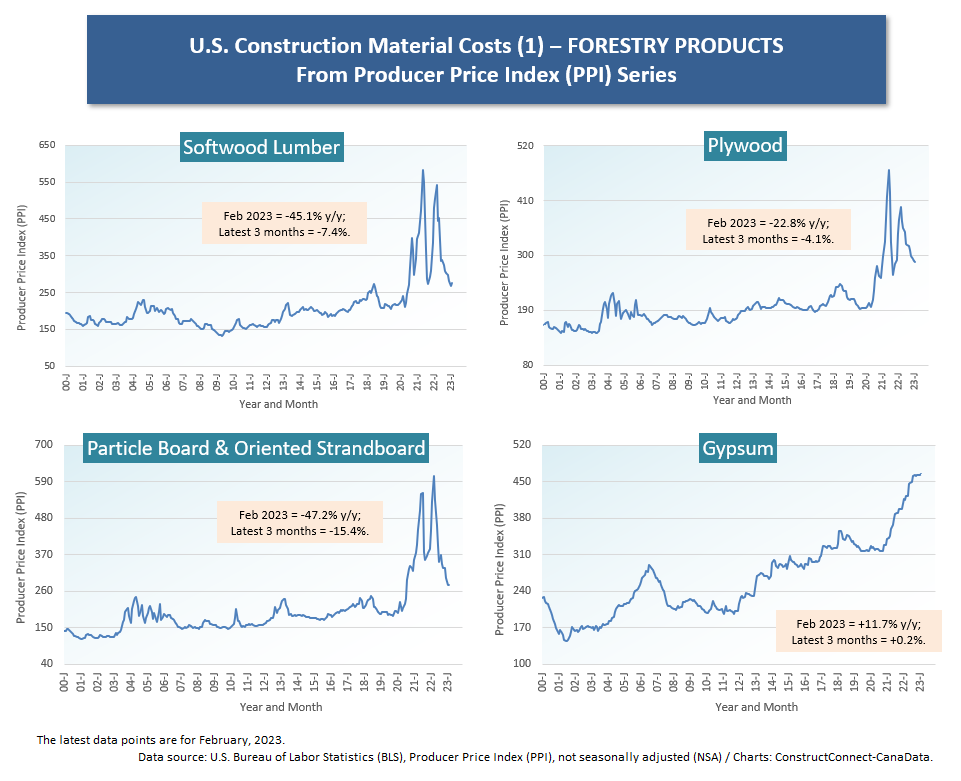
Cluster Chart 1 – Forestry Products
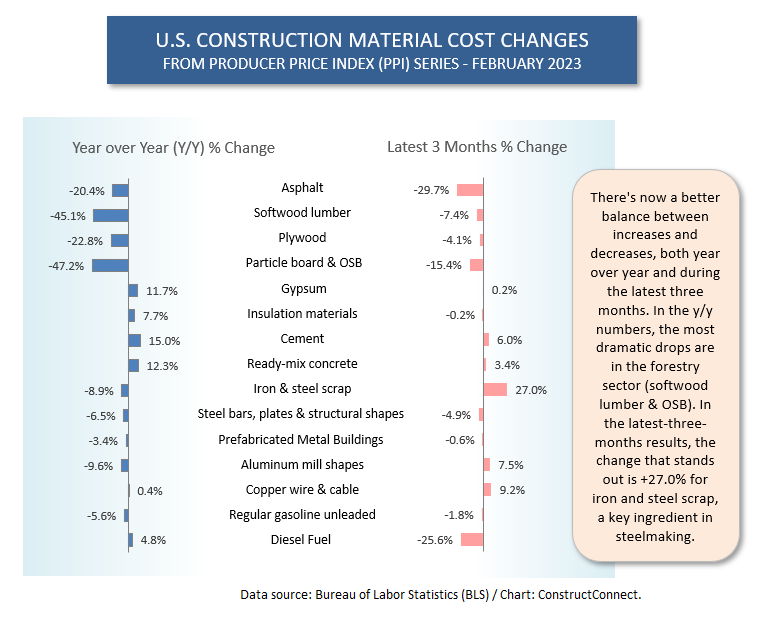
The monthly number of new home starts in the U.S. (annualized) is receding, punched hard by higher interest rates. In turn, this is knocking the props out from under forestry product prices. Softwood lumber’s February PPI was -45.1% y/y and -7.4% in the latest quarter. The PPI for particle board and OSB was sent for an even bigger loop y/y, -47.2%, or down by almost half. And it was -15.4% over the latest three months. Gypsum, though, which has a wider type-of-structure market reach, was +11.7% y/y, and it’s been flat in the latest three months, +0.2%.
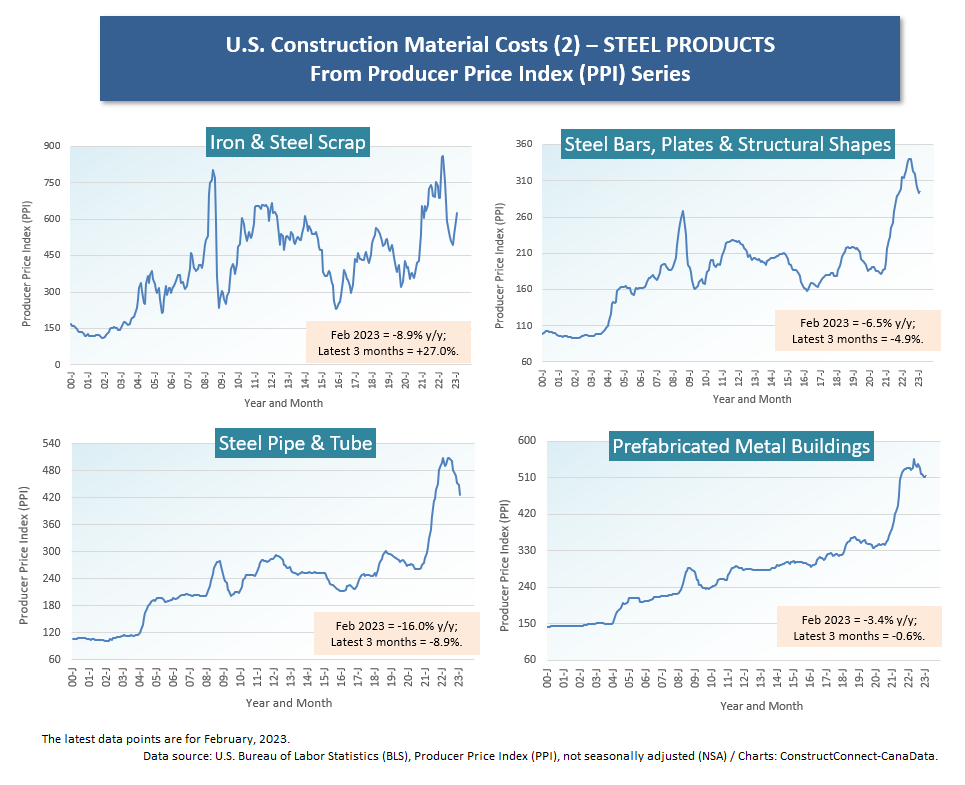
Cluster Chart 2 – Steel Products
The PPI indices for steel have all moderated y/y, with ‘pipe and tube’ down the most, -16.0%. One number that’s eye-catching, though, is the +27.0% result during the latest three months for iron and steel scrap. Steel scrap is the key ingredient that is fed into electric arc furnaces to make steel. The price of steel in its final form won’t stay down if the cost of the material that’s used to make is on an upward march. Capital spending on sizable additions to steelmaking capacity is underway in the U.S. Also, China’s economy is expected to perk up considerably (i.e., post no-tolerance for COVID outbreaks), and its steel industry has a big impact on supply and demand internationally.
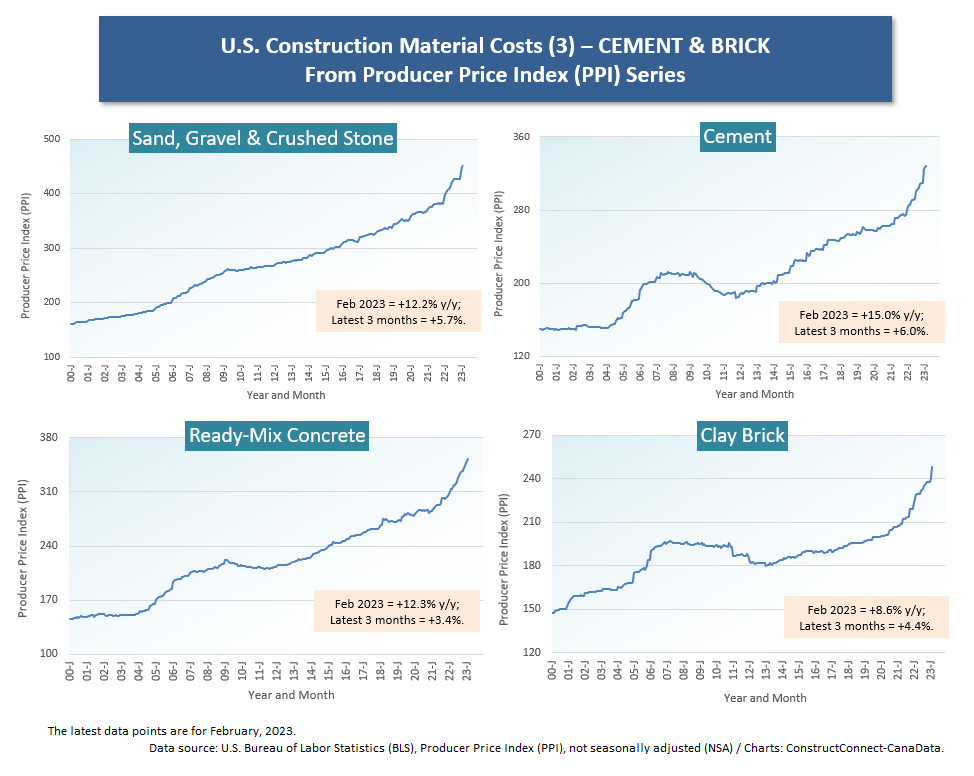
Cluster Chart 3 – Cement and Concrete Products
The separate graphs in Cluster Chart 3 offer big surprises. Cement and ready-mix prices don’t normally act like this, shooting skyward and staying there. February’s PPI for cement was +15.0% y/y and there was no relief in the shorter latest-three-months’ time frame, +6.0%.
There are demand and supply factors coming into play. The big push by government for infrastructure upgrades and new roll-outs ensures hefty levels of cement and concrete demand for years to come. At the same time, cement and concrete suppliers are faced with their own input cost challenges, centering on aggregate, diesel fuel for trucks, and the need to reduce carbon emissions.
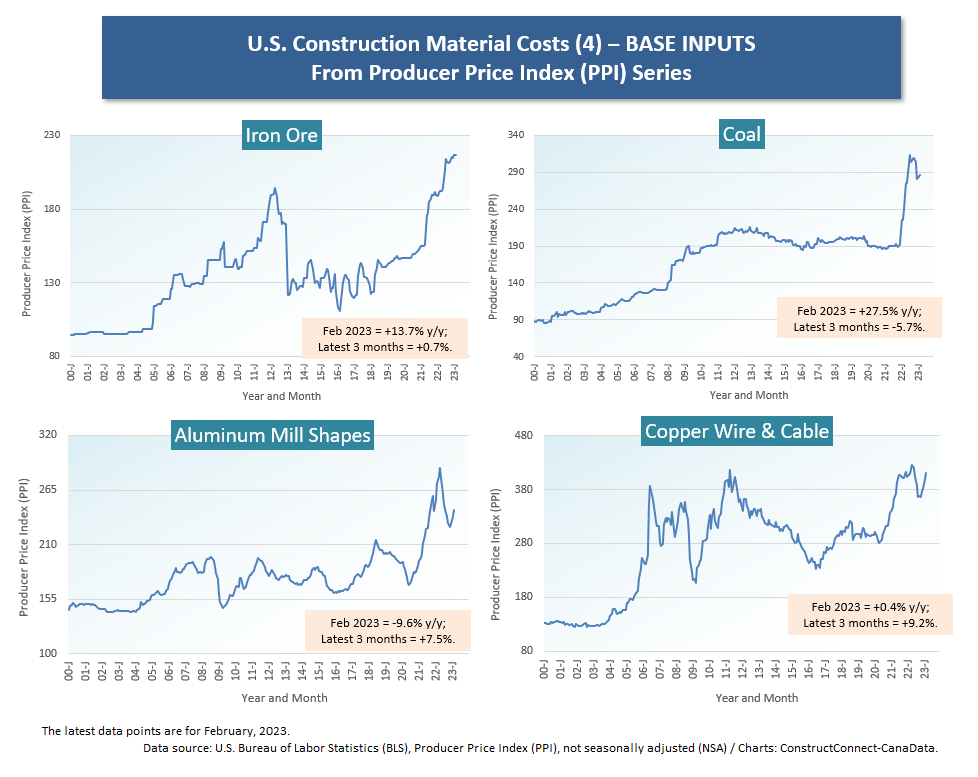
Cluster Chart 4 – Base Inputs
The prices of coal, aluminum mill shapes, and copper wire and cable have all relaxed a little from their recent peaks. But they also have little uptick curls at the ends of their curves (i.e., in late 2022 and early in 2023), suggesting that their run-ups in prices may not be entirely over. Iron ore, a key ingredient in blast furnace steelmaking, has seen its PPI figure climb to a new peak and it’s not, as yet, signaling any inclination to return to ‘base camp’.
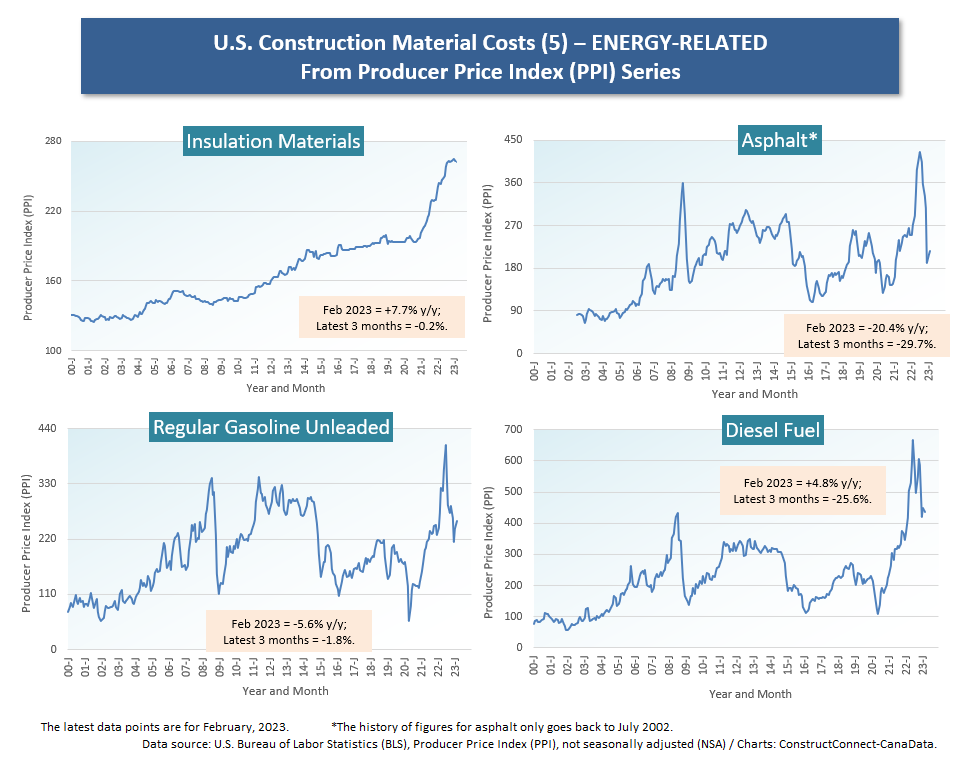
Cluster Chart 5 – Energy Products
Asphalt, gasoline, and diesel fuel prices have a history of volatility. In 2022’s up cycle, they rose beyond their previous peaks. There was a frenzy of concern over how Europe could possibly meet its energy requirements when Russia, in retaliation for sanctions, cut off its export shipments to the West, replacing them with sales to China and India. Germany and several other countries showed remarkable resiliency in lining up sources from elsewhere, including America. In 2023, it’s been thoughts of recession that have suppressed prices. The PPI for insulation materials, though, while leveling out, is still far above where it was just a few years ago.
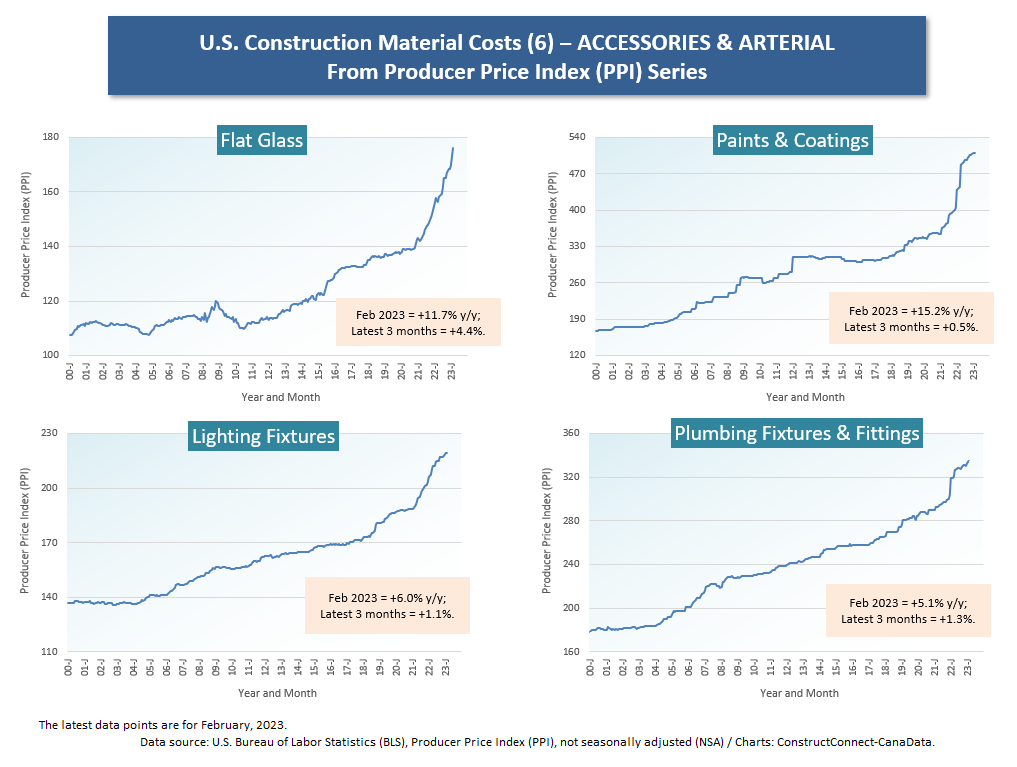
Cluster Chart 6 – Accessories and Arterial
Flat glass (separate from auto glass) is another construction material that has been showing a pricing pattern way out of keeping with its past history. Prior to the pandemic, the price of glass moved in an orderly and restrained manner. There were no big year-over-year price leaps. Now, the PPI for glass is +11.7% y/y. Nor is there evidence of deceleration. The latest three months change was +4.4%. The PPIs for paints and coatings, lighting fixtures, and plumbing fixtures and fittings have exhibited greater steepness in their curves over the past two to three years as well. Currently, though, they’re also showing a tendency to cut back on the speed of their advances. Their latest-three-month changes are all positive, but none by more than a rounded +1%.
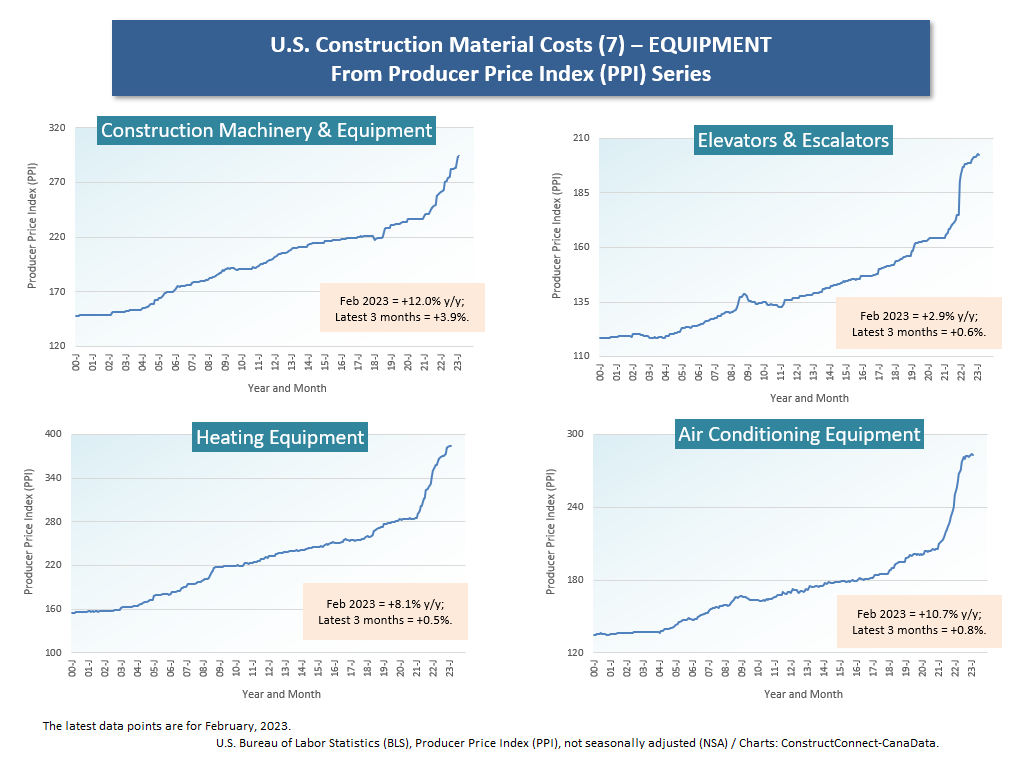
Cluster Chart 7 – Equipment
The equipment PPI graphs in Cluster Chart 7 stand out for their consistency. All four have quite similar shapes. These are more finished products and, as such, they do not have the price swings that will often be found in inputs that are either basic commodities or are only a processing step or two away from that status. The price hikes for these equipment categories will likely prove quite sticky. There are certainly few instances of radical downward adjustments appearing in earlier periods in the curves. Presently, the lowest y/y change in the four equipment categories is for elevators and escalators, +2.9%. But that’s deceptive; if the comparison is extended back 16 months rather than the 12 months inherent in a y/y calculation, the increase has been +15.8%.
Alex Carrick is Chief Economist for ConstructConnect. He has delivered presentations throughout North America on the U.S., Canadian and world construction outlooks. Mr. Carrick has been with the company since 1985. Links to his numerous articles are featured on Twitter @ConstructConnx, which has 50,000 followers.


Recent Comments