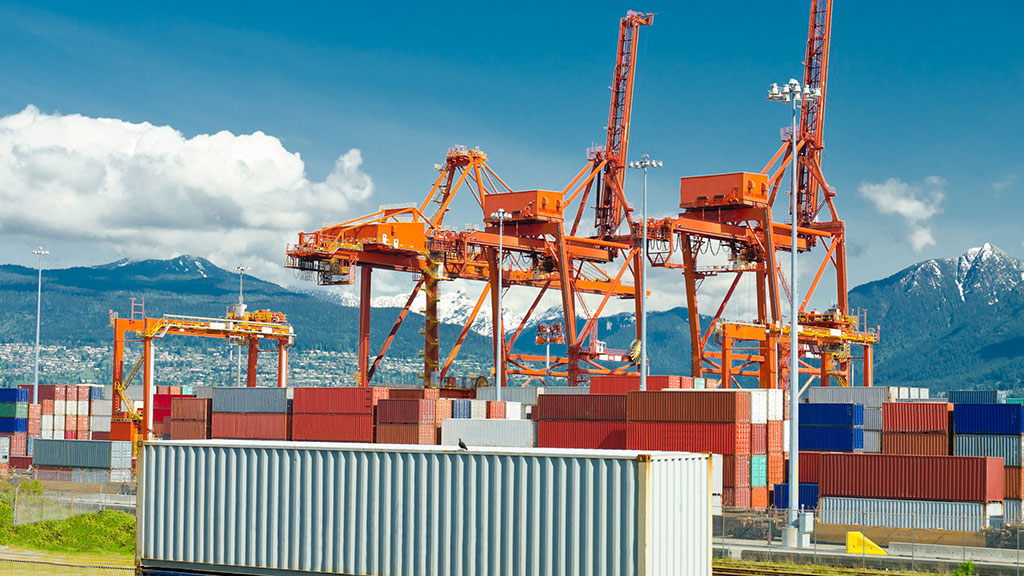
Much of Canadian construction activity ties to extraction (or harvesting) of the nation’s resources. Canada has such an abundance of resources that, with respect to most commodities, domestic demand can be readily satisfied, leaving a great deal of scope for export sales. The difference between big export dollar volumes and low import dollar volumes makes a significant contribution to gross domestic product (GDP).
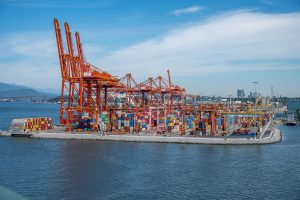
 In what follows, the capital spending prospects emanating from 17 Canadian material export categories are discussed and assessed. Beyond development at primary sites, there are also related undertakings in air, rail and road transportation to move product to border crossings and ports for out-of-country transportation. Plus, there are new initiatives in such fields as carbon capture and storage and hydrogen production plants.
Oil
In the 00s, Alberta arguably underwent the most spectacular building boom tied to one resource deposit in Canada’s history. Development of the Oil Sands in the northeast of the province drew in immense amounts of capital and attracted workers from across the country, especially the Atlantic Region, and from other countries. With the Oil Sands extending across the provincial border, Saskatchewan participated in the bonanza as well, to a lesser extent. Newfoundland and Labrador has also benefitted from oil development, but from offshore drilling fields.
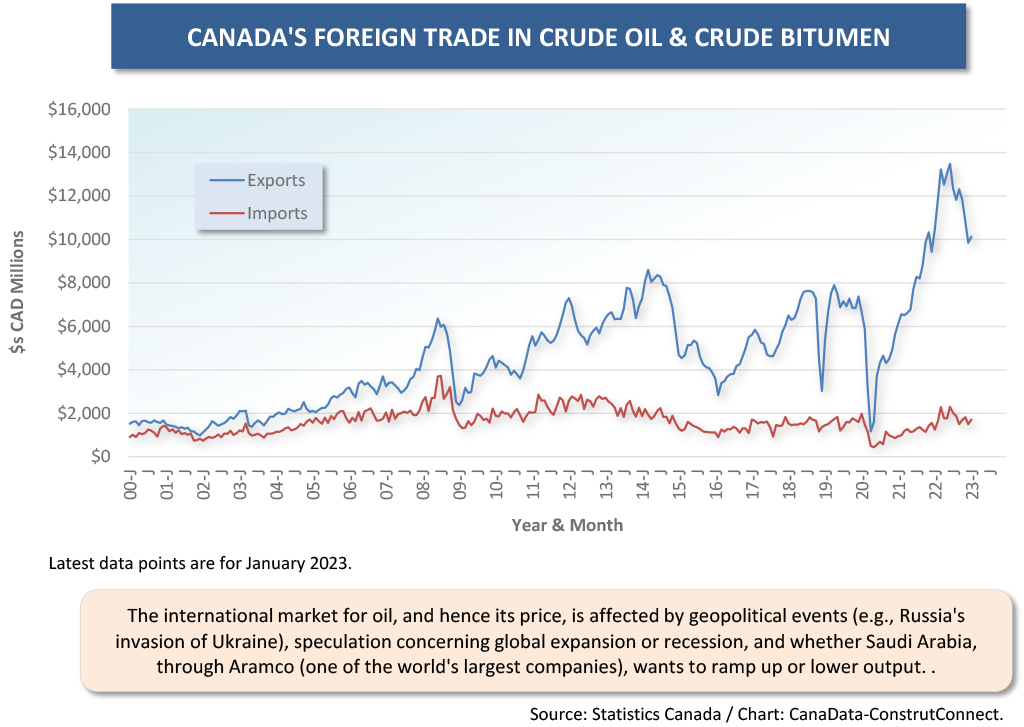
The payoff from those intense capital spending years has been spectacular. The monthly surplus in the trade of oil has been as much as $12 billion. The hangups for Canada, though, lie in the extreme volatility of the global price of crude; the discount forced on ‘heavy’ as opposed to ‘light’ oil; less than desirable pipeline capacity heading both south and west; and an ongoing public perception that a further promotion of Oil Sands properties would be harmful to the environment, despite the messaging the industry is doing to showcase its CO2 reduction successes.
Graph 1
Natural Gas
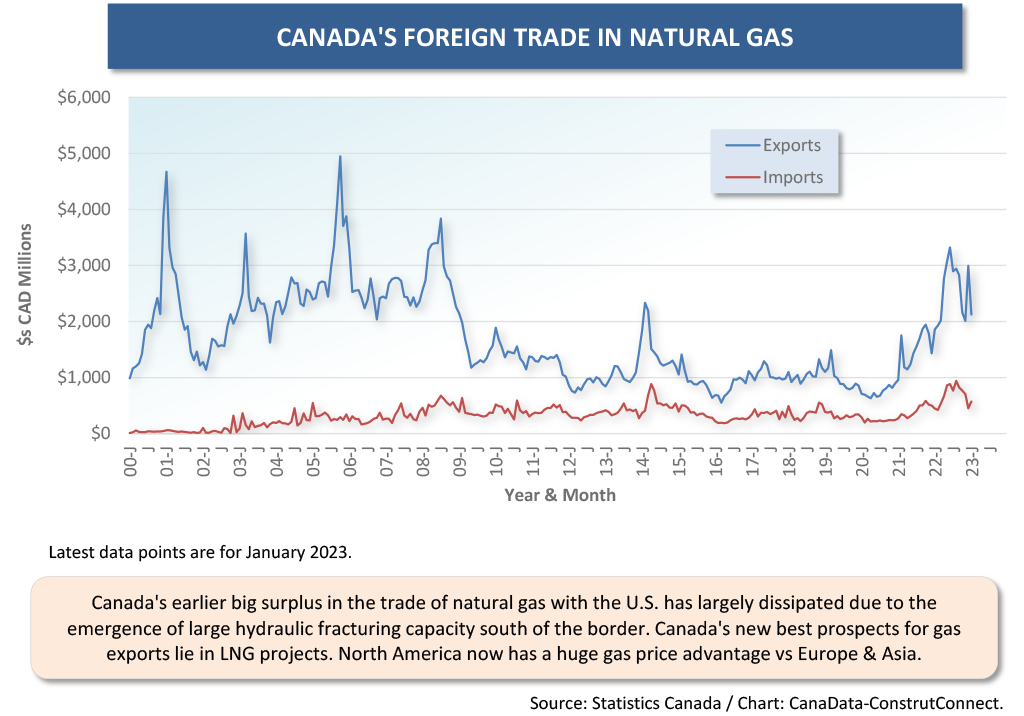
With extensive hydraulic fracturing now taking place in the U.S., Canada has lost much of its natural gas supply advantage vis a vis the American marketplace. In its stead, acting to spur on exports of natural gas to other foreign locations, has been the enormous pricing differential that has opened in North America versus Europe and Asia. A sequence of events following Russia’s invasion of Ukraine saw the West’s imposition of sanctions followed by retaliation in the form of a termination of pipeline shipments of gas to Europe. Plus, there was the mysterious sabotage of the twin Nord Stream pipelines.
Last summer, the price of natural gas in Europe soared to $70 USD per mcf. Due to extreme conservation measures, sourcing from other nations (Middle Eastern, African, and the U.S.) and the fortuitous circumstance of a relatively mild winter, European natural gas now sits around $20.00 per mcf. North American gas is less than $3.00 per mcf.
This provides a huge incentive for U.S. and Canadian producers to build LNG exporting facilities. Canada’s surplus in trade will soar once the Canada LNG project being built in northwest British Columbia comes onstream in a couple of years. There is already talk of doubling the capacity of that facility, and of using renewable hydro power as the feedstock for the electricity generation needed to cool the gas to a liquid state in the next phase, rather than the extra natural gas that will be set aside for the purpose in the first phase. More such LNG undertakings on Canada’s west and east coasts are being contemplated.
Graph 2
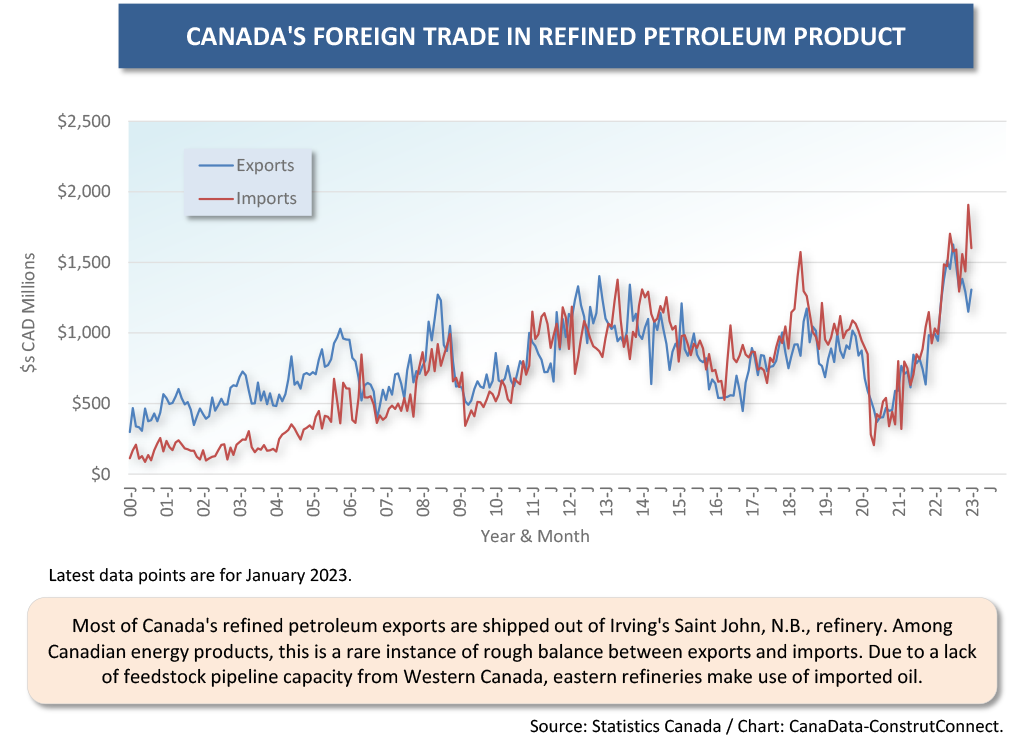
Refined Petroleum
Earlier, there was brief mention of Canada’s oil industry failings. The most glaring deficiency, made obvious by the trade statistics, is in the refining of crude to become motor vehicle gasoline. There are 17 graphs in this article. There’s only one of them where the dollar volumes of exports and imports aren’t vastly out of whack in favor of the former. At least in refined petroleum, the trade relationship isn’t reversed; rather, it is in a rough balance. Eastern refineries in Canada count on oil supplies from outside the country (e.g., cheap tanker shipments from Saudi Arabia) due to a lack of pipeline infrastructure to move crude across the country from Alberta.
Graph 3
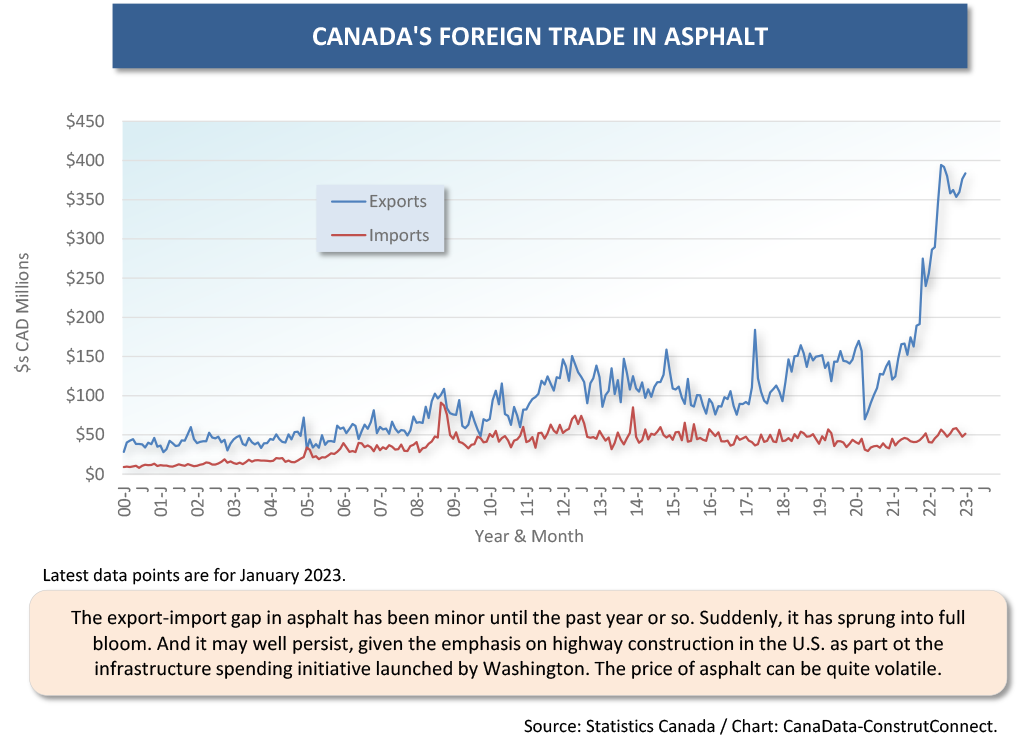
Asphalt
Canadian exports of asphalt have taken flight in the past two years. A focusing on infrastructure improvements in the U.S. in recent legislation, with roads and highways top of mind, has upped the demand for paving material. Asphalt has a notorious history of wild price swings.
The big price movements of many construction materials in the COVID-influenced years of 2020 and 2021 caused many sub-trades to insist that ‘escalation clauses’ be added to their contracts with owners. While this is something relatively new for most firms in the industry (although it was prevalent in the inflationary times of the 1980s as well), it isn’t for roadbuilders. Many of them are quite familiar with the need for price escalation protection when it comes to procuring asphalt.
Graph 4
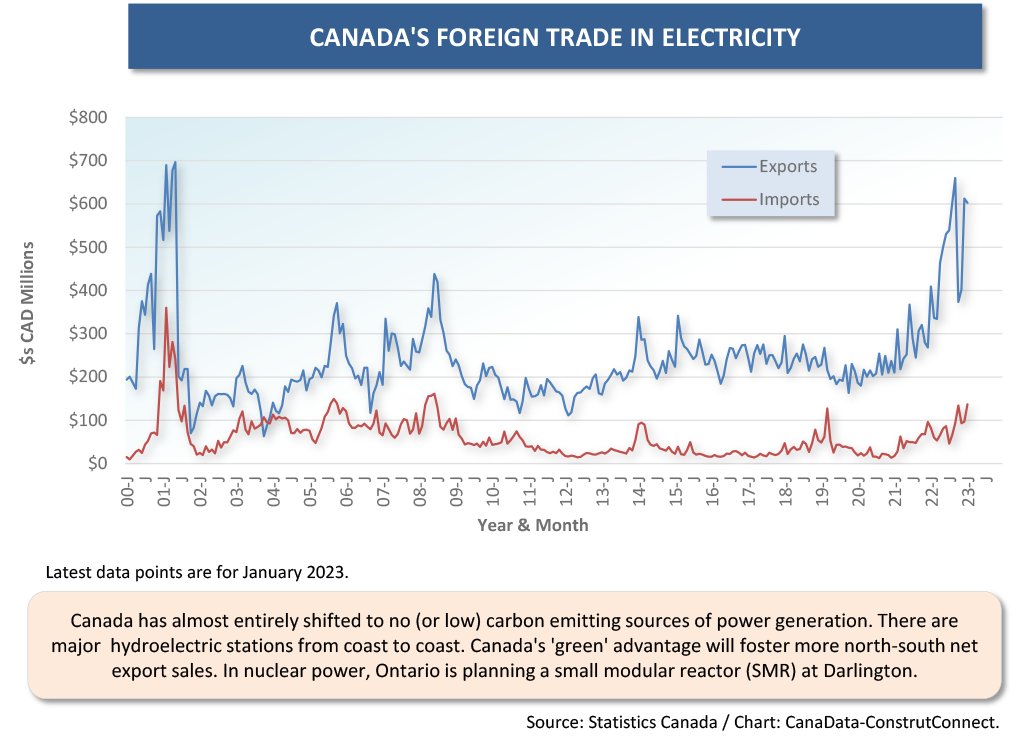
Electricity
Concerning the world of tomorrow, Canada is well positioned among industrialized nations in already having an electric power base that is almost exclusively renewable, thanks to tapping rivers for hydro stations, plus nuclear units in Ontario. (France, with nuclear, and Spain, with wind farms, are also solidly positioned in renewable power generation.) Some Canadian utilities are earning good revenue flows from sending electricity along transmission lines south to U.S. customers. One of 2022’s U.S. mega-sized project starts was an underground cable linking Quebec and New York.
There’s no doubt, though, that more power capacity will be needed. Quebec’s Premier, Francois Legault, has floated the idea of creating more reservoirs for power generation in the north of his province. Mr. Legault probably also has in mind his hopes for the building of a hydrogen plant in Montreal. Hydrogen plucked from water by means of ‘clean’ electrolysis is the best way to ensure no negative environmental impact.
Ontario Power Generation (OPG), in partnership with GE Hitachi, SNC-Lavalin, and Aecon, has committed to building North America’s first small modular (SMR) reactor in Darlington east of Toronto, where there are existing large-scale nuclear units.
Graph 5
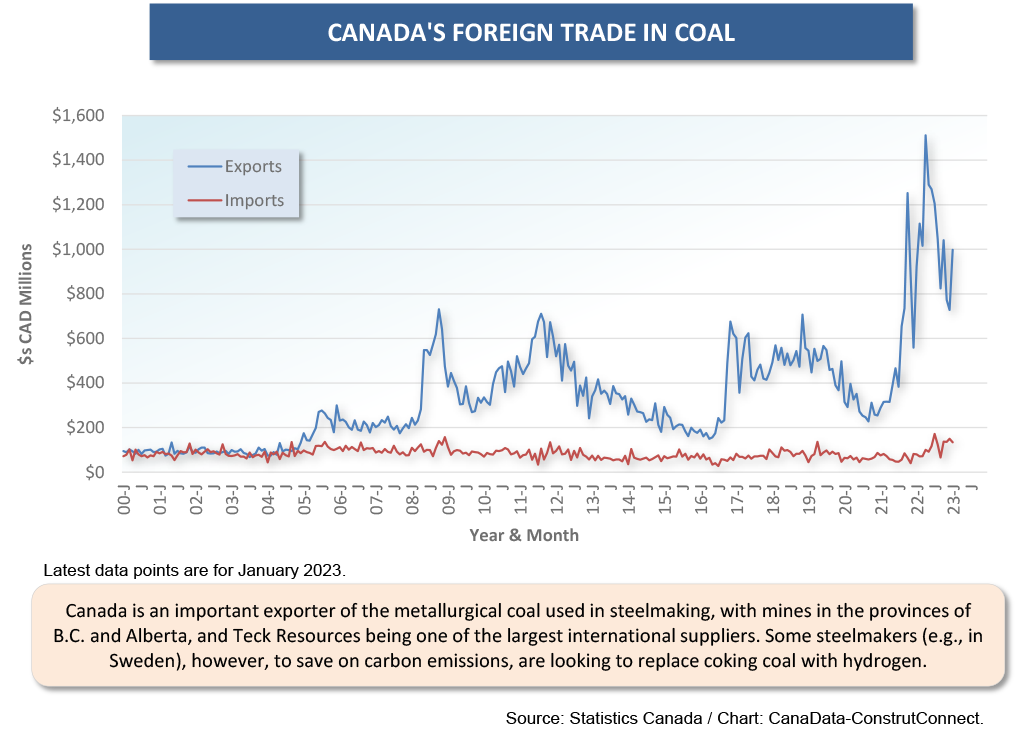
Coal
In Europe, waning demand for thermal coal was already reversing before the Russian advance in Ukraine, and the severing of gas supplies to Germany and other nations. Thermal coal is used to heat water to create steam for the turning of turbines in power generation. Canadian thermal coal is still being exported east to Europe and west to China.
The usage of metallurgical or coking coal in steelmaking is the main source of that industry’s carbon emissions. Canada does export ‘met’ coal and the main customer is China. A significant development is underway in Sweden, however. A new steel mill is being constructed that will use hydrogen in the steelmaking process rather than coke. H2 Green Steel, as it is known, is located in Boden, Sweden.
Within the current context of concern for the environment, for a firm to obtain regulatory and environmental approval for a new coal mine in Canada would appear to be nigh on impossible.
Graph 6
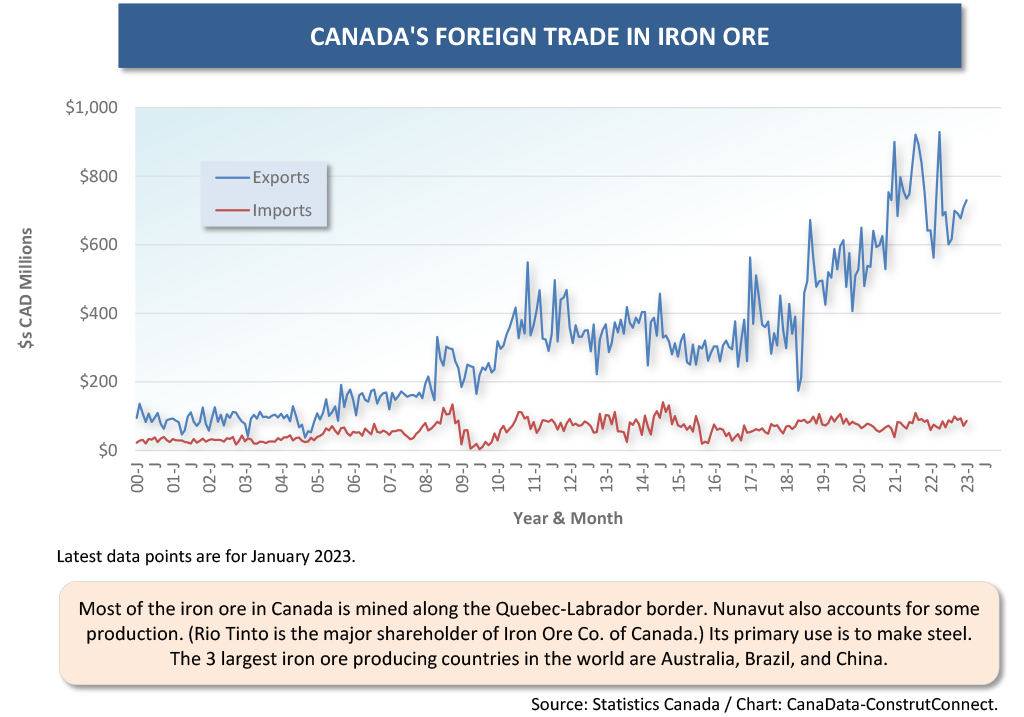
Iron Ore
Iron ore goes into steelmaking and Canada has customers in countries around the world, including Germany, the U.K., U.S., China, and South Korea. (China is the world’s largest steelmaker and it receives the bulk of its iron ore imports from Australia.)
Canada’s major deposits are found along the Quebec-Labrador border. To better access iron ore and other mining properties in Labrador (e.g., the Voisey’s Bay copper, nickel, cobalt vein), the Newfoundland and Labrador provincial government in St. John’s is proposing to build an underwater tunnel from ‘the Rock’ to the mainland, at considerable expense, almost assuredly in the billions of dollars.
Graph 7
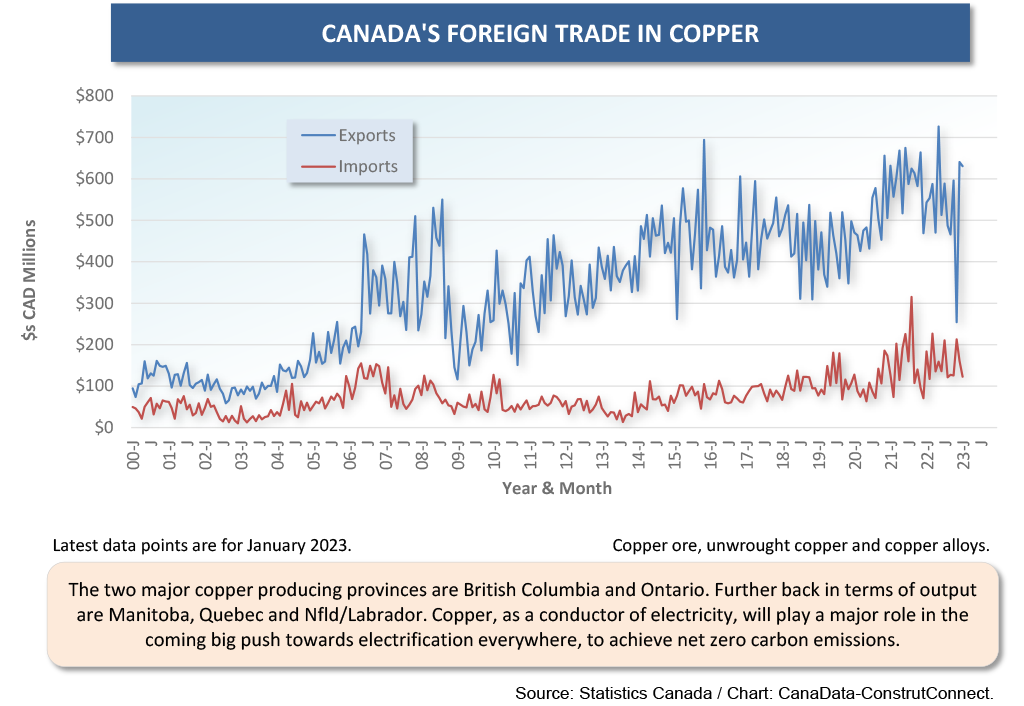
Copper
An old adage says that ‘as goes the price of oil, so goes the value of the Canadian dollar’. More recently you’ll sometimes hear that it’s the price of copper that has a bigger influence on the valuation of the ‘loonie’. Copper and nickel usage is ubiquitous throughout the economy. For both base metals, their importance is about to become even more elevated. In a myriad of instances, copper is the best means to transmit electricity. (Aluminum, being lighter, is used in high-voltage highly-placed transmission lines.)
Experts on commodities markets believe there will soon be a boom cycle for copper similar to what sometimes occurs for oil. Demand is going to skyrocket, but there have been few additions to mining capacity around the world. Chile is the world leader for copper production.
In Canada and the U.S., there’s a contradiction that will need to be sorted out. Governments are pushing hard for the electrification that will lead to a cleaner world, but they are holding back on approvals for the mining projects that will produce the means to achieve that goal. Under the best of circumstances, it currently takes many years for a mining project to proceed from ‘first stake’ to output.
Graph 8
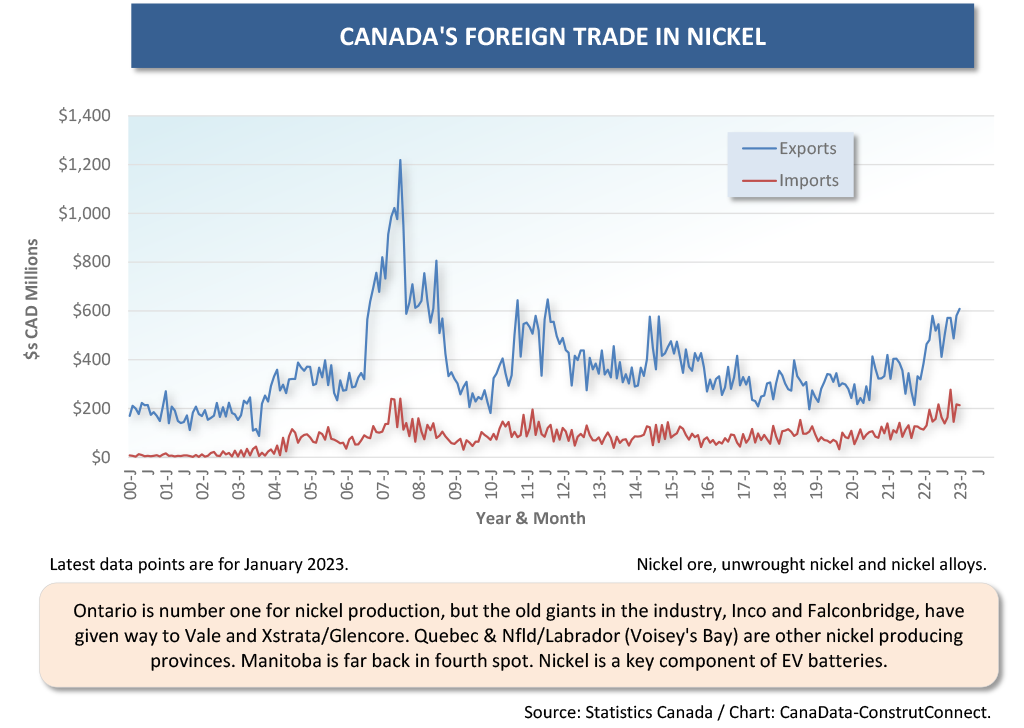
Nickel
The lithium-ion batteries favored in electric vehicles have a heavy weighting of nickel in their nickel-manganese-cobalt (NMC) or nickel-cobalt-aluminum (NCA) cathodes. To illustrate the significance of this new role to be played by nickel, consider that Indonesia, the world’s largest source of the metal, has banned its export on the grounds that a greater contribution to the economy can be made by processing it further beyond its raw state.
Mentioning lithium brings to mind contemplated projects to extract the metal in Ontario and Quebec. There’s a ‘lithium triangle’ where the borders of Chile, Argentina and Bolivia meet that is judged to hold the world’s largest reserve.
Graph 9
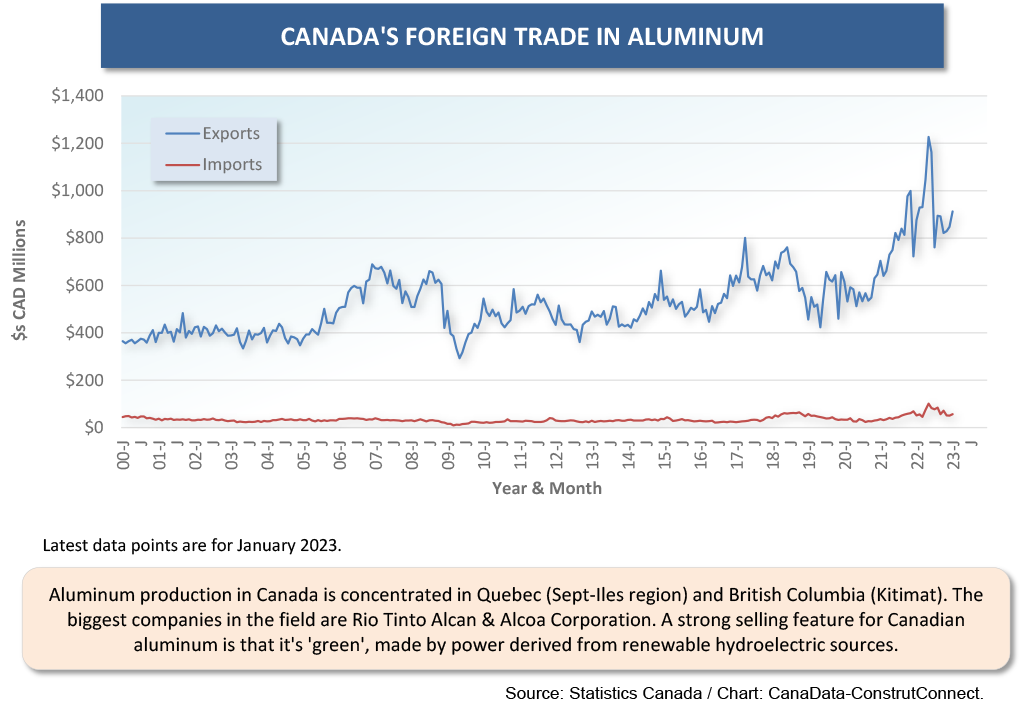
Aluminum
The heftiest component of aluminum’s production cost is electricity. Internationally, Canada and Russia are the two countries seen as having the ‘greenest’ aluminum production facilities, because they make use of renewable hydroelectric power.
In the U.S., the administration has identified aluminum as a key strategic industry where domestic production has, regrettably, been allowed to lapse. There are plans afoot to reverse that adverse situation, but it will be difficult to achieve a ‘clean’ result, given that the U.S. power system is still so heavily dependent on fossil fuels.
Graph 10
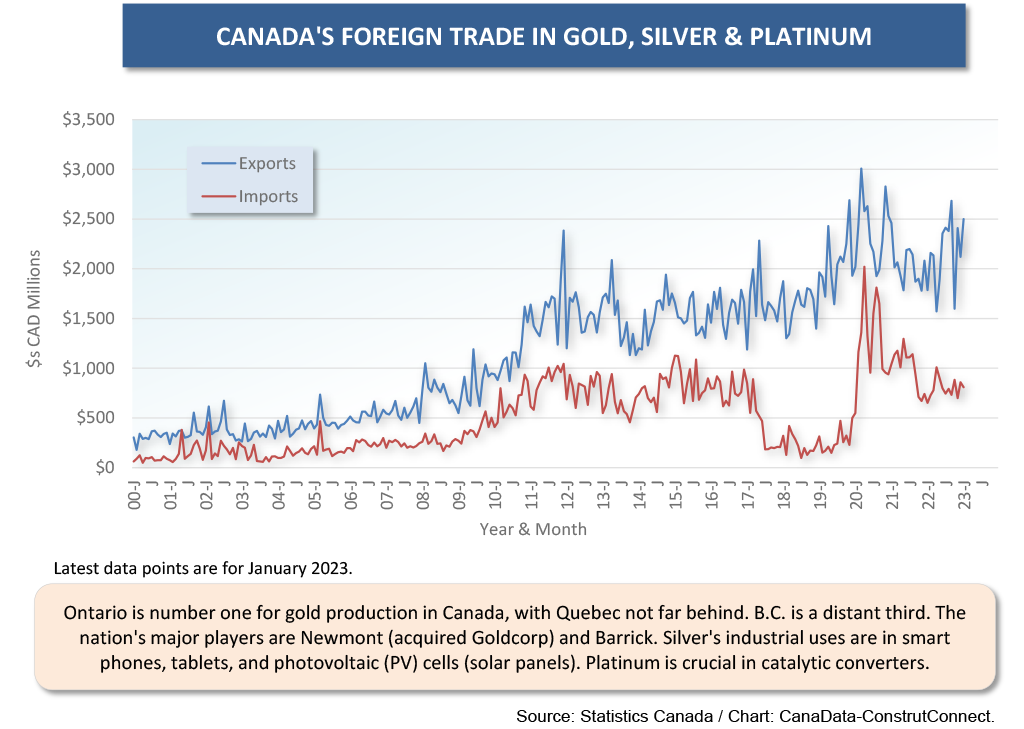
Gold, Silver, Platinum
Gold has always been viewed as a hedge against geopolitical turmoil and inflation. Its industrial uses are minimal. Not so with silver, which is a key component in all electronic devices. Silver is an especially efficient conductor of electricity. It’s found in all cell phones and tablets. And it’s also a key component in the photovoltaic cells (PVCs) that comprise solar panels. The potential for solar panel sales growth is nearly unlimited.
Platinum is an essential ingredient in the catalytic converters that lower motor vehicle carbon emissions. Capital spending on more precious metals extraction in Canada is assured.
Graph 11
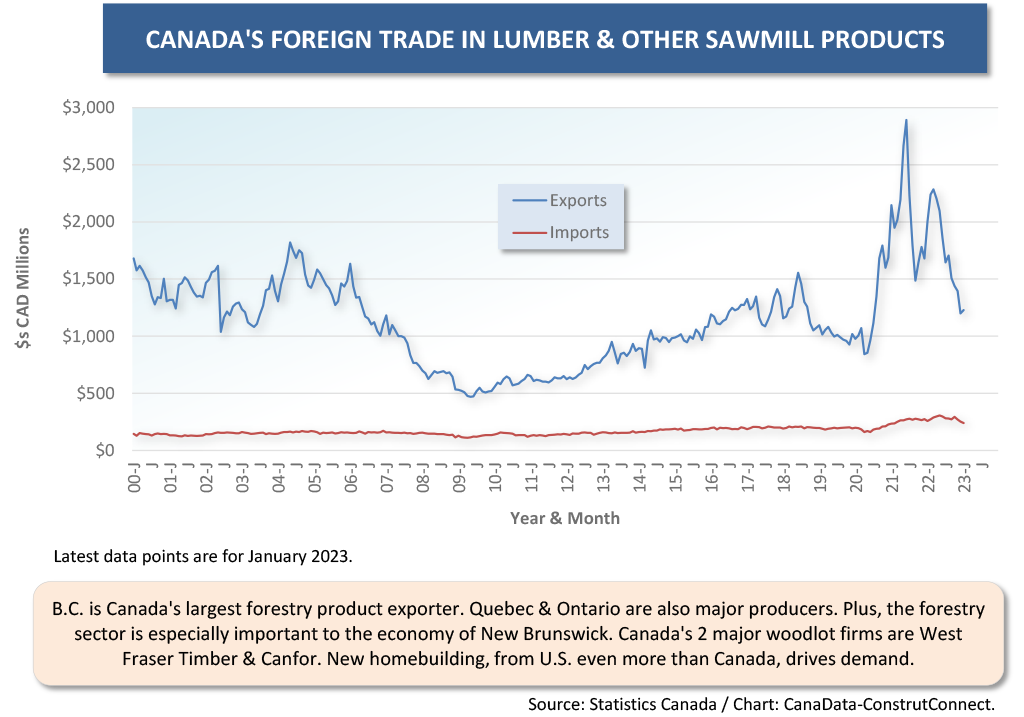
Lumber
When U.S. housing starts are booming, the Canadian lumber sector will be thriving. This will be despite efforts by the U.S. wood industry to beat back Canadian imports. The Softwood Lumber Agreement has expired and there’s been a resumption of dumping charges by American producers. Canadian forestry firms have fought back by buying more timber lots in the U.S. There’s a rule of thumb that stipulates only 70% of U.S. lumber demand for housing, when ‘starts’ climb to 1.6 million units or more annually, can be met from U.S. sawmills alone.
Short- and long-term impediments, respectively, to expansions in Canada are the retreat in U.S. and Canadian housing starts brought on by mortgage rate increases, and the hassle of the never-ending legal battle to maintain access to the U.S. new homes marketplace. Also, there have been supply challenges in B.C. arising from insect infestations (i.e., the mountain pine beetle outbreak) and protests over the logging of old growth forests.
Graph 12
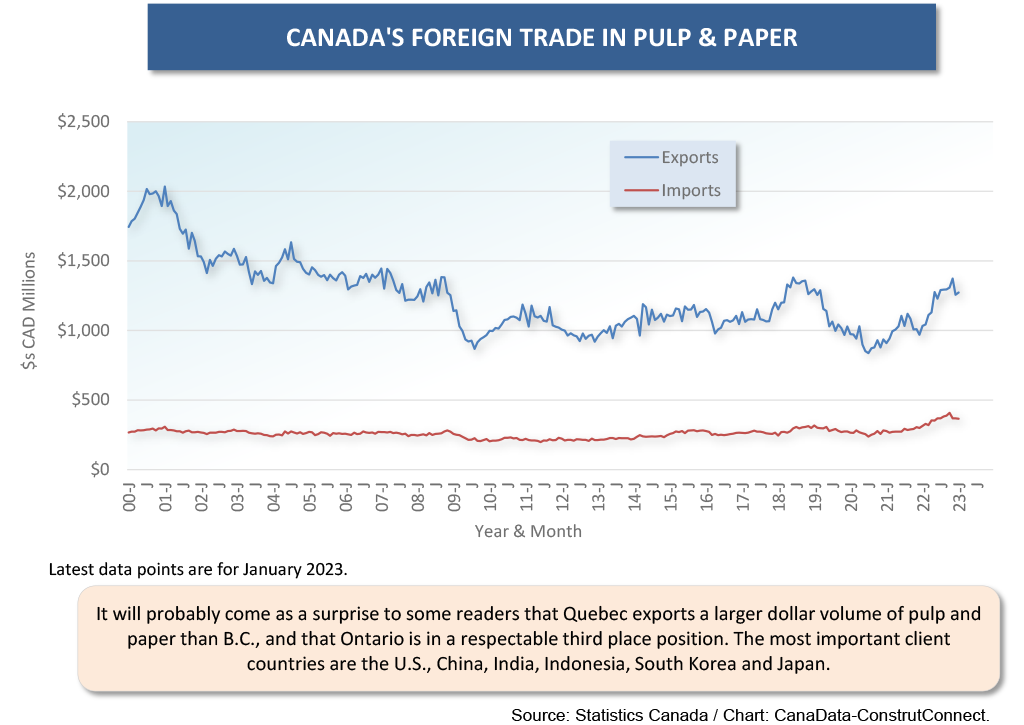
Pulp and Paper
With digital messaging and record keeping, the world has moved away from the kind of concentrated paper usage that existed in the past. Still, it’s telling, that in the crux of the pandemic, book publishers encountered a severe shortage of the product on which to lay out their text. Not all book lovers are Kindle readers. Authors became deeply frustrated by the delays that occurred in seeing their works in print.
Canada’s main export customers are in the U.S. and India. Also, remember that there was a severe shortage of toilet paper (a key subset of Canada’s paper exports) in the early going of the pandemic. It would seem there is potential in the expansion of pulp and paper production capacity.
Graph 13
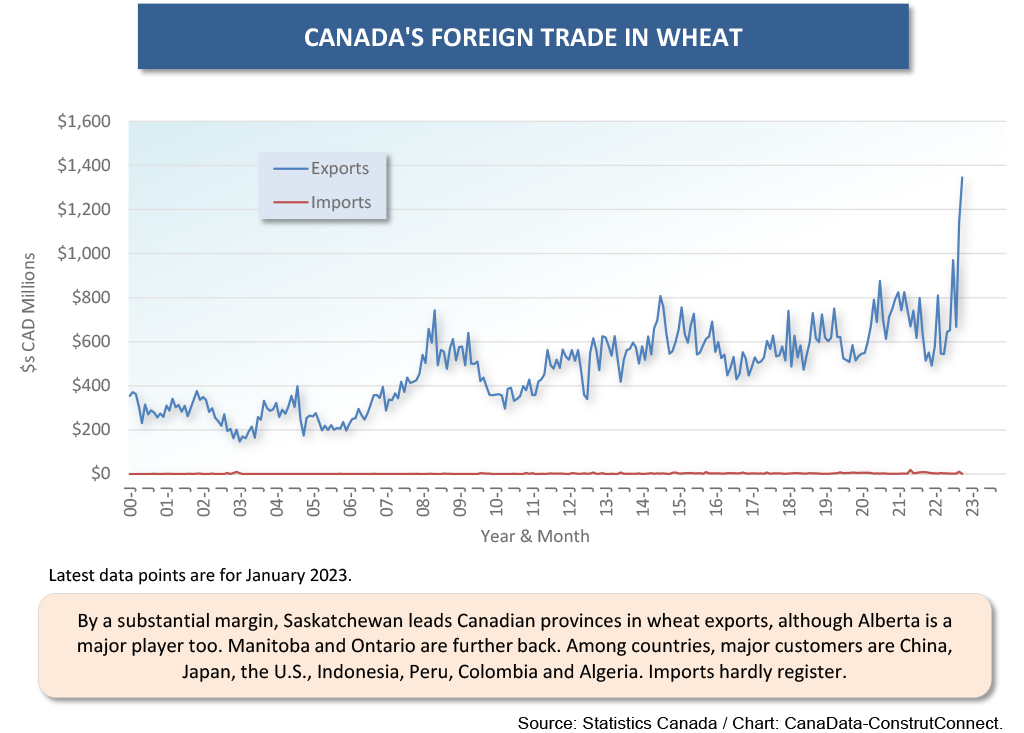
Wheat
Groceries flying off store shelves in the early stages of the stay-at-home and hunker-down pandemic was one of the incipient causes of the inflationary price surge that is still bucking and kicking. Quickly piling on, though, was the fighting in Ukraine that halted shipments of wheat and other grains to many countries, driving up the cost of pasta and baked goods.
As Graph 14 illustrates, Canadian wheat exports have helped fill the global supply gap. Canada’s ongoing, and accumulating, strength in wheat exports inserts urgency into CN and CP rail track maintenance and expansion plans. (On a north-south axis, CP has just been approved by U.S. regulators to buy Kansas City Southern Railway.)
Graph 14
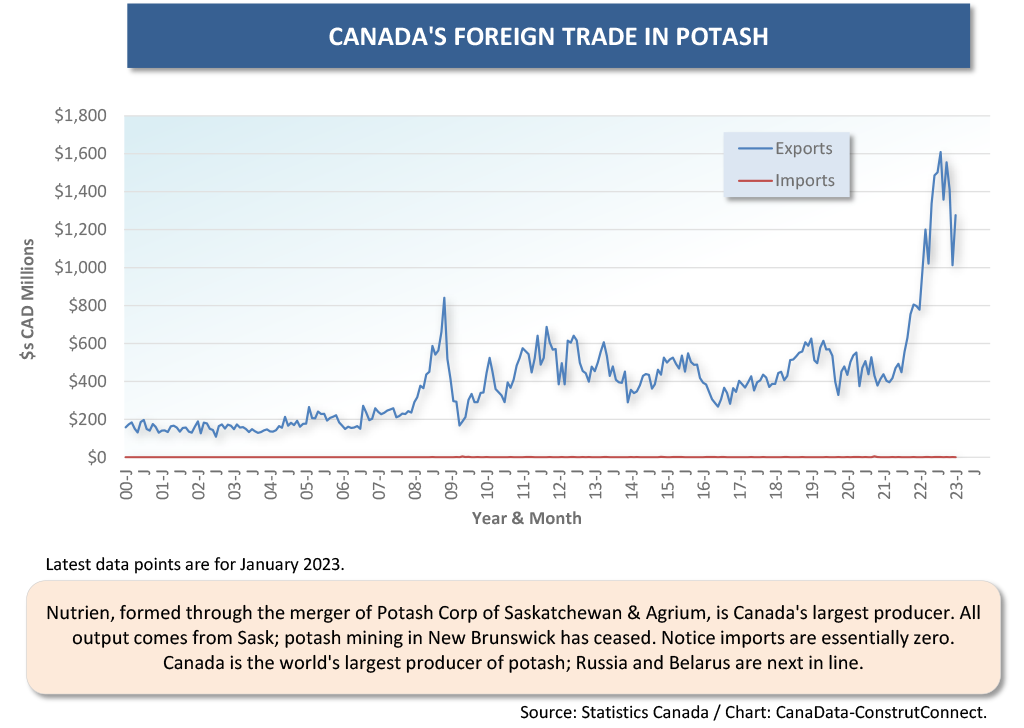
Potash
The province of Saskatchewan is the world’s number one source of potash, a fertilizer used in agriculture. Russia is in second spot. Its actions in Ukraine, however, have alienated much of the world and it has been having trouble finding customers. Going even further, some nations have placed sanctions on the importation of potash from Russia.
The latest big potash mining project begun in Saskatchewan was the $7.5 billion Jansen mine for BHP Billiton. There are more big projects on the drawing boards, at least one of them having the full backing of Indigenous groups.
Graph 15
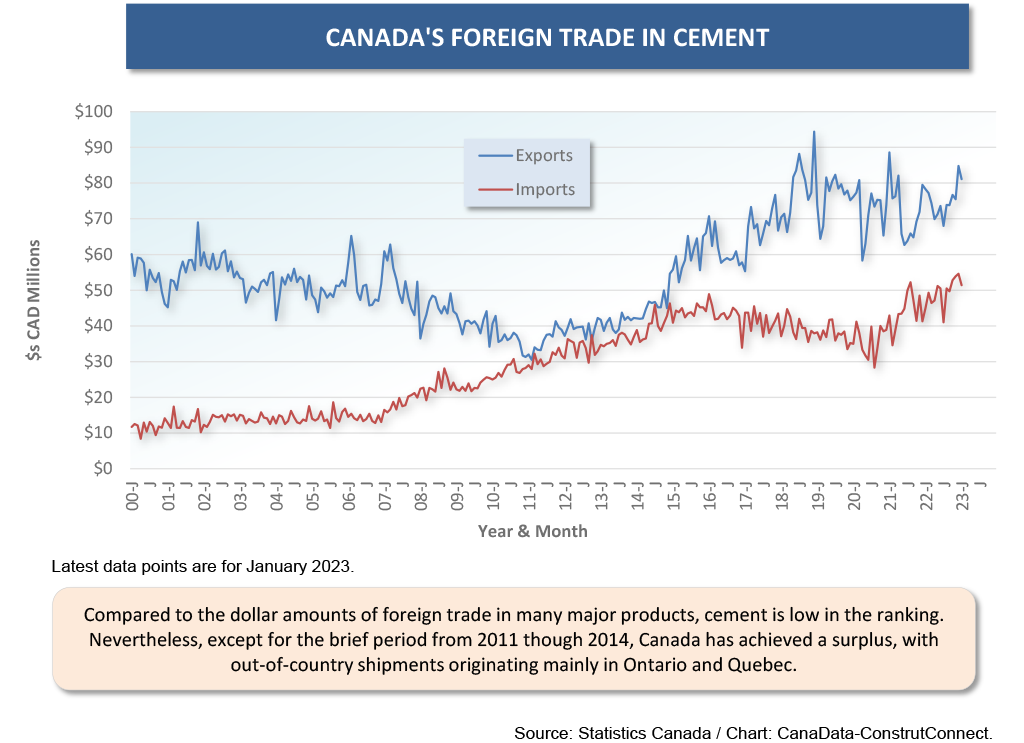
Cement
Canada’s cement exports are speeding down the U.S. infrastructure spending express lane. Uncharacteristically, the prices of cement and ready-mix concrete have moved up dramatically and become sticky, at least temporarily, at those positions.
The industry is being assaulted be extra costs on all sides. Aggregate has become less easy to acquire and citizens’ groups generally don’t want new gravel pits in their neighborhoods. Truck drivers are demanding better compensation and workplace safety and other rules. The price of diesel fuel has bounced around unpredictably, at one point increasing alarmingly. Finally, cement manufacturers understand that they must divert massive amounts of capital into measures to scrub their atmospheric emissions.
Graph 16
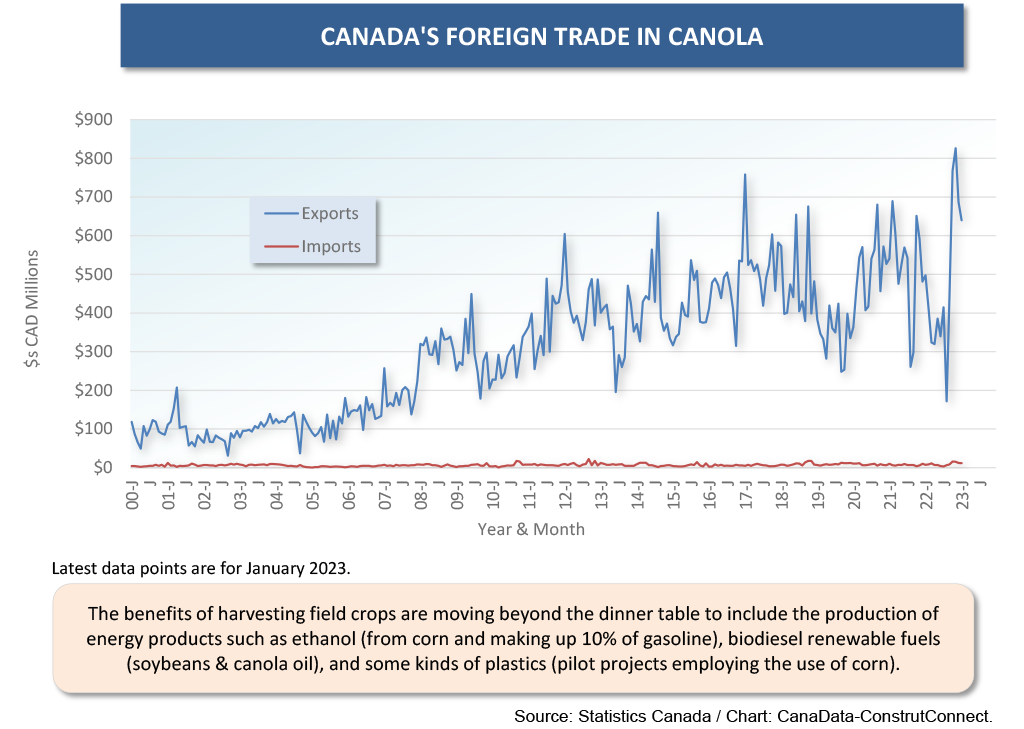
Field Crops
In the search for fossil fuel substitutes, there are certain field crops that lend themselves to all sorts of possibilities. Much of corn production is now going into the ethanol that makes up 10% of the gasoline mix available at station pumps. Sticking with the same crop, Cargill has a pilot project underway in Iowa to substitute corn for natural gas and oil in some kinds of plastic production.
Chemists know that the oil from soybeans and canola can be used to make low carbon biodiesel fuel. In the U.S., Corteva Agriscience, Bunge and Chevron have formed a joint venture to further explore possibilities. Canadian farmers will surely be pleased about the opportunities opening up for alternative sources of income.
Graph 17
Alex Carrick is Chief Economist for ConstructConnect. He has delivered presentations throughout North America on the U.S., Canadian and world construction outlooks. Mr. Carrick has been with the company since 1985. Links to his numerous articles are featured on Twitter @ConstructConnx, which has 50,000 followers.


Recent Comments