Forecaster Charts & Tables
Retail Sales
Retail is shifting from ‘bricks and mortar’ stores to warehouse construction in support of online platforms.
Total Retail Sales in Canada
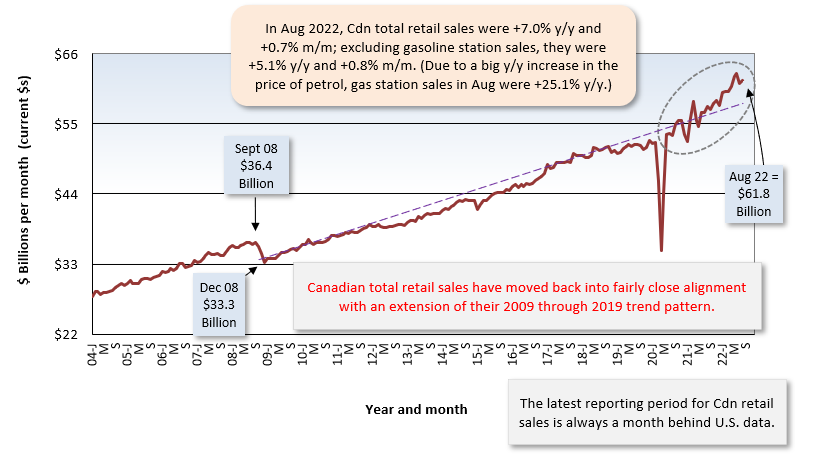
Data source: Statistics Canada Table 20-10-0078-01/Chart: ConstructConnect — CanaData.
Canadian Retail Sales Y/Y
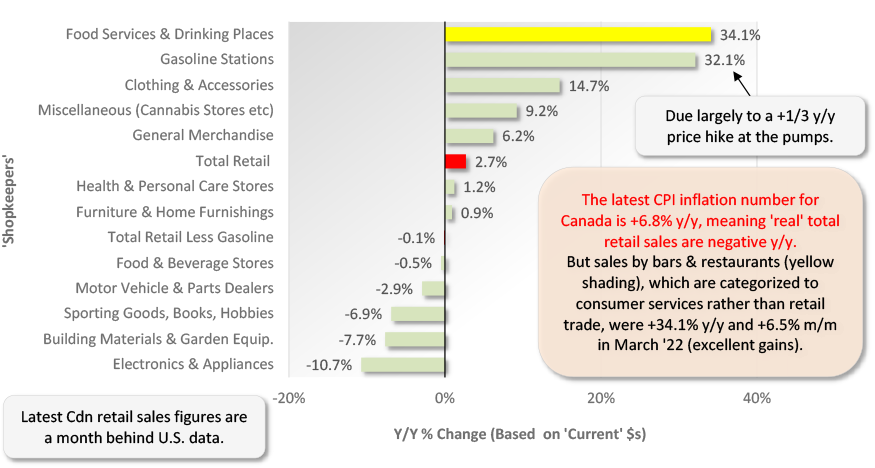
For March 2022.
‘Current dollars’ means not adjusted for inflation. Underlying numbers are seasonally adjusted & not ‘smoothed’.
Data source: Statistics Canada / Chart: ConstructConnect-CanaData.
Canadian Home-Related Retail Sales
Latest data points are for June, 2021.
*”Year over year” is each month versus the same month of the previous year.
‘Based on ‘current’ (i.e., no accouting for inflation) dollar and seasonally adjusted data.
Data source: Statistics Canada / Chart: ConstructConnect-CanaData.
Retail Sales - Canada, Provinces & Cities
September 2021 Year-over-Year (Y/Y) & Shares
Based on ‘current’ dollars (i.e., not altered for inflation) that have been seasonally adjusted.
Data source: Statistics Canada / Chart: ConstructConnect-CanaData.
Recent Comments
comments for this post are closed