Is there relevance for construction in foreign trade? The answer is an emphatic ‘Yes!’ and, in a nutshell, it can hardly be overstated. Some of the impacts are overt; others are subtle.
In the first category, and especially important for Canada, are exports of raw materials. Owners in the resource sector undertake capital expansions when prices and demand for the goods (oil, natural gas, gold, copper) they extract are healthy and there is a good possibility of further strengthening. Such projects to expand output often become ‘mega’ sized with ripple effects that disperse widely throughout the economy.
It’s not just petrochemical plants and mill buildings that are of benefit to construction. There’s also the infrastructure – i.e., pipelines, railroad track, river and coastal shipping lanes − required to carry energy products, wheat, soybeans, potash, coal and uranium to non-domestic markets.
The U.S. also has a major stake in this game, as it moves agricultural product, base and precious metals and liquefied natural gas (LNG) around the world. But where the U.S. has always excelled has been in its sales of manufactured goods to willing customers in other countries, with certain name brands (e.g., John Deere, Caterpillar, Coca Cola, Pepsi) known everywhere.
Embedded in highway, bridge, harbor and airport construction is not only the need to move goods and people efficiently at home, but also to deliver access to buyers elsewhere. Tourism and business travel, with hotel construction implications, enter the trade statistics on the ‘services’ side of the ledger.
There’s another aspect of foreign trade that must always be kept in mind. Net exports (i.e., exports minus imports) is a line item in the calculation of gross domestic product (GDP). When net exports are positive, they contribute to GDP’s summation. When they are negative, they take away from the GDP national output figure.
Both the U.S. and Canada are currently experiencing negative ‘net exports’. As a result, the goal of achieving full potential GDP remains elusive.
The following 5 graphs depict the highlights from the latest (January 2019) U.S. and Canadian trade statistics.
U.S. Goods and Services Trade Balance:
In January, the U.S. ‘goods and services’ trade shortfall improved to -$614 billion USD, seasonally adjusted (SA) and annualized, from -$719 billion in December. On a month-to-month basis, exports in January were +9.0%, while imports were -2.6%.
The -$614 billion deficit overall resulted from a -$880 billion gap in ‘goods’ trade, that was rescued somewhat by a +$265 billion surplus in ‘services’ trade.
Graph 1: United States’ Foreign Trade: Goods and Services Balance − January 2019
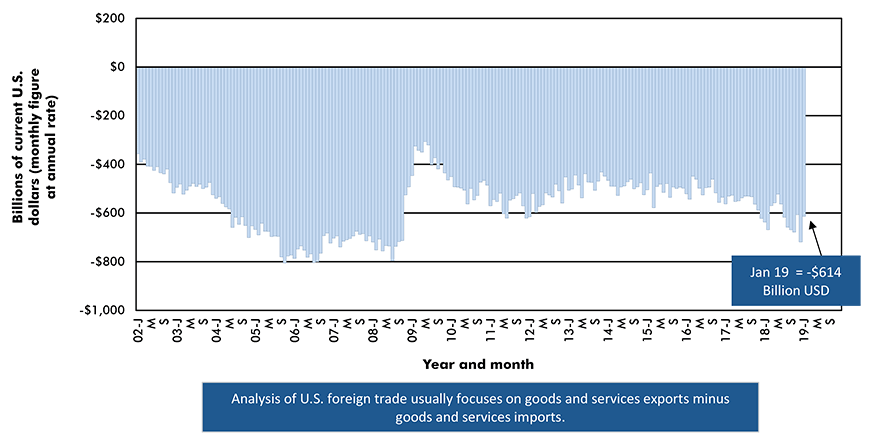
The last data point is for January 2019.
Based on seasonally adjusted monthly figures, projected at an annual rate.
Data source: Bureau of Economic Analysis (BEA).
Chart: ConstructConnect.
Foreign Sources of U.S. Trade Deficit:
In December, trade with China had accounted for more than 50% of the U.S. worldwide trade deficit. In January, China’s share fell to 46%. The Euro Area, at 15%, was the second major source of America’s trade weakness, followed by Mexico (8%) and Japan (7%). As for the ‘rest of the world’, there were minor discrepancies with numerous other countries, but four stood out from the pack − South Korea, Taiwan, India and Malaysia.
Graph 2: Geographic Sources of Total U.S. Foreign Trade Deficit in Goods − January 2019
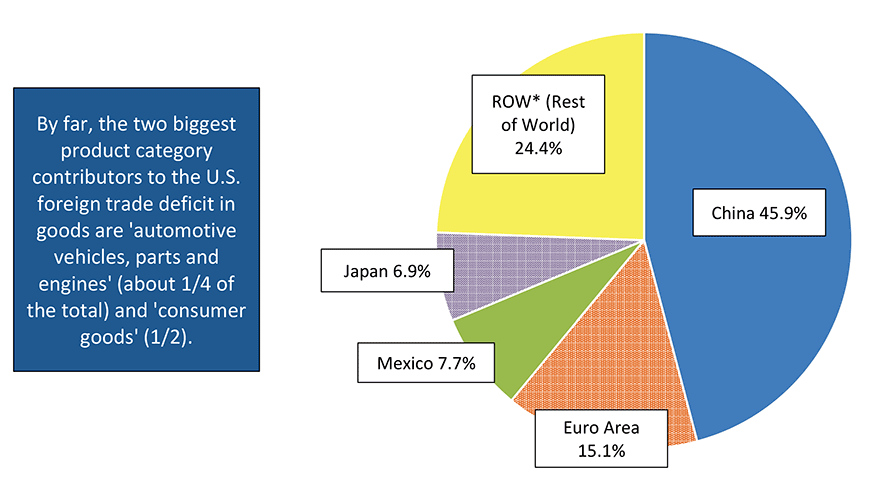
*Major contributors to ROW deficit are South Korea, Taiwan, India and Malaysia.
Data source: U.S. Census Bueau and Bureau of Economic Analysis (BEA).
Chart: ConstructConnect.
Foreign Sources of U.S. Oil Imports:
In January, Canada supplied more than half of U.S. total oil imports. To obtain even more Canadian crude, Donald Trump has signed another executive order − i.e., his previous ‘missive’ on the matter was one of the first actions he took as President − authorizing initiation of work on the Keystone XL pipeline expansion. The project will still face many legal challenges at the local level, with litigants warning of the risks to water quality.
Despite large exports of crude oil to the U.S., Canada’s share of its southern neighbor’s total trade deficit in January was a miniscule 1%.
Graph 3: Foreign Sources of U.S. Imported Oil
% of Total Barrels Year to Date − January 2019
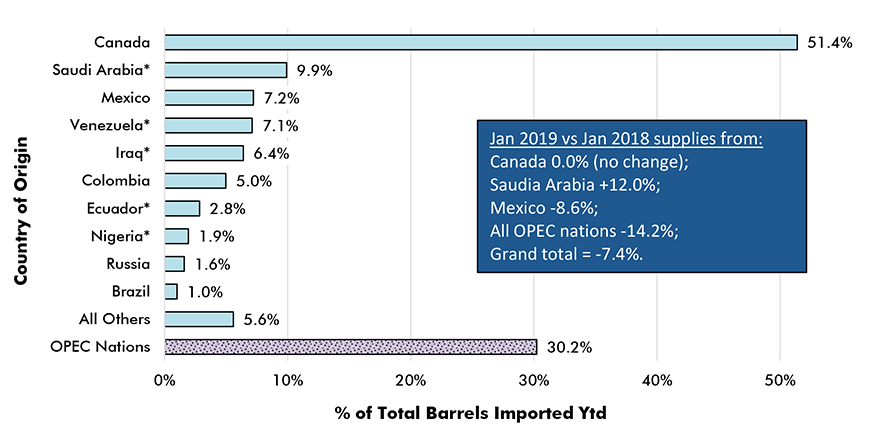
* Asterisk indicates the country is an OPEC member.
Data source: Census Bureau & Bureau of Economic Analysis (BEA)
Chart: ConstructConnect.
Canada’s Merchandise Trade Balance:
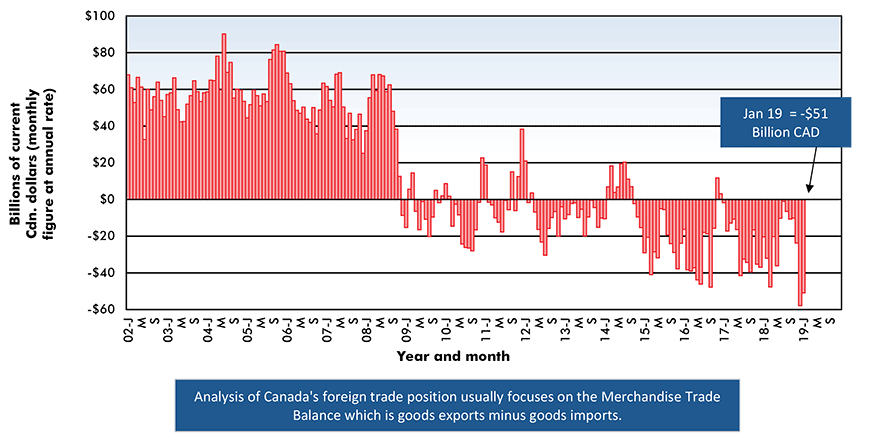
Before the recession, Canada consistently chalked up a sizable ‘goods’ trade surplus. Since the 2008-09 downturn, there have been many more months of negatives than positives on the Canadian trade front. The imbalance has become starker since the downturn in global commodity markets which was brought on by a big drop in the price of oil in the summer of 2014.
In January, Canada’s three major customers for its exports were: the U.S., 72%; China, 5%; the United Kingdom, 4%; and Japan, 2%. Its four major sources of imports were: U.S., 63%; China, 8%; Mexico, 3%; and Germany, also 3%.
Graph 4: Canada’s Foreign Trade: The Merchandise Trade Balance − January 2019
The last data point is for January 2019.
Based on seasonally adjusted monthly figures, projected at an annual rate.
Data source: Statistics Canada.
Chart: ConstructConnect.
Performances of Key Provincial Export Products:
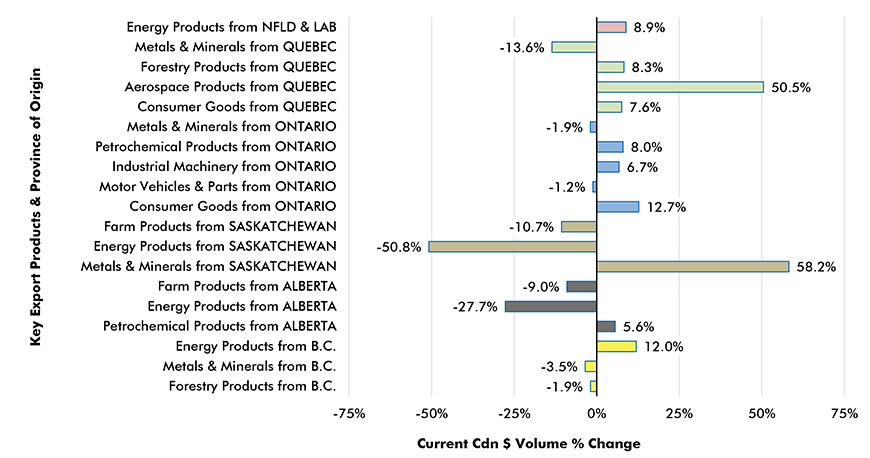
With the results from only the first month of 2019 being available, it’s too early to draw any conclusions about trends for this year. Nevertheless, it’s encouraging to see the early surge in export sales of aerospace products from Quebec, +51%, and metals and mineral products from Saskatchewan, +58%. Saskatchewan is Canada’s leading provider of uranium and potash.
Graph 5: Canada’s Key Export Product Sales by Province Ytd −
January 2019 vs January 2018
Data source: Statistics Canada Table 12-10-0119-01.
Chart: ConstructConnect.



Recent Comments
comments for this post are closed