Explanation of Quarterly and Annual GDP Percent Change Calculations
The mathematics employed to calculate ‘real’ gross domestic product (GDP) levels and rates of change are more convoluted than one might suppose. For a new quarter, GDP line items (e.g., consumption, investment, government spending and exports/imports), after removing the effects of inflation, are added up and adjusted for seasonality. They are also expressed as if they are annual results – i.e., the quarterly figures are ‘blown up’ to a corresponding annual level.
The ‘official’ GDP figure for any year is the average of the levels for the four quarters within that year and the year-to-year growth rate is the percentage change between annual averages.
The figure most often quoted by the press, however, is a quarter-to-quarter GDP growth rate annualized. Such a number compares latest-quarter GDP with previous-quarter GDP to derive a percentage change. Then that percentage change is compounded to the power of four (i.e., ‘annualized’) to account for four quarters in a year.
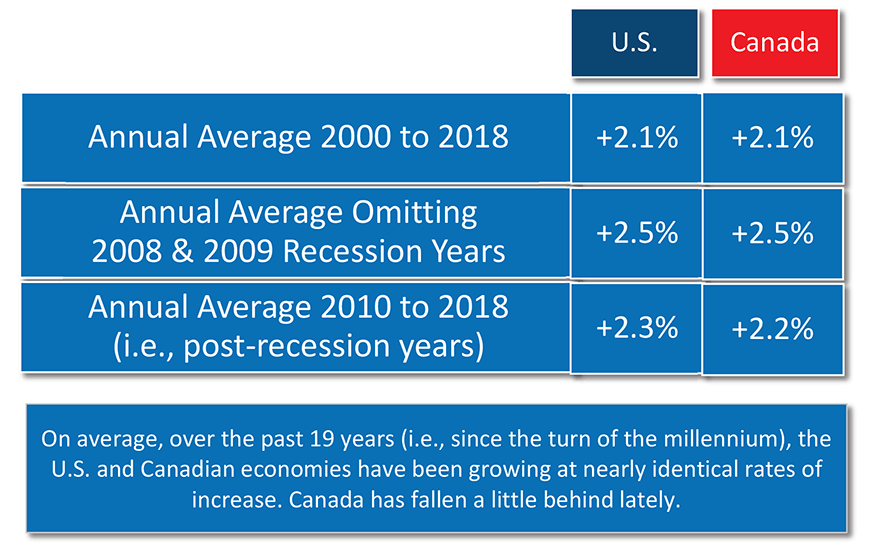
Table: ConstructConnect.
U.S. Annual GDP Growth
Over the past 19 years, since the 20th century gave way to the 21st, U.S. ‘real’ gross domestic product growth has averaged +2.1% annually. Leaving out the two recession years, 2008 and 2009, when the economy contracted, the annual average increase has been +2.5%.
Over the latest nine years, in the post-recession period, the annual rate of U.S. GDP increase has been +2.3%. These numbers all point to a long-term average annual expansion rate of between +2.0% and +2.3%.
Worth noting is that the role played by American consumers in the economy has become increasingly important. Personal consumption expenditures (PCE) in 2000, at 66%, accounted for almost two-thirds of GDP. That proportion has more recently reached 70%.
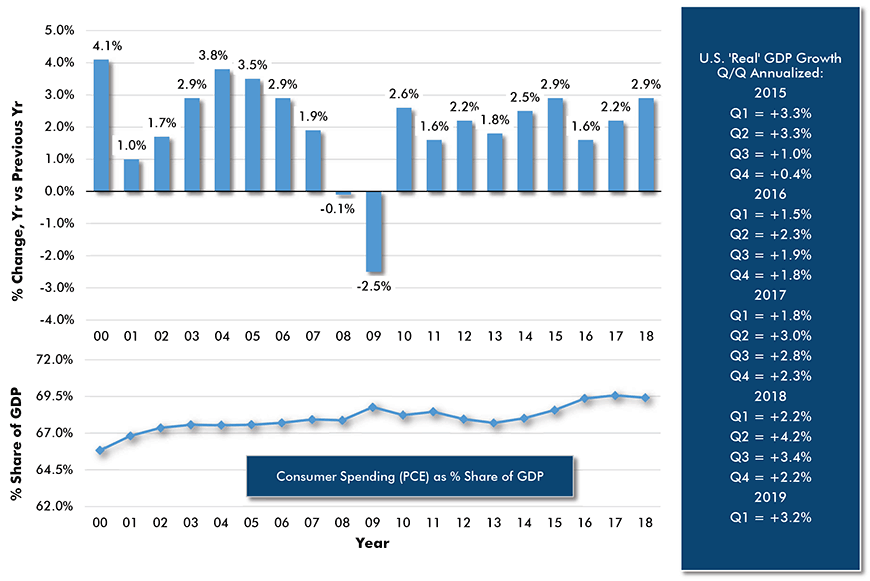
Chart: ConstructConnect.
U.S. Quarter-to-Quarter GDP Growth
If the ‘norm’ for GDP growth is +2.0% to +2.5%, then a quarter-to-quarter annualized gain of +3.0% or more must be considered ‘hot’. Since the recession, there have been 14 quarters during which U.S. GDP growth has exceeded +3.0%.
In three of the last four quarters, U.S. GDP growth has surpassed +3.0%. The +3.2% pace achieved in Q1 of 2019 has been a pleasant surprise. This is especially true given that Q1 has often served up weak results in the post-recession period. From 2010 through 2018, the average annualized growth rate for Q1 was +1.7%.
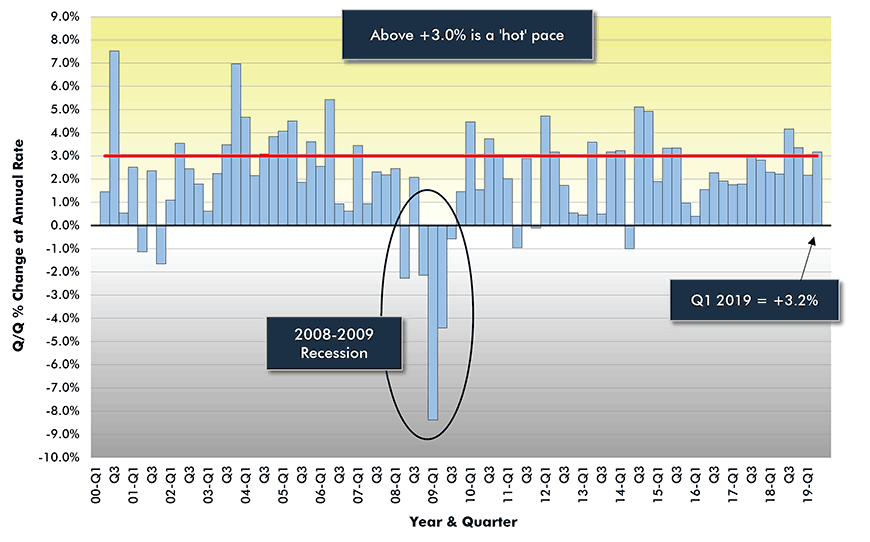
Chart: ConstructConnect.
Canada Annual GDP Growth Rate
Canada’s annual ‘real’ GDP growth rate since the recession, at +2.2%, has been just a bit slower than America’s figure, +2.3%.
As in the U.S., the contribution being made by consumers in Canada to total GDP has been rising steadily, from less than 50% in 2000 to 57% in 2018. The key role played by personal consumption in national output is why so much attention is paid to monthly reports on retail sales.
It’s still the case, though, that consumer spending as a share of GDP in Canada (57%) is considerably less than in the U.S. (70%). The reason is not because Canadians are more hesitant about opening their wallets or purses and going on spending sprees. Rather, it’s due to another component of GDP accounting for a larger slice of the total north of the border than to the south – foreign trade.
In Canada, goods and services export sales as a ratio of GDP are now about one-third. In the U.S., the comparable figure is less than 15%.
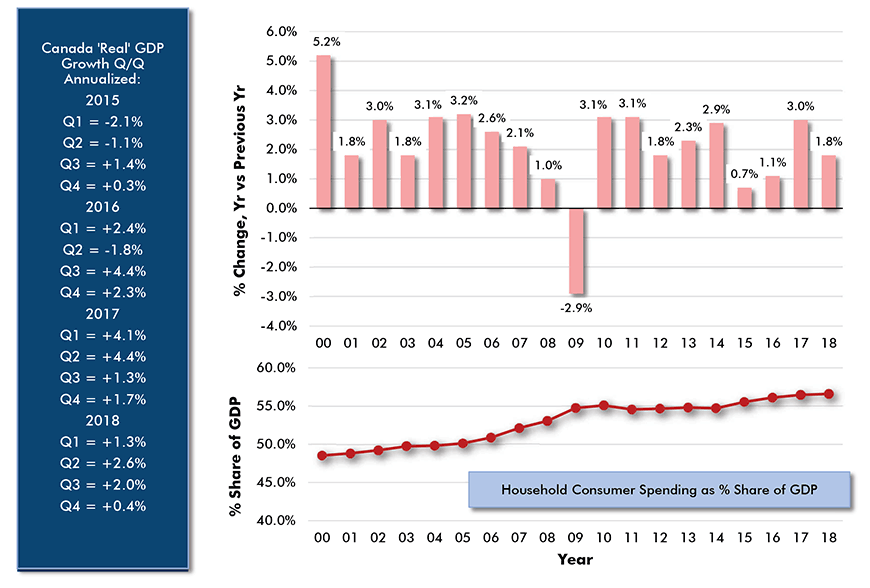
Chart: ConstructConnect.
Canada Quarter-to-Quarter GDP Growth
While the recession in the U.S. extended over six quarters, from Q1 2008 to Q2 2009 inclusive, Canada’s downturn was only half as long, making the economy’s life miserable from Q4 2008 to Q2 2009.
On 13 occasions since the recession, Canadian quarter-to-quarter GDP growth, annualized, has exceeded +3.0%. But it’s now been six quarters since the Canadian economy recorded a strong advance. The latest Canadian GDP data is for Q4 2018 (i.e., a quarter behind the U.S. ‘advance estimate’ for Q1 2019) and the assessed performance was quite weak. In fact, at just +0.4%, there was barely annual forward progress at all in national output.
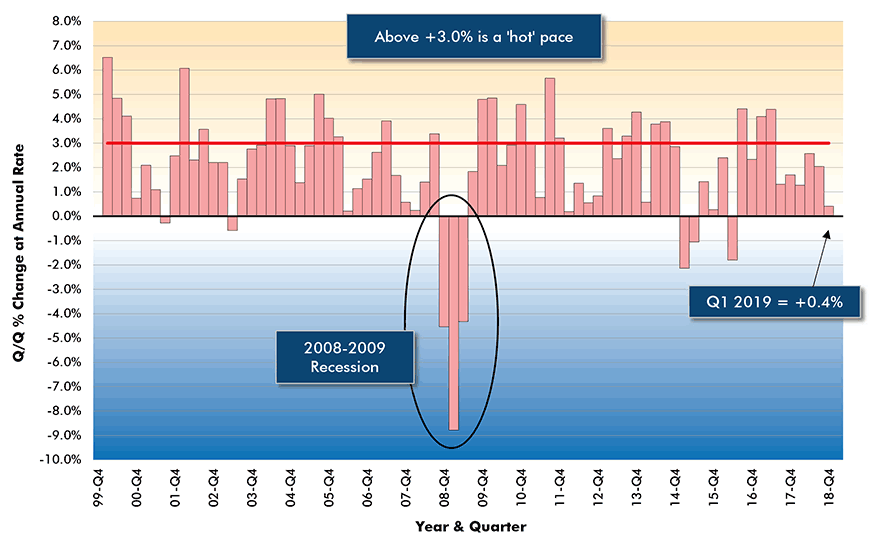
Chart: ConstructConnect.
The Gap Between U.S. and Canadian Q/Q GDP Growth Rates
Graph 5 features the differences in quarter-to-quarter GDP growth rates between the U.S. and Canada. The top and bottom sets of columns are mirror images of one another. For example, if the U.S.-less-Canada GDP rate is +4.0% in a given quarter, the column in the top portion of the chart will show +4.0% (for U.S. minus Canada) and the bottom portion will show -4.0% (for Canada minus U.S.).
Significantly, U.S. Q/Q GDP growth has been beating Canada for the past six quarters in a row. That’s the longest period of dominance by either country in the entire period covered by the graph.
Furthermore, the U.S. winning streak is likely to be extended for a seventh quarter when Canada releases its Q1 2019 results in a month. The initial estimate of America’s Q1 increase is +3.2%.
The early indications for Canada are to be found in month-to-month industry-based GDP figures which were solid in January (+0.3%) but slipped into decline in February (-0.1%). With the dip in the second month of the year, Q1 2019’s GDP growth result for Canada is not likely to be stellar.
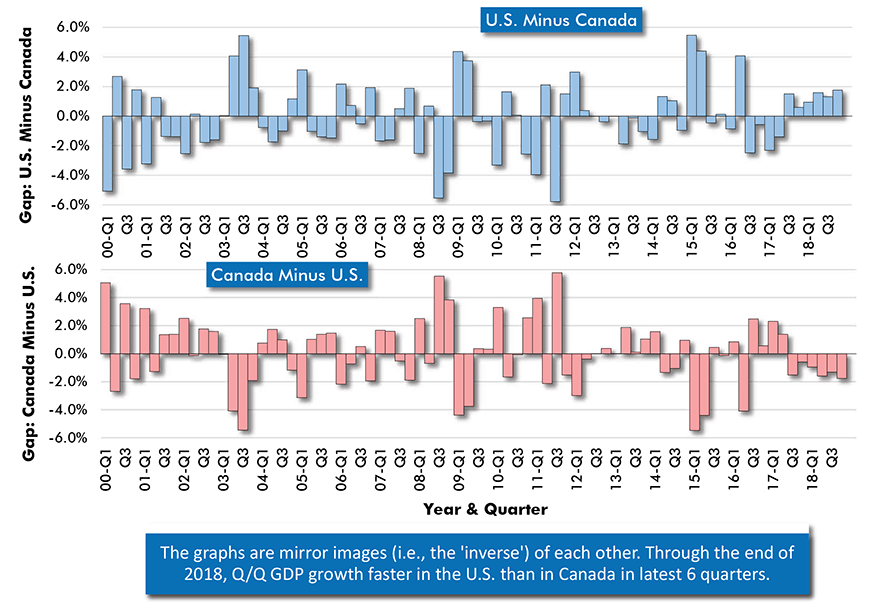
Chart: ConstructConnect.


Recent Comments
comments for this post are closed