
President Trump will be of two minds when he sees the latest labor market numbers from the Bureau of Labor Statistics (BLS). April’s Employment Situation report records another month of exceptional jobs growth, +263,000, and a notable decline in the unemployment rate to only 3.6%, which is as low as that metric has been in half a century. Furthermore, 3.6% was the seasonally adjusted (SA) rate. The not seasonally adjusted (NSA) jobless level was even tighter, at 3.3%.

But the good news with respect to jobs means that there is now even less likelihood that the Chairman of the Federal Reserve, Jerome Powell, will pay heed to the President’s advice to lower interest rates. The needle on the central bank’s ‘yield meter’ has undoubtedly swung away from mildly dovish towards perhaps hawkish once again.
Through the first one-third of 2019, America’s monthly average (net) jobs creation has been +205,000, a quite solid level of increase. But placing it in perspective, it’s still -6.7% compared with January-to-April 2018’s comparable figure of +220,000.
The construction sector in April was aggressive in hiring, with a +33,000 addition to payrolls, and unemployment among ‘hard hat’ workers fell to 4.7% (NSA). A year ago, unemployment among the ‘on-site labor force’ was 6.5%.
Graph 1: U.S. Manufacturing vs Construction Employment
Seasonally Adjusted (SA) Payroll Data
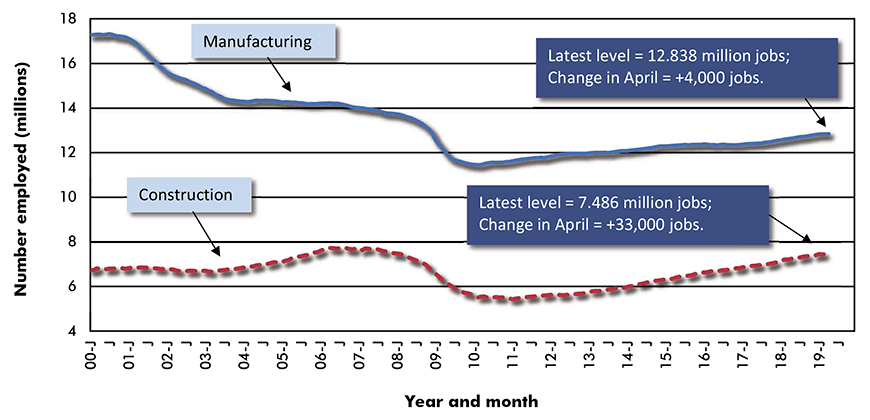
Chart: ConstructConnect.
Employment and Jobs Growth in Industry Sub-Sectors
On a nominal basis, the biggest (net) increases in jobs in April occurred in ‘professional and business services’ (+76,000), followed by ‘education and health services’ (+62,000), ‘leisure and hospitality’ (+34,000) and ‘construction’ (+33,000).
There were also more staff additions with government (+27,000) than in many recent months. The entire increase with the public sector was achieved at the local level, as the jobs gain federally (+11,000) was wiped out by the jobs loss among states (-11,000).
On a year-over-year percentage-change basis, construction (+3.5%) led all sectors in the latest month, with ‘transportation and warehousing’ (+3.3%) in close pursuit. ‘Leisure and hospitality’ (+2.8%), ‘professional and business services’ (+2.6%) and ‘education and health’ (+2.5%) also managed y/y jobs advances that were greater than for the whole economy (+1.8%).
On the flip side, ‘retail trade’ (-0.3%) and ‘information services’ (-0.5%) saw their levels of employment shrink versus April of 2018.
Graph 2: Y/Y Jobs Growth, U.S. Total Industry & Major Subsectors −
April 2019 (based on seasonally adjusted payroll data)
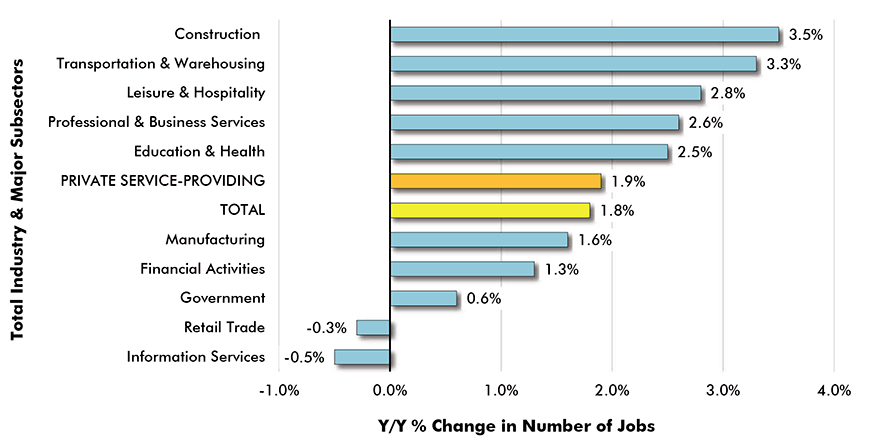
Chart: ConstructConnect.
Hourly and Weekly Wages and Earnings
For all that there’s a surfeit of good news concerning the U.S. employment scene, a baffling mystery remains. The unemployment rate has plunged to a record low, but wages remain subdued.
For all employees in America’s economy in April, year-over-year average hourly earnings were +3.2% and average weekly earnings, +2.9%. For production workers only (i.e., leaving out supervisory personnel), the income hikes were +3.4% hourly and +3.1% weekly. With inflation at +2.0% y/y, workers are barely making earnings headway.
In the construction sector, where a shortage of workers is said to be especially acute, the pay raises in April were even stingier: +3.1% hourly and +2.3% weekly including supervisory personnel (i.e., bosses) and +3.2% hourly and +2.2% weekly excluding supervisory personnel.
Graph 3: Average Weekly Earnings Y/Y – ‘All Jobs’ and Construction
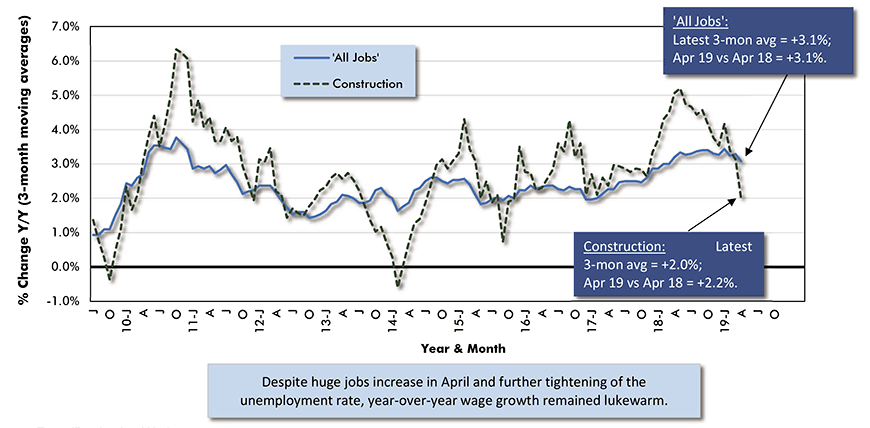
Chart: ConstructConnect.


Recent Comments
comments for this post are closed