Did the Fed Once Again Take its Lead from the Stock Markets?
Coronavirus concerns leading to trip cancellations and postponements are expected to cost the world’s airline industry over $100 billion this year. Travel disruption is also sure to cut mightily into the revenues generated by the hotel/motel accommodation sector.
Consumers are exercising caution in where they gather in crowds. Patronage at restaurants and cinemas is down. Afraid about the possibility of empty theaters, the producers of the new James Bond movie have moved its opening from April to November.
The Federal Reserve on March 3rd, recognizing the threats to the economy, cut its benchmark interest rate by half a percentage point. The drop in the federal funds rate, to a range of 1.00% to 1.25%, was an emergency measure taken outside the timeline of normally scheduled Federal Open Market Committee (FOMC) meetings.
A further reduction in rates is viewed by many financial and investment analysts as likely during the next ‘official’ FOMC meeting on March 17 and 18th. (It’s always the second day of an FOMC meeting, a Wednesday, when rates are discussed and altered, if necessary.)
There’s been speculation that the Fed acted so aggressively to ease credit because it had advance knowledge about an imminent alarming labor market report. Or perhaps, once again, the Fed was reacting to carnage in the stock markets.
As of March 5th’s closing quotations, the Dow Jones Industrial average was -11.7% compared with its 52-week high; the S&P 500 was -10.9%; and NASDAQ, -11.2%. A decline beyond -10.0% is termed a ‘correction’. When the dive exceeds -20.0%, it’s known as a ‘bear’ market.
U.S. Jobs Creation Through February Continued Just Fine!
The latest Employment Situation report (i.e., for February 2020) has just been released, and while a sharp adjustment in jobs creation seems inevitable and soon, it hasn’t happened yet, at least not according to the Bureau of Labor Statistics (BLS).
The BLS is reporting that U.S. employment growth in February was +273,000 jobs and that the seasonally adjusted unemployment rate was 3.5%, which was even a bit tighter than January’s 3.6%.
Jobs creation through the second month of this year continued just fine, thank you.
Graph 1: U.S.: Month-to-month Total Jobs Creation
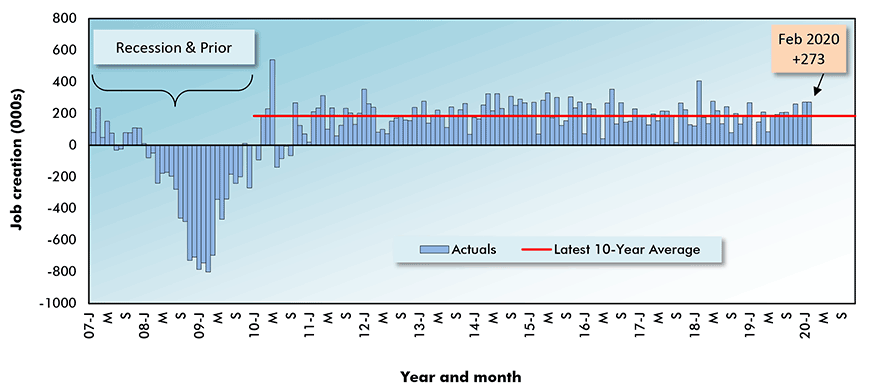
Chart: ConstructConnect.
Construction a Leading Jobs Provider in Latest Month
Among major industrial sub-sectors, there were five that contributed the biggest and almost equal month-to-month jobs advances in February: ‘education and health services’, +54,000; ‘leisure and hospitality’, +51,000; ‘government’, +45,000; ‘professional and business services’, +41,000; and ‘construction’, +42,000.
Construction’s jobs gain was mainly at the sub-trades level, +26,000, and about evenly split between residential and non-residential.
Construction, at +42,000 jobs, did much better than manufacturing, +15,000.
Contractors will also be pleased by the latest month’s decent increase in number of jobs with ‘architectural and engineering services’ firms, +10,000. Healthy activity levels at the design stage of projects are a lead indicator for later good volumes of work on framing and finishing at building sites.
The construction sector’s not seasonally adjusted (NSA) unemployment rate in February 2020, at 5.5%, was an improvement on February 2019’s level of 6.2%. Manufacturing’s unemployment rate in the latest February, at 3.9%, was a deterioration from year-ago February’s 2.9%.
In ‘education and health services’, the +54,000 jobs advance was +31,000 in health care, +25,000 in social assistance and -2,000 in education.
Within ‘leisure and hospitality’, there was a +53,000 climb in jobs at ‘food services and drinking places’. It’s impossible to imagine this degree of strength will be maintained in the current circumstances of heightened infection and health worries.
The outsized increase in government jobs was +8,000 at the federal level, +18,000 with the states and +19,000 with municipalities and counties.
Graph 2: Y/Y Jobs Growth, U.S. Total Industry & Major Subsectors −
February 2020 (based on seasonally adjusted payroll data)
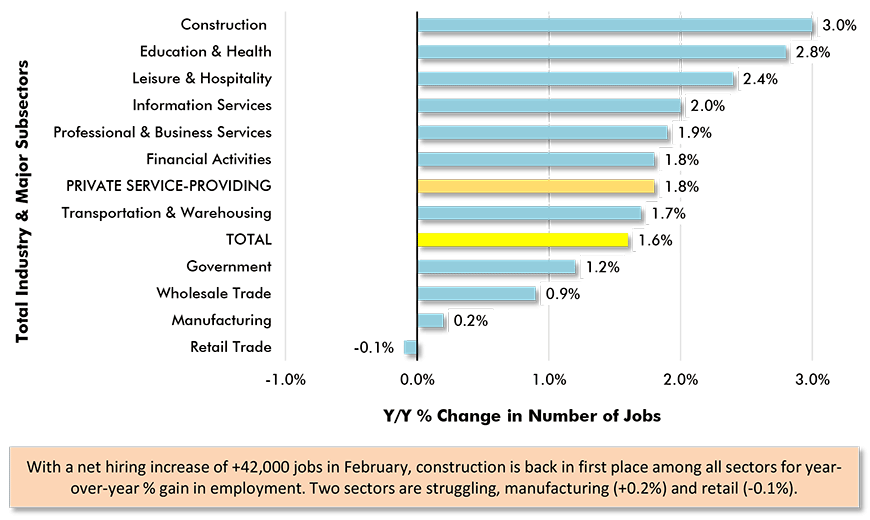
Chart: ConstructConnect.
U.S. Earnings Growth Suddenly More Sprightly
After several months of relatively lackluster earnings growth, U.S. compensation rates shot up again in the latest month. All non-supervisory private sector workers across the economy (i.e., excluding bosses) saw their year-over-year pay checks rise +3.3% hourly and +3.6% weekly.
Among all such workers, the construction contingent was rewarded less handsomely hourly, +2.7%, but made up for the ‘slight’ weekly, +4.0%.
For all workers including bosses, both average hourly and average weekly earnings in February were +3.0% y/y. For construction workers, as a subset, average hourly earnings were also +3.0% y/y, but average weekly earnings were +4.3%.
Graph 3: Average Weekly Earnings Y/Y – ‘All Jobs’ and Construction
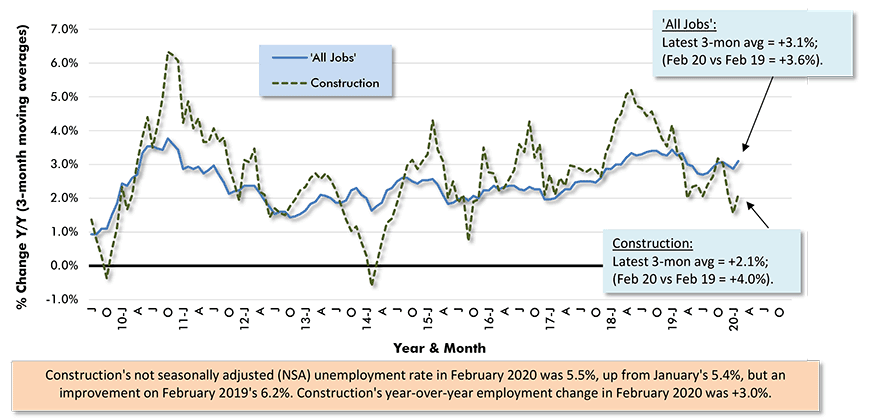
Chart: ConstructConnect.
37,000 more Full-time Jobs in Canada in February
North of the border, according to Statistics Canada, month-to-month employment in February was +30,000, with the seasonally adjusted (SA) jobless rate moving upwards to 5.6% from 5.5% in January.
Full-time jobs in Canada were +37,000. Part-time employment was -7,000. With respect to helping the economy, full-time work is viewed more favorably than part-time work, because it’s usually higher-paying and more stable.
The construction versus manufacturing jobs creation-picture in Canada in the latest month was the opposite of the U.S. Employment in construction north of the border in February contracted by -8,000 jobs. Manufacturers, meanwhile, increased staffing by +16,000.
Among provinces, Ontario continued to shine in jobs creation in February, at +2.3% year over year. Stated more impressively, Ontario has contributed +171,000 out of the +245,000 jobs advance nation-wide (i.e., 70%), year over year.
In unemployment rates provincially, Quebec’s 4.5% is taking the bouquet, followed by Manitoba and B.C., each at 5.0%, and Ontario in fourth spot with 5.5%.
Graph 4: Canada: Month-to-month Total Jobs Creation
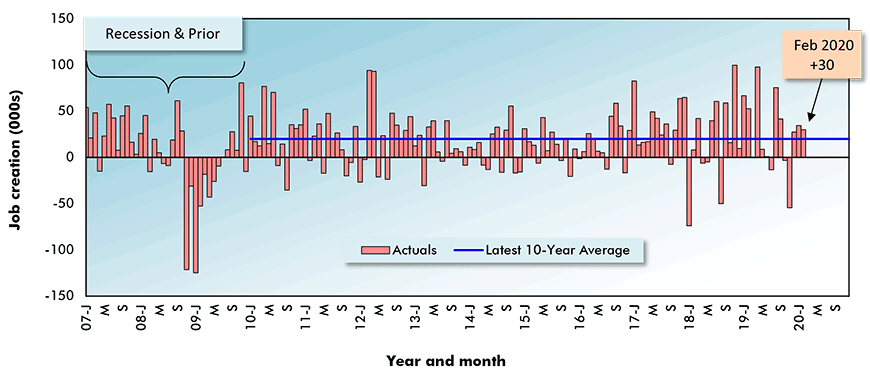
Chart: ConstructConnect.
Alex Carrick is Chief Economist for ConstructConnect. He has delivered presentations throughout North America on the U.S., Canadian and world construction outlooks. Mr. Carrick has been with the company since 1985. Links to his numerous articles are featured on Twitter @ConstructConnx, which has 50,000 followers.


Recent Comments
comments for this post are closed