PIP Stats Ride in the Wake of ‘Starts’
From an overview perspective, the Census Bureau’s put-in-place (PIP) capital spending statistics are providing a misleading picture of what is happening in the construction marketplace. They are too buoyant.
In July, total PIP spending, seasonally adjusted and annualized (in ‘current’, not inflation-adjusted dollars) was +0.1% month over month, with residential at +2.1% and nonresidential, -1.2%.
The month-to-month ‘total’ for June was -0.5% and for May, -1.3%. The worst m/m percentage change for ‘total’ this year occurred in April, at -3.4%, but that was hardly alarming relative to what’s been seen in many other sectors (e.g., ‘retail’, ‘accommodation’ and ‘food services’).
April was also the low m/m point for total’s two sub-sectors, residential at -4.4% and nonresidential at -2.7%.
From Table 1, year-to-date PIP spending is +4.2%, comprised of residential at +6.5% and nonresidential, +2.6%.
The PIP numbers are ‘coincident’ as opposed to ‘leading’ indicators with respect to their timeliness. They are analogous to work-in-progress payments as projects proceed.
They ride in the wake of groundbreakings or ‘starts’. Their current levels include a great deal of onsite work that was initiated a year or more ago. (2019 featured an exceptionally high number of mega projects of $1 billion or more each with long ‘time to completion’ metrics.)
ConstructConnect’s grand total ‘starts’ statistics are currently (through July 2020) -20.4% year to date.
Latest Total PIP Construction Spending – 14.9%
Presently, a more informative way to look at the PIP numbers is to consider the latest three months relative to the previous three months, while also annualizing the percent change (i.e., extending it out for a full year). Such a calculation appears in the column of Table 1 immediately to the left (while facing it) of the check-mark columns.
According to the latest-three-months over prior-three-months calculation, ‘total’ PIP spending is -14.9%, with residential at -24.3% and nonresidential, -7.8%.
Especially telling are the latest-three-months percentage changes for the 16 ‘type of structure’ sub-categories. Among larger volume sub-categories, ‘lodging’ is -16.1%; ‘office’, -5.0%; ‘commercial (retail)’, -4.1%; ‘health care’, -5.9%; ‘educational’, -18.7%; ‘amusement and recreation’, -13.4%; ‘power’, -18.0%; ‘highway and street’, -13.2%; and ‘manufacturing’, -9.5%.
Ten of the 16 sub-categories have latest-three-month percentage changes that are less than latest-twelve-months over previous-twelve-months. In other words, they’re slowing down, often to a considerable degree.
For the five sub-categories where the percentage change is ‘speeding up’, their combined share of the total dollar volume is only 7.0%.
Table 1: U.S. Put-in-place Construction Investment − July 2020
Based on ‘current’ (i.e., not adjusted for inflation) $s, seasonally adjusted at annual rates (SAAR)
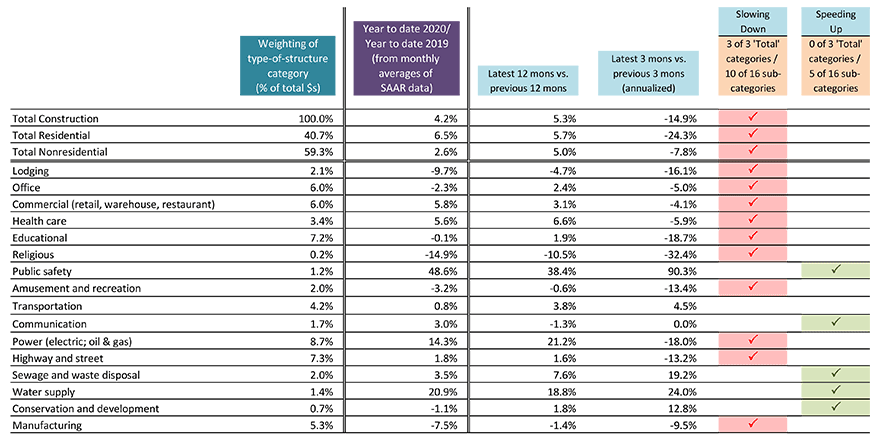
In the final two columns, if there is no check mark in the cell, then the type-of-structure category has stayed within 1.0%, up or down.
A negative that becomes more negative is considered to be ‘slowing down’; if less negative, then ‘speeding up’.
Data source: Census Bureau / Table: ConstructConnect
Construction Truly ‘Booming’ Pre-COVID?
The following three graphs show the history of the put-in-place construction spending numbers since January 2010.
The term ‘booming’ was often used to describe U.S. construction activity pre-COVID. But the difficulty in finding skilled construction workers to complete projects may have influenced that word assignment more than the reality of what was happening on the ground.
From the top portion of Graph 2, the residential curve reached a peak in early 2018, then dipped for a while before returning to a decent volume in late 2020.
From the upper portion of Graph 3, the nonresidential curve was somewhat upbeat throughout 2019, but it wasn’t skyrocketing.
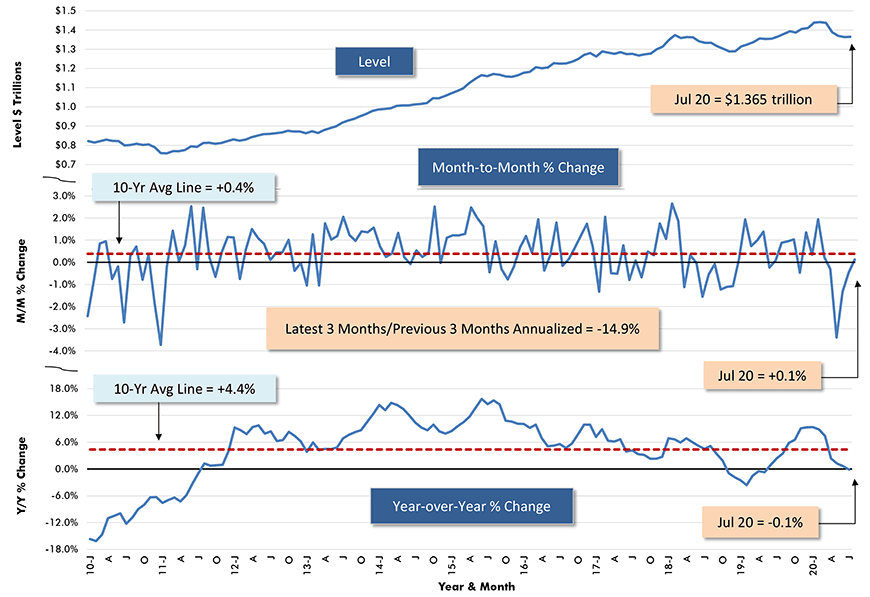
Chart: ConstructConnect.
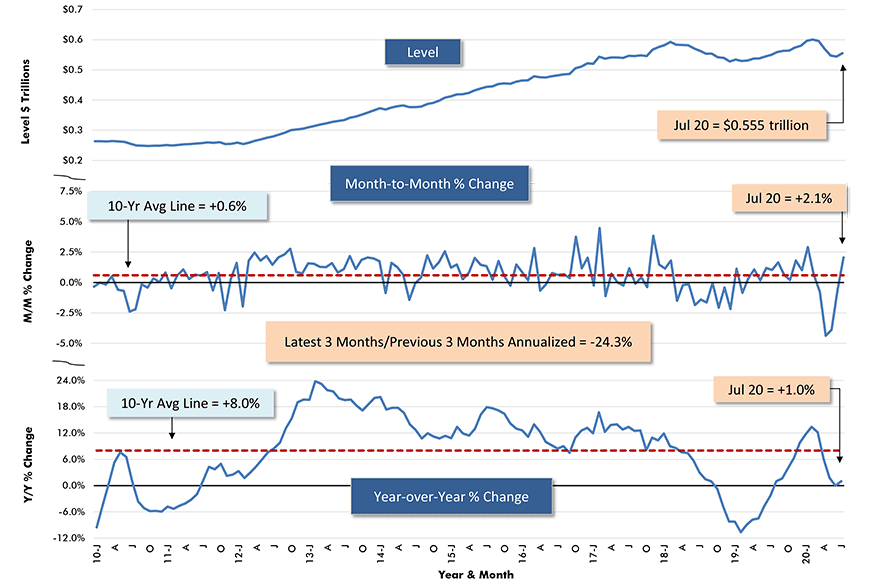
Chart: ConstructConnect.
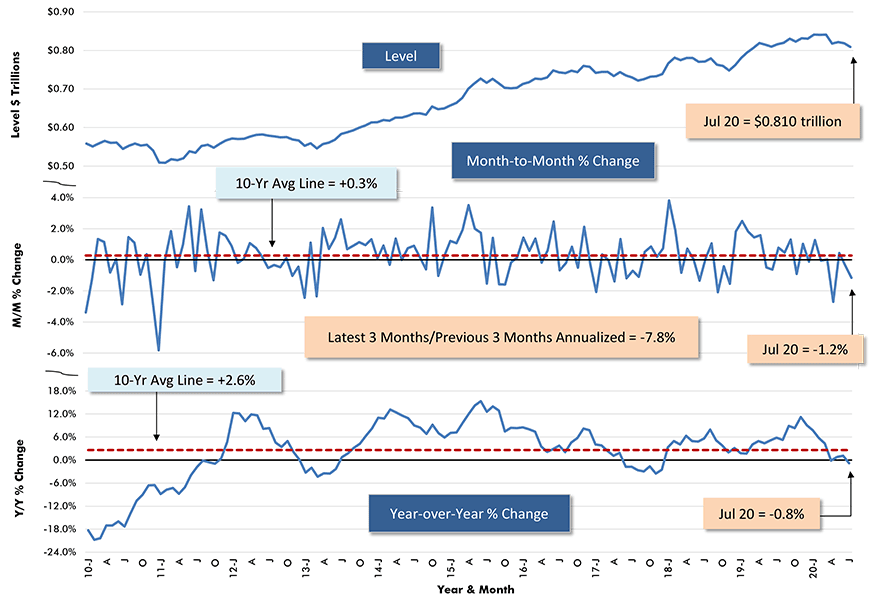
Chart: ConstructConnect.
Alex Carrick is Chief Economist for ConstructConnect. He has delivered presentations throughout North America on the U.S., Canadian and world construction outlooks. Mr. Carrick has been with the company since 1985. Links to his numerous articles are featured on Twitter @ConstructConnx, which has 50,000 followers.




Recent Comments
comments for this post are closed