
The Presidential election is less than three weeks away and it will be hard to focus on much else between now and November 3rd. Just the same, proper attention needs to be paid to all the other happenings that are proceeding just off centerstage. Some incredible statistical results are being racked up in the latest data releases from public and private bodies and the highlights are summarized in the next 13 bullet points.

- Versus the huge number-of-jobs drop between February and April, the U.S. recovery ratio as of September’s Employment Situation Report remains under half (47.7%). That’s disappointing. Canada’s jobs claw-back ratio is now over three-quarters (76.1%). That’s remarkable, given that Canada’s contraction in total jobs, due to the onset of the coronavirus contagion, was -15.7%, which was worse than America’s -13.5%.
- Canada’s total employment is presently -3.6% year over year; the U.S. comparable figure is -6.4%. In service sector employment, it’s -3.5% y/y for Canada versus -7.2% y/y for the U.S. In manufacturing, Canada again has the lead, -0.9% y/y to -5.0% y/y; but in construction, it’s the U.S. with the better result, -3.7% y/y to -7.4% y/y.
- Employment in certain pockets of the U.S. economy has held up well. In most instances, the logic for why there has been the jobs strength is easy to surmise, given the circumstances. Employer designations where there are more jobs now than a year ago include: the manufacture of ‘pharmaceuticals and medicines’, +1.5% y/y; ‘software publishing’, +2.6%; ‘building material and supplies dealers’, +7.2%; and ‘couriers and messenger services’, +13.5%.
- Furthermore, there are several employer categories where the jobs declines, year over year, have been relatively minor: ‘accounting and bookkeeping’, -1.8%; ‘real estate’, -1.9%; and ‘computer systems design’ work, -2.0%.
- But how about where the jobs performances continue to be shocking? Employer categories where year-over-year jobs counts are still reeling include: ‘machinery and equipment rental and leasing’, -13.1%; ‘coal mining’, -14.8%; ‘food services and drinking places’, -17.6%; ‘amusements, gambling and recreation’, -26.8%; and ‘hotels and motels’, -37.5%.
- Everyone knows about the plummeting of jobs in bars and restaurants, hotels and motels. But there’s a profession where the employment plunge has been at least as dramatic, and it’s ‘The Arts’. Actors, writers, stagehands and recording artists are gradually returning to sets and studios, but their number is still -40.7% year over year. It’s no wonder the streaming services have been picking through the best of previously-not-seen-in-North- America foreign offerings and old-time hits from decades ago to fill stay-at-home entertainment needs.
Graph 1: U.S. Movie, Video & Music Jobs
Latest data points are September, 2020 / Based on seasonally adjusted (SA) data.
Chart: ConstructConnect.
- For construction, there’s good news in employment at ‘architectural and engineering services’ firms being down only -1.2% year over year. Design work is an advance or leading indicator for excavating and assembly activity that is likely to take place later in the field. The Architecture Billings Index (ABI) of the American Institute of Architects (AIA), however, is telling a more sobering story. An ABI over 50.0, which is where it was in January and February of this year, means new orders are rolling in. In April, though, the ABI sank to just 29.5 and over the last three months, June to August, it’s been stuck at 40.0.
- The U.S. Conference Board’s Consumer Confidence Index shot up from 86.3 in August to 101.8 in September. (The base for the series is 1985=100.0.) There’s no joy to be found in placing a damper on news of that improvement, but the latest reading applies before the recent uptick in COVID-19 cases. Currently, Johns Hopkins statistics are showing no states with moderations in flu infection counts. Some states are in a holding pattern, but most are experiencing rising caseloads. Economy re-openings are being thwarted.
- The Purchasing Managers Index (PMI) of the Institute for Supply Management (ISM) was a healthy 55.4% in September, indicating an expansion of both the total economy and the manufacturing subset. (The figure’s low point occurred in April, at 41.5%.) As for prospects of a surge in capital spending to expand footprints in manufacturing, that’s not likely to happen until the capacity utilization rate of the sector rises considerably higher. According to the Federal Reserve, the plant usage rate in manufacturing is a mere 70.2%.
- September’s Producer Price Index (PPI) results from the Bureau of Labor Statistics (BLS) include the following year-over-year increases relating to construction activity. The PPI’s ‘construction materials special index’ is now registering +5.0% y/y (up from +2.0% y/y in August); the ‘inputs to new construction index, excluding capital investment, labor and imports’, has become +3.7% (compared with August’s +1.3%); and the ‘final demand construction’ index has moved to +1.6% (down from +1.8% previously). The first two indices relate to material inputs; the latter ties more to the actual charge for construction. Material costs are clearly escalating, but with fewer projects in the marketplace, bid prices have tightened. By the way, the PPI index for softwood lumber in September climbed to +81.2% year over year.
- Canadian housing starts, which surprised nearly everybody by soaring to 262,000 units seasonally adjusted and annualized (SAAR) in August, returned to earth in September, at 209,000 units. On a year-to-date basis, in Canada’s six largest (by population) cities, residential groundbreakings have been: +26% in Toronto; +20%, Ottawa-Gatineau; +1%, Montreal; -7%, Edmonton; -19%, Calgary; and -27%, Vancouver.
- Canada has become used to large population increases, driven mainly by immigration in recent years. With the closing of boarders, due to the pandemic, Q2 2020’s population gain was nearly non-existent, only +0.1%, the lowest percentage change for a second quarter in the history of the available numbers dating back to 1972. The annual population increase was +1.5% before this spring. On July 1, the annual bump fell to +1.1%. It will deteriorate further in the next couple of quarterly estimates.
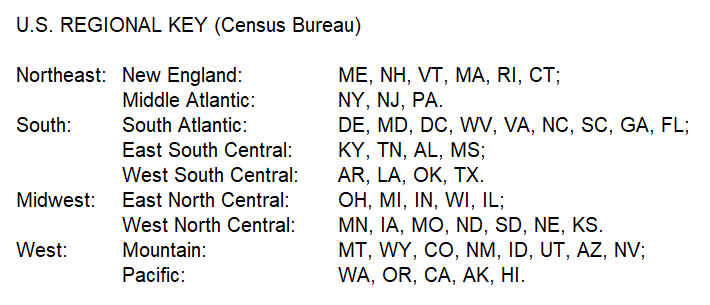
- Finally, Tables 1 and 2 show September year-to-date actual starts in U.S. geographic regions (as defined by the Census Bureau ‒ see ‘key’ below), for nonresidential building (NRB) work and heavy engineering/civil projects. The decline in NRB starts (-34.7% ytd) has been markedly worse than for engineering starts (-15.9%), in fact more than twice as bad. Only the Midwest (-13.2% ytd) has escaped the carnage in NRB starts with its ‘dignity’ relatively intact. In engineering starts, the West has the singular distinction of being able to boast of an increase, +11.7%.
Nonresidential Building Construction Starts ‒ ConstructConnect
| Jan-Sep 2019 | Jan-Sep 2020 | % Change | |||
| New England | $13,561,767,319 | $8,207,427,260 | -39.5% | ||
| Middle Atlantic | $24,450,581,897 | $16,527,964,823 | -32.4% | ||
| NORTHEAST | $38,012,349,216 | $24,735,392,083 | -34.9% | ||
| East North Central | $28,224,601,714 | $23,475,105,338 | -16.8% | ||
| West North Central | $16,681,414,333 | $15,515,393,204 | -7.0% | ||
| MIDWEST | $44,906,016,047 | $38,990,498,542 | -13.2% | ||
| South Atlantic | $50,788,322,895 | $36,383,475,930 | -28.4% | ||
| East South Central | $15,758,097,437 | $10,047,437,452 | -36.2% | ||
| West South Central | $61,197,510,986 | $26,894,769,019 | -56.1% | ||
| SOUTH | $127,743,931,318 | $73,325,682,401 | -42.6% | ||
| Mountain | $20,110,569,121 | $15,721,856,390 | -21.8% | ||
| Pacific | $34,565,436,463 | $23,212,179,617 | -32.8% | ||
| WEST | $54,676,005,584 | $38,934,036,007 | -28.8% | ||
| TOTAL U.S. | $265,338,302,165 | $175,985,609,033 | -33.7% |
Heavy Engineering/Civil Construction Starts ‒ ConstructConnect
| Jan-Sep 2019 | Jan-Sep 2020 | % Change | |||
| New England | $5,135,467,733 | $4,570,276,807 | -11.0% | ||
| Middle Atlantic | $13,668,431,989 | $10,958,106,066 | -19.8% | ||
| NORTHEAST | $18,803,899,722 | $15,528,382,873 | -17.4% | ||
| East North Central | $23,008,465,784 | $17,984,742,183 | -21.8% | ||
| West North Central | $15,302,356,436 | $13,013,108,301 | -15.0% | ||
| MIDWEST | $38,310,822,220 | $30,997,850,484 | -19.1% | ||
| South Atlantic | $29,897,411,121 | $18,309,230,179 | -38.8% | ||
| East South Central | $5,264,545,360 | $4,811,230,358 | -8.6% | ||
| West South Central | $21,071,500,724 | $17,478,670,864 | -17.1% | ||
| SOUTH | $56,233,457,205 | $40,599,131,401 | -27.8% | ||
| Mountain | $13,664,768,001 | $9,372,195,224 | -31.4% | ||
| Pacific | $16,190,217,418 | $23,964,162,004 | 48.0% | ||
| WEST | $29,854,985,419 | $33,336,357,228 | 11.7% | ||
| TOTAL U.S. | $143,203,164,566 | $120,461,721,986 | -15.9% |
Alex Carrick is Chief Economist for ConstructConnect. He has delivered presentations throughout North America on the U.S., Canadian and world construction outlooks. Mr. Carrick has been with the company since 1985. Links to his numerous articles are featured on Twitter @ConstructConnx, which has 50,000 followers.


Recent Comments
comments for this post are closed