Inflation Down for the Count?
The year-over-year change in consumer prices in the U.S. in October was +1.2%, according to the Bureau of Labor Statistics (BLS). In Canada, the latest month’s price climb was only +0.7% y/y, as calculated by Statistics Canada.
October’s y/y ‘core’ rates of inflation, which leave out volatile energy and food components, were +1.6% and +0.8% south and north of the border respectively.
The current rates of inflation in both countries are tepid and no cause for alarm. In fact, it’s been many years since inflation has been the terrifying prospect it once was.
A little inflation, of say around +2.0% y/y, is a good thing. It greases the wheels of economic activity, making loans easier to pay down for both business and individual borrowers. Current price hikes aren’t rising to even +2.0% y/y.
There have been background factors working to suppress inflation, however, and some of those buffers are weakening or disappearing. The next section will elaborate on some of those changes.
(Not Seasonally Adjusted)
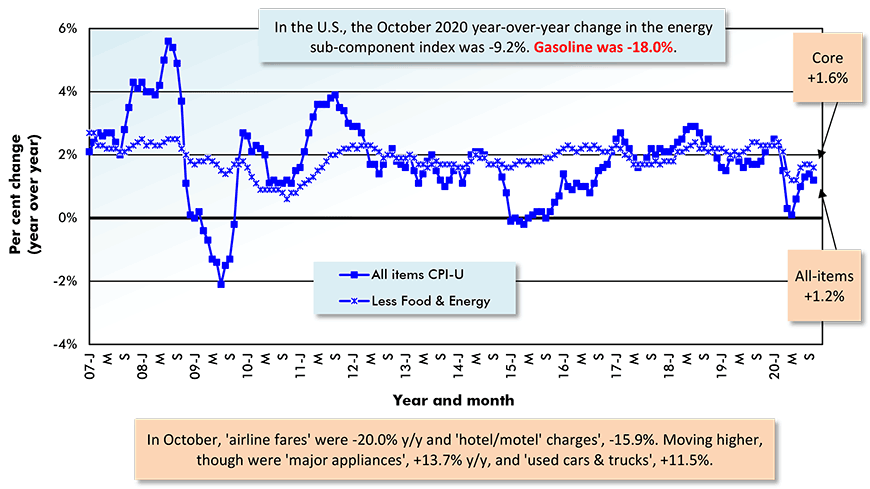
The U.S. figure (CPI-U) is the All Items Consumer Price Index for All Urban Consumers.
*Core inflation is CPI-U less its often most volatile sub-components, food and energy.
Chart: ConstructConnect.
(Not Seasonally Adjusted)
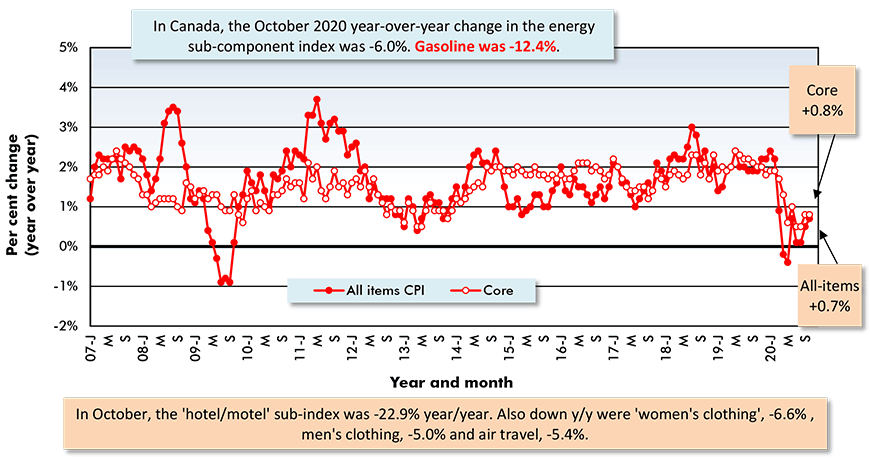
The Canada figure (CPI) is the All Items Consumer Price Index.
*Core inflation is CPI-U less its often most volatile sub-components, food and energy.
Chart: ConstructConnect.
(CPI & CPI-U Not Seasonally Adjusted)
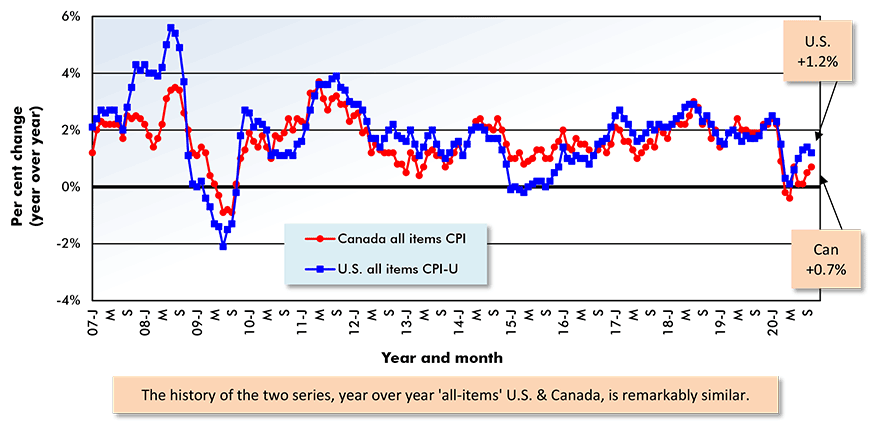
Chart: ConstructConnect.
(CPI Core & CPI-U Less Food and Energy Not Seasonally Adjusted)
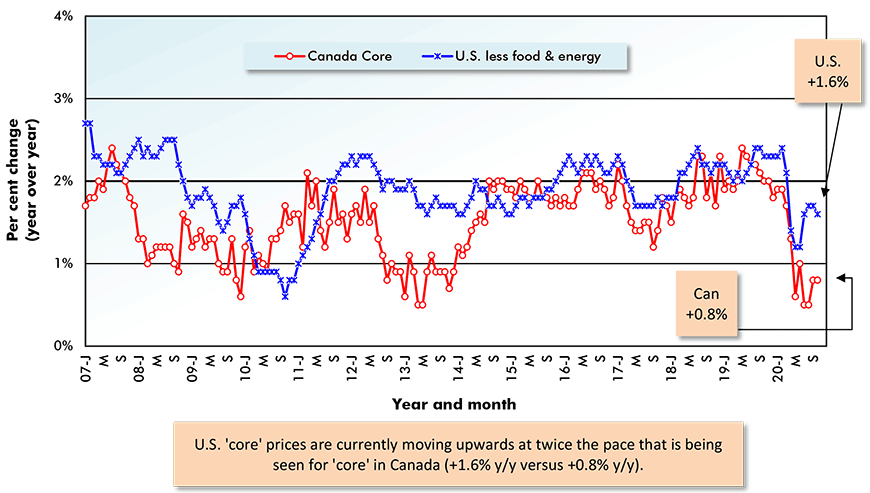
*Core is all-items inflation less its often most volatile sub-components, food and energy.
Chart: ConstructConnect.
Some of the Buffers Against Inflation are Weakening or Disappearing
The following are some of the factors that may, over the next year or so, begin to spark a renewed pick-up in prices.
(1) In the 00s, there were sizable upsurges in global commodity prices as China, the source of nearly half the world’s demand for raw materials, embarked on several massive infrastructure spending programs. Since then, there’s been more than a decade of disappointing world trade.
Beijing has recently announced a new expenditure kick-start to its economy, to usher in more high-tech development, especially in 5G networking, and to counter the negative impacts of the coronavirus downturn that paralyzed growth at the end of last year. Commodities (copper, nickel, iron ore, aluminum, steel, cement, etc.) are the building blocks of nearly everything. If they move up in price to a significant degree, watch out for a ‘snowball effect’.
(2) To expand further on the previous point, this summer saw softwood lumber prices nearly double as an unexpected demand swell smashed into a supply shortage caused by sawmill closures. The shutdowns were in anticipation of a house-building collapse that failed to happen. (In fact, the opposite occurred.) Lately, there’s been a better balancing of demand and supply, and ‘all dimensions’ lumber has eased in cost. But there’s a similar situation in energy pricing. From an inflation standpoint, the world has received a break from global oil and liquefied natural gas prices that have been much lower than historically. How long can this situation prevail?
(3) On the labor side of costs, the balance of power in contract negotiations has resided with management since the serious onset of globalization. For years, many disgruntled workers have been biting their tongues, knowing that it they become viewed as a nuisance, they run the risk of being replaced by someone overseas. To the extent that ‘deglobalization’ takes hold and reverses what has gone before, it will return more leverage and bargaining strength to labor.
(4) Further on the cost of labor, President-Elect Biden has made no secret of his desire that the concerns of U.S. labor receive a priority boost. Minimum wage hikes are now more likely. A ‘Buy America’ initiative will be launched to put more Americans back to work. The merits of such courses of action can be easily argued, but everyone should know that they’ll be paying a bit more consequently.
(5) High-tech has not received enough credit for keeping prices in check over the past decade-plus. Advances in software and hardware development, often tied to ‘big data’, have sent prices plunging in communications, manufacturing (think automation) and the services sector (one can order almost anything online). There may seem to be no limits to how much more can be achieved, but perhaps that’s a fallacy. For example, Uber and Lyft have cut the cost of a ‘taxi’ ride, but can there be a next-phase reduction?
(6) Record low mortgage rates are driving a significant increase in demand for residential real estate and both new and existing home prices. The National Association of Realtors (NAR), the National Association of Homebuilders (NAHB) and the Canadian Real Estate Association (CREA) all have home price indices that are presently rising by double-digit percentage increases. Will the run-up in prices on the homes front spill over into other marketplaces?
(7) Another key factor spurring on new and existing homes purchases has been the doubling in the ‘savings’ rate. With greatly reduced opportunities to spend money on theater tickets, dining-out, trips around the country and so on, many wage-earners are fattening up their bank accounts. Some of those funds are going towards property down payments. A portion, though, is being held in reserve, awaiting widespread vaccine distribution to bring the coronavirus under control. When immunity occurs, a wave of savings will be unleashed, with the potential to chase after and stampede the prices of goods and service.
(8) Finally, the U.S. and Canadian federal governments, in their efforts to mitigate the harmful economic effects of the pandemic, have taken on enormous debt. Other eras in history, with the experience gained by other nations, have established that when government expenditures far outpace receipts, the potential for trouble on the inflation front balloons alarmingly.
Previous Month & Current Month (September & October 2020)
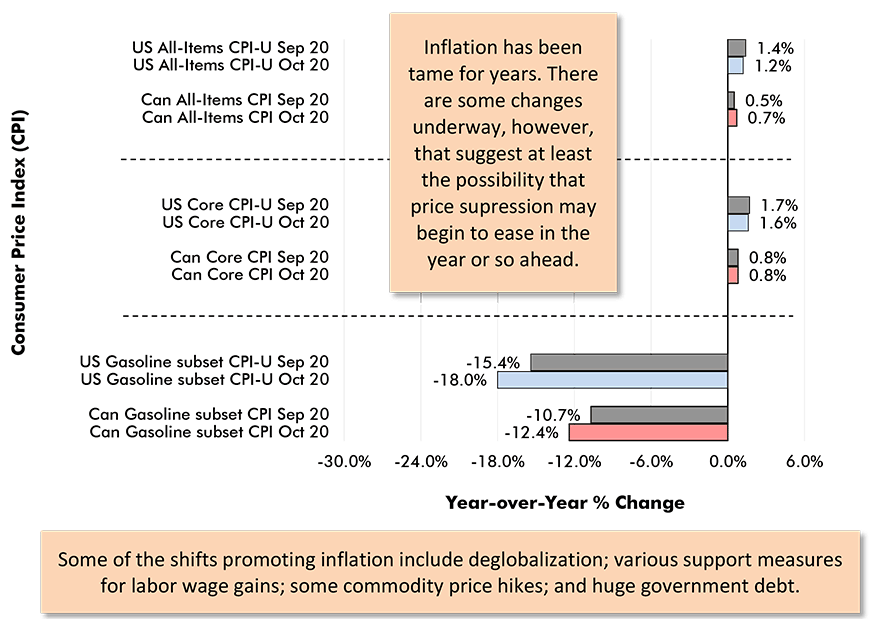
Chart: ConstructConnect.
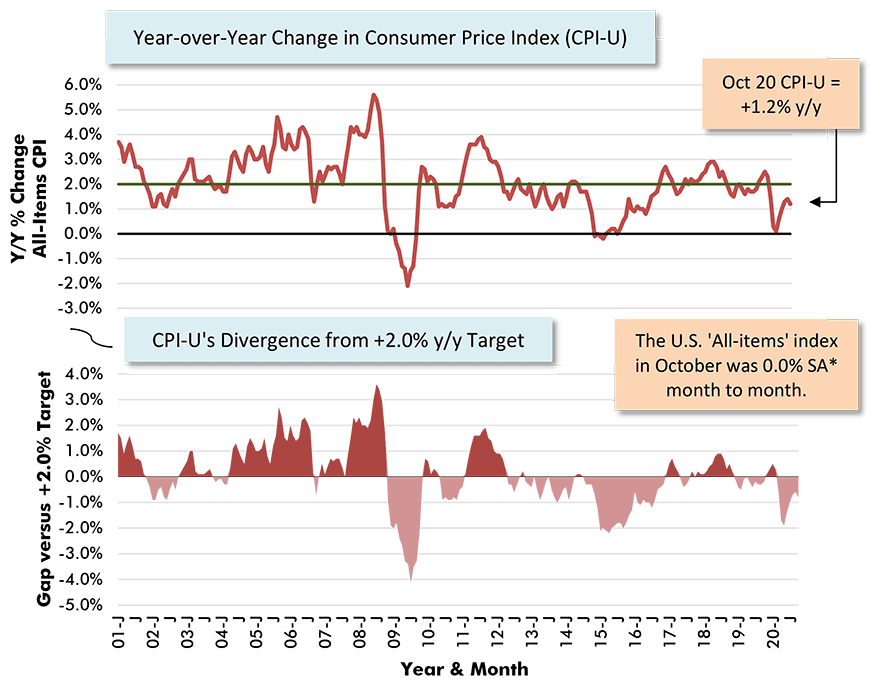
CPI-U is for ‘All Urban Consumers, U.S. City Average’. A desirable rate of inflation is around +2.0% y/y.
Latest data points are for October, 2020.
Chart: ConstructConnect.
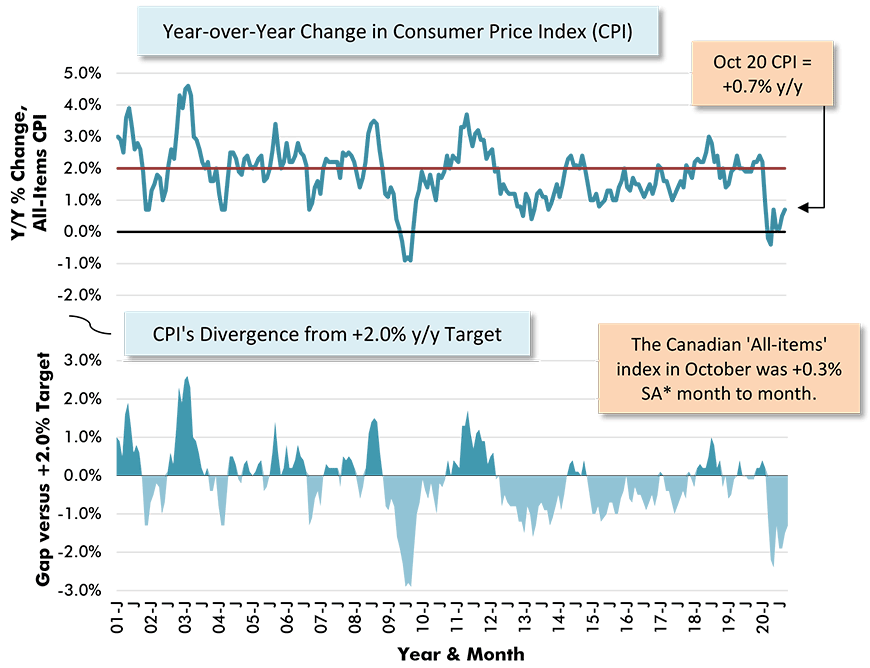
For a variety of reasons, there is a desirable rate of inflation and it’s around +2.0% y/y.
Latest data points are for October 2020.
Chart: ConstructConnect.
Alex Carrick is Chief Economist for ConstructConnect. He has delivered presentations throughout North America on the U.S., Canadian and world construction outlooks. Mr. Carrick has been with the company since 1985. Links to his numerous articles are featured on Twitter @ConstructConnx, which has 50,000 followers.


Recent Comments
comments for this post are closed