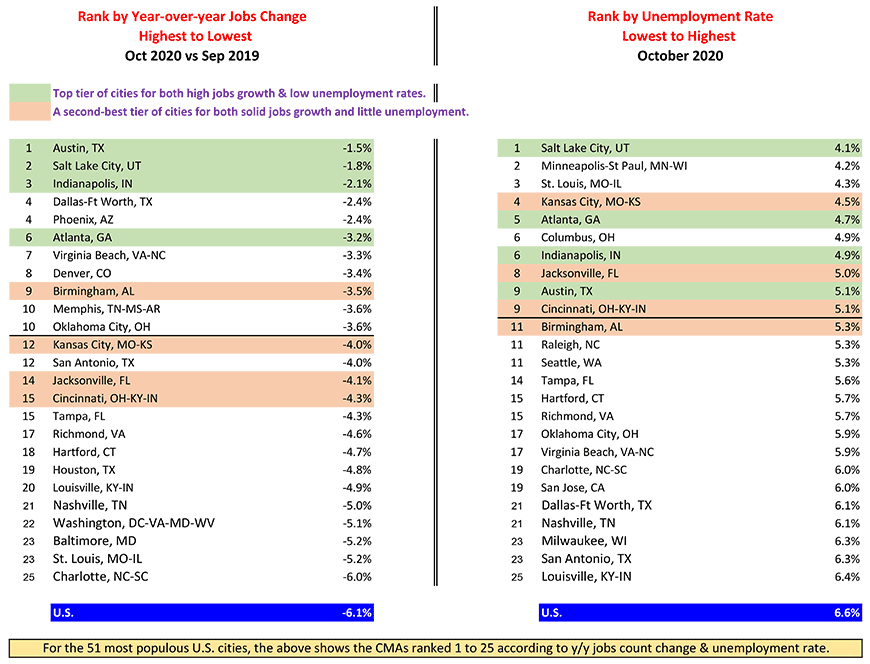
Table 1 sets out the best U.S. city labor markets according to two measurements, unemployment rates (with smallest being most desirable) and year-over-year jobs change (with fastest at the top).
At this present time, ‘fastest’ year-over-year jobs change means slowest decline. There isn’t a single city where there has been an increase in employment from year-previously levels.
Four cities, however, stand out (and are shaded green) for being among the Top 10 according to both criteria ‒ Salt Lake City, Indianapolis, Austin and Atlanta.
Another four cities comprise a second-rung ‘good’ grouping ‒ Kansas City, Birmingham, Jacksonville and Cincinnati.
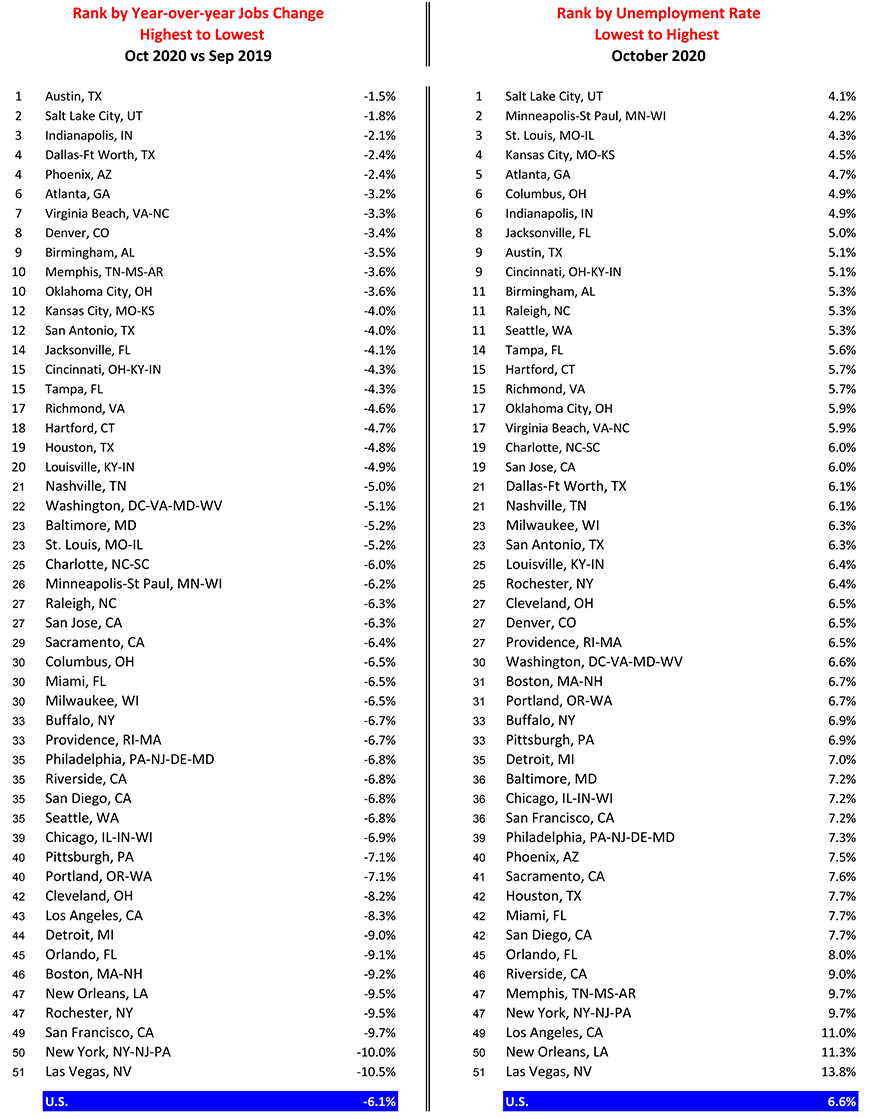
While not shown in Table 1, three cities are currently experiencing double-digit unemployment rates: Los Angeles, 11.0%; New Orleans, 11.3%; and Las Vegas, 13.8%.
Furthermore, Memphis and New York, each with unemployment rates of 9.7%, have barely escaped 10%-or-higher unemployment rate ignominy.
New York and Las Vegas have also been hammered on the jobs creation (or, more accurately, ‘de-creation’ front), with the former recording a figure of -10.0% and the latter, -10.5%.
Construction Employment Can Take a Bow
Thankfully, construction employment, as a subset of ‘total’ employment, has provided some rays of light.
From Table 2, there are 22 cities with year-over-year pickups in construction jobs counts. (Remember that no city has achieved a ‘total’ jobs gain y/y.)
The leading cities for construction jobs improvement in November, 2020, were Kansas City, +6.8% y/y; Cleveland, +6.5%; Nashville, +5.9%; Baltimore, +5.4%; and Raleigh, +5.1%.
The five cities with the worst figures on construction employment y/y have been Houston, -9.3%; San Francisco, -9.6%; Philadelphia, -9.8%; Boston, -10.4%; and New Orleans, -11.2%.
The employment numbers (‘total’ and for construction specifically) for all 51 of America’s cities with populations of a million-plus each appear at the bottom of this article online.
Table 1: Best U.S. City Labor Markets
Based on not seasonally adjusted (NSA) data. / Cities are metropolitan statistical areas (MSAs).
When the ranking numbers are the same, the cities are in a tie.
Data source: U.S. Bureau of Labor Statistics (BLS).
Table: ConstructConnect.
Table 2: U.S. Major Cities – Construction Employment
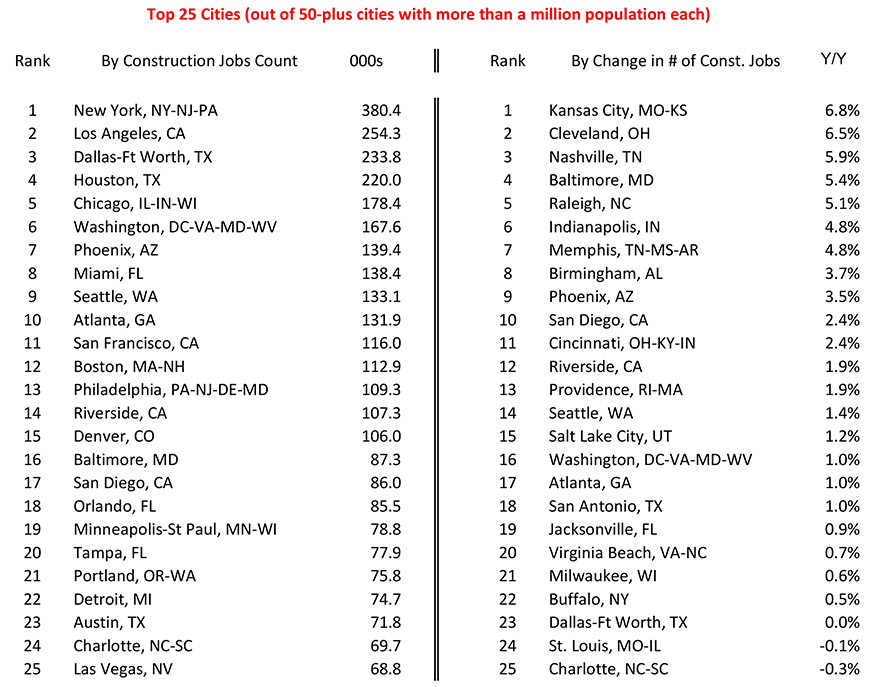
In a number of instances, the jobs count is more than just construction. It includes mining and logging jobs as well, but those figures are minor for major cities (of a million-plus population). Cities are Metro Statistical Areas (MSAs).
Data source: U.S. Bureau of Labor Statistics (BLS).
Table: ConstructConnect.
Table 3: U.S. City Labor Markets
Based on not seasonally adjusted (NSA) data. / Cities are metropolitan statistical areas (MSAs).
When the ranking numbers are the same, the cities are in a tie.
Data source: U.S. Bureau of Labor Statistics (BLS).
Table: ConstructConnect.
Table 4: U.S. Major Cities – Number of Jobs in Construction
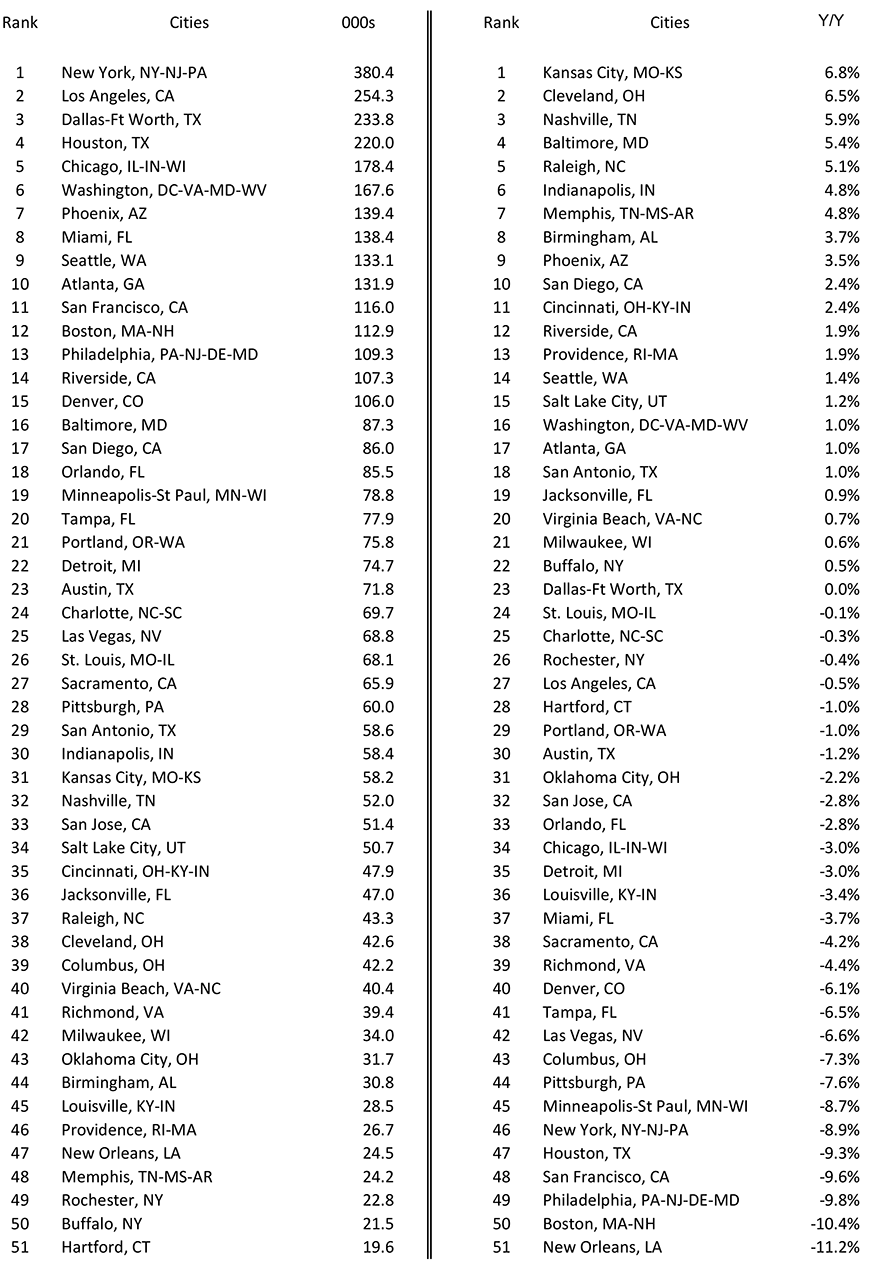
In a number of instances, the jobs count is more than just construction. It includes mining and logging jobs as well, but those figures are minor for major cities (of a million-plus population). Cities are Metro Statistical Areas (MSAs).
Data source: U.S. Bureau of Labor Statistics (BLS).
Table: ConstructConnect.
Alex Carrick is Chief Economist for ConstructConnect. He has delivered presentations throughout North America on the U.S., Canadian and world construction outlooks. Mr. Carrick has been with the company since 1985. Links to his numerous articles are featured on Twitter @ConstructConnx, which has 50,000 followers.





Recent Comments