
Due to its complexity, much of the subject matter concerning the economy requires detailed editorial commentary, often supported by relevant tables and graphs.
At the same time, though, there are many topics (e.g., relating to demographics, housing starts, etc.) that cry out for compelling ‘shorthand’ visualizations.
Whichever path is followed, the point of the journey, almost always, is to reach a bottom line or two.
To provide additional value, ConstructConnect is now pleased to offer an ongoing series of 1,000-word charts.
These will help readers sort out the ‘big picture’ more clearly.
This 1,000-word chart looks at the latest number of residential permits issued in the U.S., through April 2021, minus housing starts.
Net Figure of Latest 12-Month Sums (in Units), Total U.S.
(From Not Seasonally Adjusted/NSA Actuals)
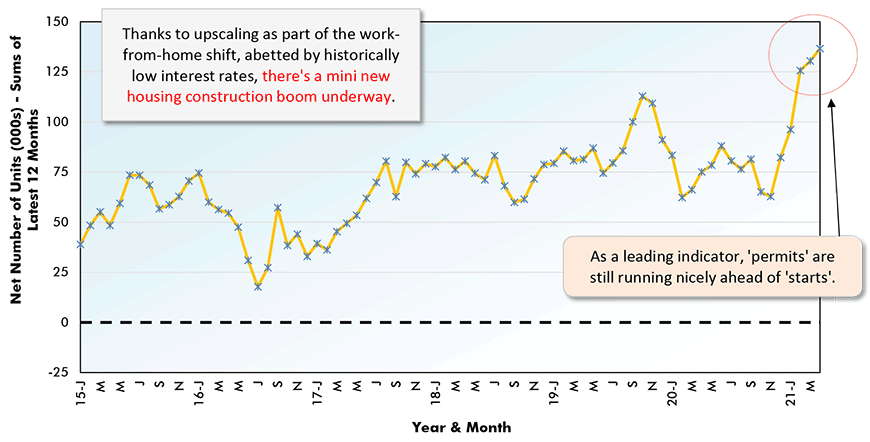
Chart: ConstructConnect.
Please click on the following link to view the latest housing starts charts for the U.S. and Canada: CanaData Forecaster Charts & Tables – Housing Starts


Recent Comments
comments for this post are closed