
The ten graphs in this article update the latest housing starts information for the U.S. and Canada through May 2021. Both countries are currently experiencing new home building booms. Super low mortgage and secondary-financing interest rates, a build-up of savings while being locked down during the pandemic and the pronounced shift to working from home and escaping from crowded downtown cores have been some of the major contributors to the uptick in new accommodation demand.

U.S. housing ‘starts’ appear to have settled in around 1.6 million units per month, seasonally adjusted and annualized (SAAR). The Canadian monthly average seems to be about 270,000 units, although twice this year the number has risen much higher, 308,000 in January and 333,000 in March.
The case for saying the ‘boom’ has been stronger in Canada than in the U.S. can be made in simple fashion. Monthly average starts on a SAAR basis in the U.S. year to date (Jan-May 2021) are an impressive +22.5%. The comparable change for Canada, though, is an even more outstanding +48.3%.
U.S. additional housing demand is being led far more by single-family groundbreakings, +30.0% in units, than by multi-family properties (apartments and condos), +7.1% (again in units). In the U.S., singles as a share of total starts are 71% year to date, with multis claiming the other 29%.
In Canada, the difference in year-to-date percentage-changes of singles versus multiples is much narrower. For Canada’s 35 census metropolitan areas (CMAs), single-family starts in units are +50%, but multi-family starts (again in units) are not trailing by much, +40%.
Also, in Canada, the singles-to-multiples shares of ‘total’ lean in the opposite direction of the U.S. The singles segment of the marketplace in Canada contributes only 22% of total unit starts. The other 78% is provided by multiples.
(While it is not a huge factor, warranting mention is the fact that townhouses in the U.S., exclusive of residences ‘bundled’ by shared HVAC systems, are counted as ‘singles’, while in Canada, they are included in the multiples category.)
Graph 1: U.S. Total Monthly Housing Starts
Seasonally Adjusted at Annual Rates (SAAR)
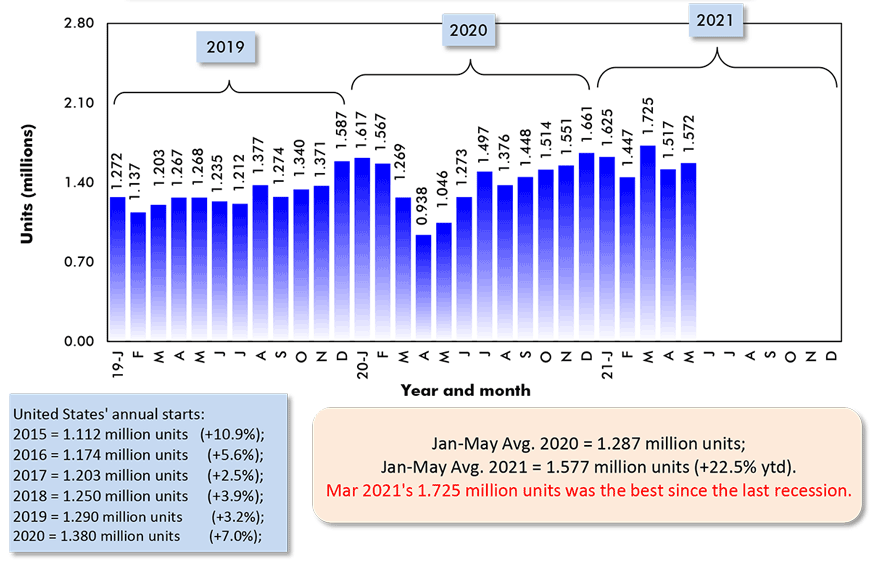
The last data points are for May 2021.
Data source: U.S. Census Bureau (Department of Commerce).
Chart: ConstructConnect.
Graph 2: Canada Monthly Housing Starts
Seasonally Adjusted at Annual Rates (SAAR)
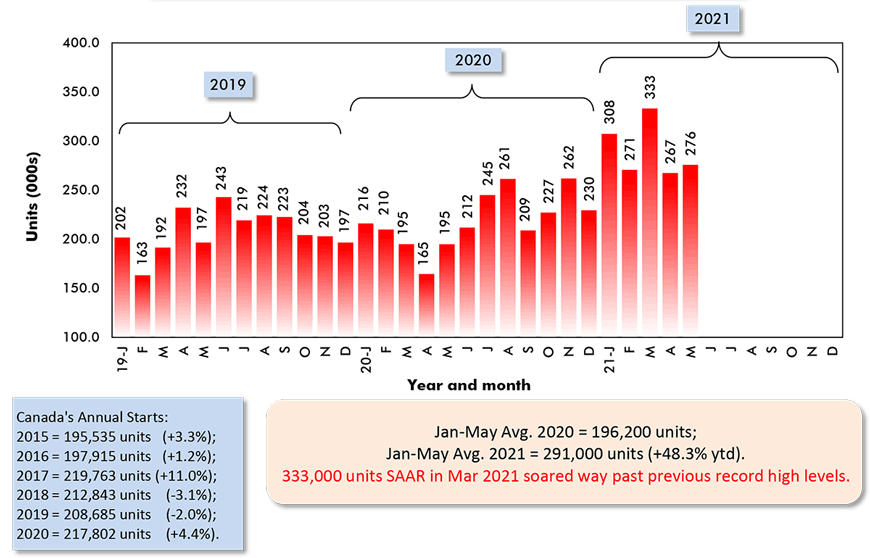
Data source: Canada Mortgage and Housing Corporation (CMHC).
Chart: ConstructConnect.
Graph 3: U.S. and Canada Monthly Housing Starts
Seasonally Adjusted at Annual Rates (SAAR)

The last data points are for May 2021.
ARROWS: U.S. numbers to be read from left axis; Canadian from right axis.
Data sources: U.S. Census Bureau & Canada Mortgage and Housing Corp (CMHC).
Chart: ConstructConnect.
Graph 4: U.S. Single-Family & Multi-Family Monthly Housing Starts
Seasonally Adjusted at Annual Rates (SAAR)
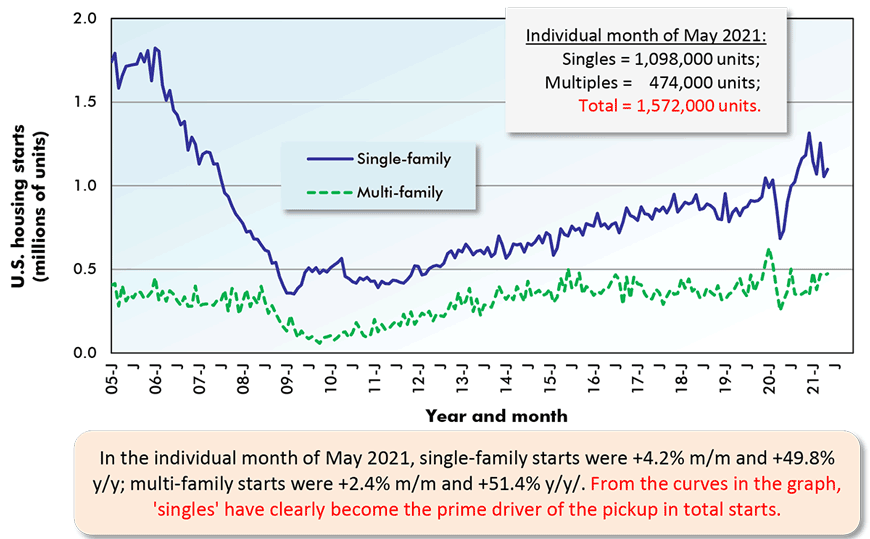
The last data points are for May 2021.
Data source: U.S. Census Bureau (Department of Commerce).
Chart: ConstructConnect.
Graph 5: U.S. Total Monthly Housing Starts
Seasonally Adjusted at Annual Rates (SAAR)
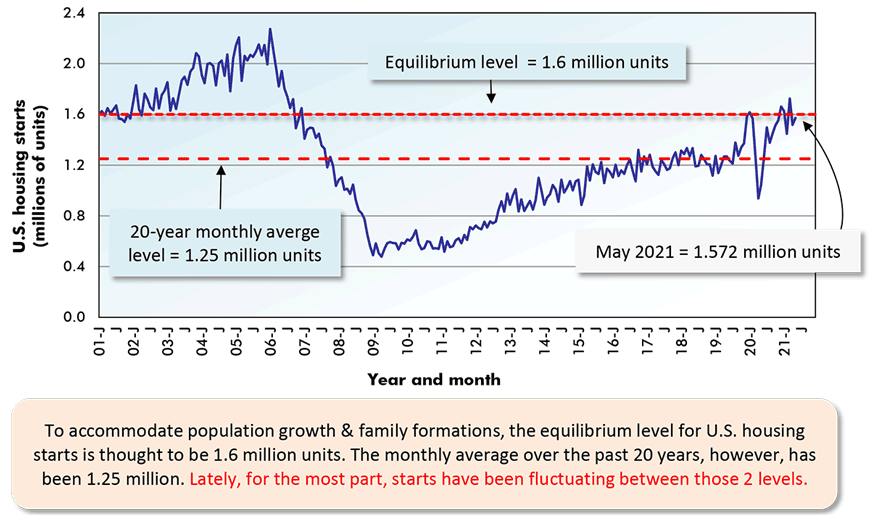
The last data point is for May 2021.
Data source: U.S. Census Bureau (Department of Commerce).
Chart: ConstructConnect.
Outlooks Still Mainly Upbeat
The outlook for ‘starts’ in the U.S. continues to be positive given that residential ‘permits’ have been running so ‘hot’. Since late in 2020, ‘permits’ have been in a range of 1.7 to 1.9 million units and, from historical patterns, they lead or occur in advance of ‘starts’ activity.
Canadian housing starts are likely to recede somewhat, tamped down by an affordability issue brought on by prices having climbed so steeply.
But serving to keep a spring in Canada’s housing starts step will be the resumption of a high dose of immigration now that the pandemic is (hopefully and with fingers crossed on both hands) winding down. The Trudeau government has committed to expanding the number of foreign individuals allowed into the country over the next several years, to make up for lost time.
Regionally in the U.S., the Northeast is accounting for the largest percentage increase in housing starts to date in 2021, +38.0%. But the NE accounts for less than 10% of America’s total. It’s the South Region, with half of total U.S. starts (51.6%) that bears watching closest. Starts in the South through the first five months of 2021 are +18.2%.
In Canada, Montreal is leading the nation’s six most populous cities in percentage-change of starts, +77%. Provincially, though, British Columbia rather than Quebec is the standout. B.C. has a share of total starts, at 18.6%, that is considerably above its proportion of Canada’s total population, 13.5%.
Graph 6: U.S. Monthly Residential Building Permits
Seasonally Adjusted at Annual Rates (SAAR)
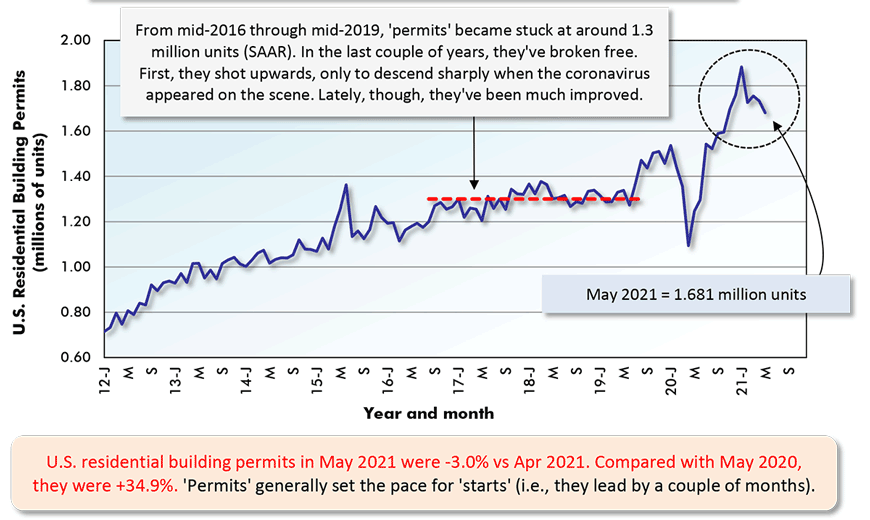
The last data point is for May 2021.
Data source: U.S. Census Bureau (Department of Commerce).
Chart: ConstructConnect.
Graph 7: U.S. Regional Housing Starts (SAAR) – May 2021
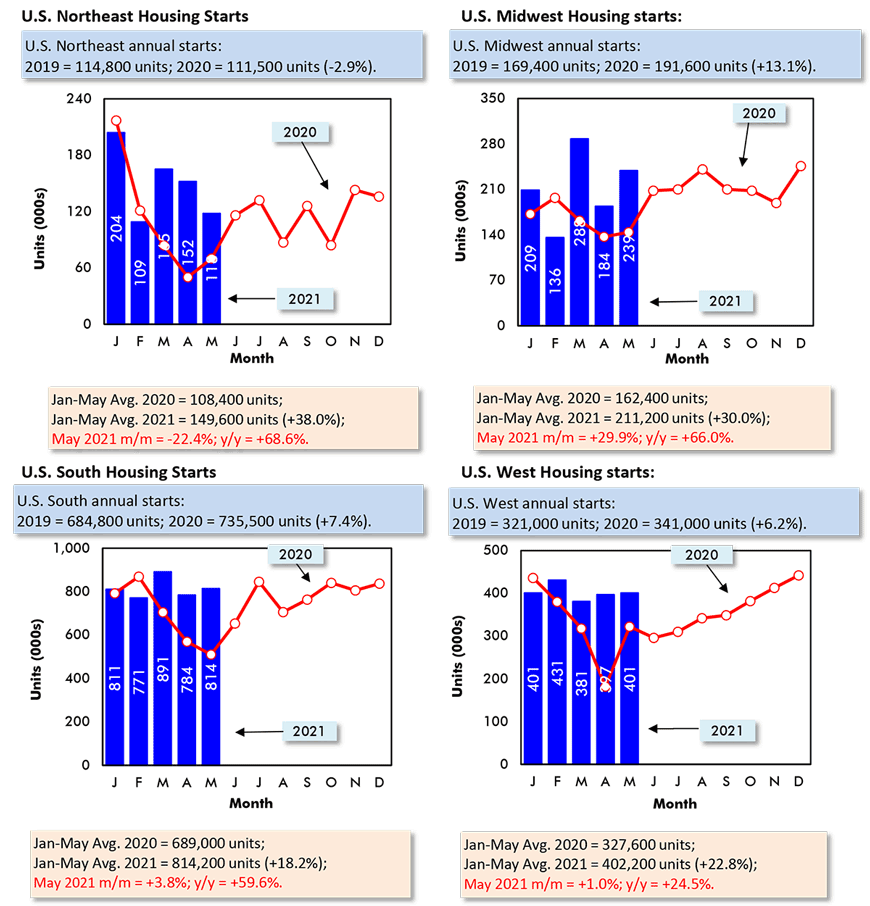
Data source: U.S. Census Bureau (Department of Commerce).
Chart: ConstructConnect.
Graph 8: U.S. Housing Starts
Jan-May 2021 vs Jan-May 2020 % Changes
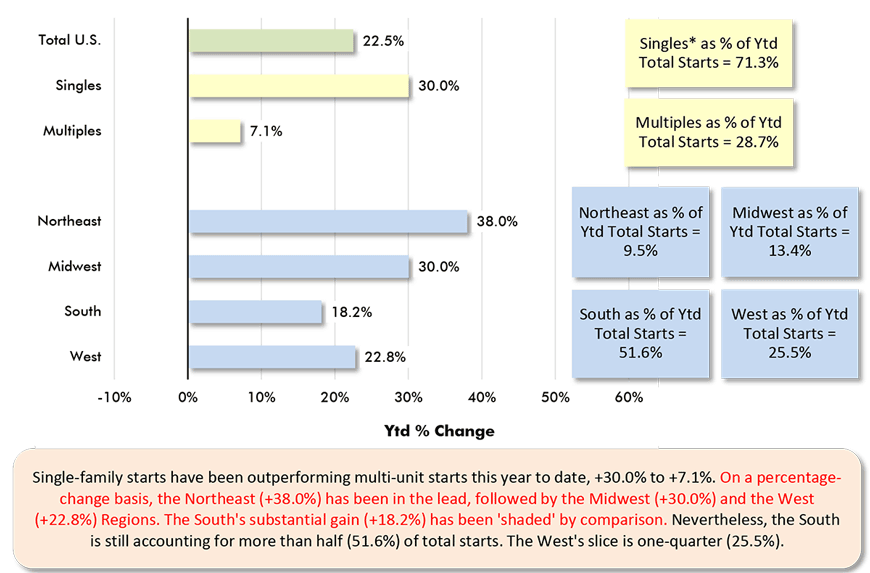
Based on averages of monthly seasonally adjusted and annualized (SAAR) unit starts.
* ‘Singles’ includes townhouse complexes, except when multiple units have common heating & air conditioning.
Data source: U.S. Census Bureau.
Chart: ConstructConnect.
Graph 9: Percent Change in Year-To-Date Housing Starts –
Ranking Of Canada’s Provinces
(Jan-May 2021 vs Jan-May 2020)
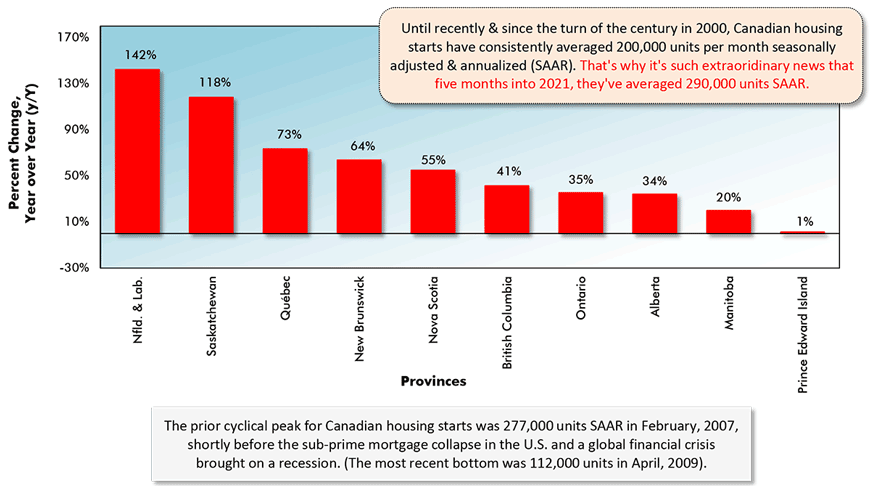
Data source: Canada Mortgage & Housing Corporation (CMHC) based on actuals rather than seasonally adjusted data.
Chart: ConstructConnect.
Graph 10: Percent Change in Year-To-Date Housing Starts –
Ranking Of Canada’s Major Cities
(Jan-May 2021 vs Jan-May 2020)
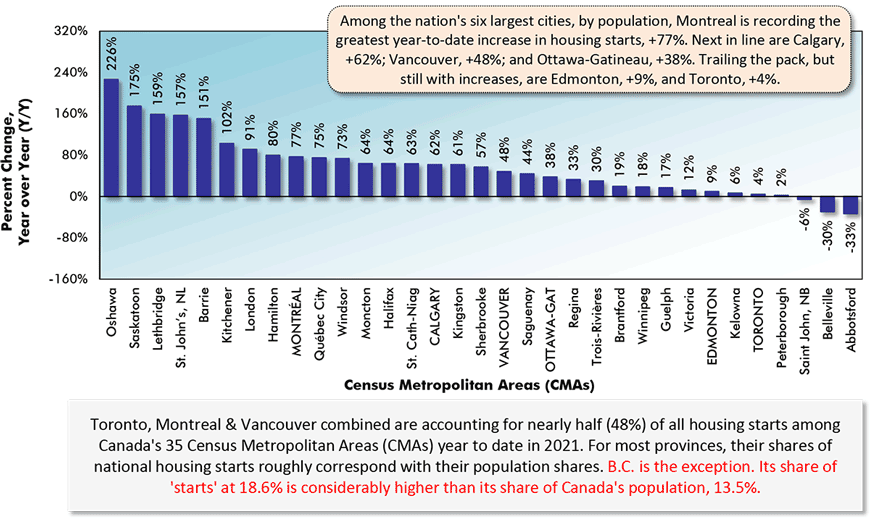
Canada’s Census Metropolitan Areas (CMAs) have core populations of 50,000 plus.
Canada’s 6 CMAs with populations in excess of 1 million are in capital letters.
Data source: Canada Mortgage & Housing Corporation (CMHC) based on actuals rather than seasonally adjusted data.
Chart: ConstructConnect.
Please click on the following link to download the PDF version of this article:
Economy at a Glance Vol. 17, Issues 94, 95 and 96 – Latest U.S. and Canadian Housing Starts in 10 Graphs – PDF
Alex Carrick is Chief Economist for ConstructConnect. He has delivered presentations throughout North America on the U.S., Canadian and world construction outlooks. Mr. Carrick has been with the company since 1985. Links to his numerous articles are featured on Twitter @ConstructConnx, which has 50,000 followers.


Recent Comments