
Big Grin Greets Big Pickup in Youth Employment
In any pre-pandemic month, May’s U.S. total jobs count gain of +559,000 would have registered as outstanding. And I don’t want to belittle the achievement, especially since it soundly beats the previous month’s figure of +278,000.

But as can be seen from Graph 1, even a swing of plus more than half a million appears as only a blip in the context of the month-to-month movements over the past year and a quarter.
The seasonally adjusted (SA) unemployment rate in May improved to 5.8% from 6.1% in April. The not seasonally adjusted (NSA) unemployment rate downshifted to 5.5% from 5.7% the month previously.
Young people are finding employment once again. The SA unemployment rate for individuals aged 16 to 19 brightened to 9.5%. And yes, ‘brightened to 9.5%’ is appropriate wording given that a year ago the SA unemployment rate for those just under aged 20 was 30.7%.
The primary reason for better youth employment has been the year-over-year jobs pickup in the ‘leisure and hospitality’ sector, +41.7%.
From Table 1, the U.S. jobs recovery ratio (a.k.a. the ‘claw-back’ ratio), relative to the plunge in employment that occurred in the Spring of last year, has perked up to 65.9%, or nearly two-thirds.
Graph 1: U.S.: Month-to-month Total Jobs Creation
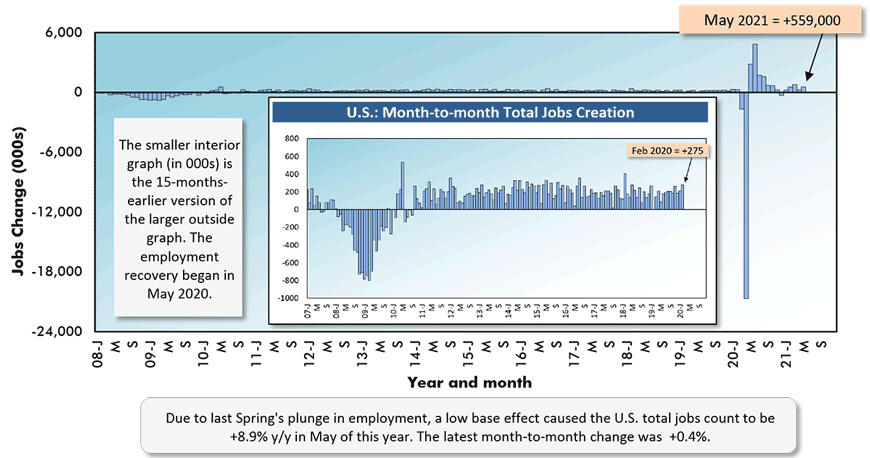
Chart: ConstructConnect.
Table 1: Monitoring the U.S. Employment Recovery – May 2021
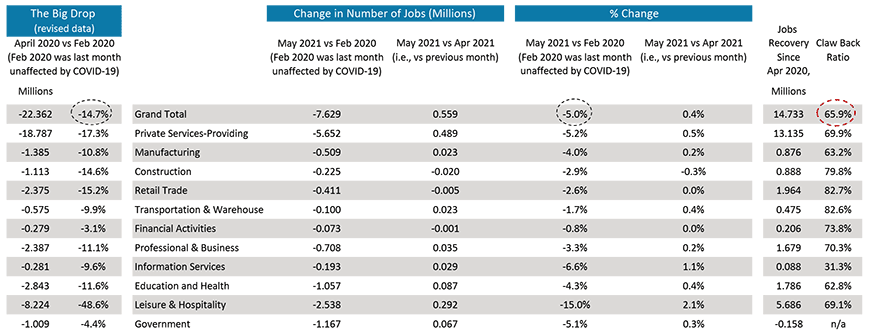
Chart: ConstructConnect.
A Bad News/Good News Month for Construction Workers
The construction sector’s claw-back ratio now sits at a relatively high 79.8%.
But May was not a good month for construction employment. From Graph 2, onsite work retreated by -20,000 jobs in the latest month, with nonresidential sub-trade contractors accounting for almost all the payroll shrinkage.
With respect to compensation increases, however, ‘hard hat’ workers had more reason to smile than most in the labor force. While year-over-year wage gains for all jobs in May, including supervisory personnel, were +2.0% hourly and +2.6% weekly, construction workers were basking in pay hikes of +4.1% hourly and +4.6% weekly.
Concentrating on only production employees (i.e., leaving out bosses), the ‘all jobs’ hourly and weekly pay raises in May were +2.4% and +3.0%. The construction worker subset did notably better at +4.4% and +4.9%.
An interesting sidebar, though, is that manufacturing workers in May realized a y/y hourly earnings increase of +3.3%, not so remarkable, but a weekly compensation hike of +9.1%, something to cheer about. (The compensation ‘level’, on average, for construction workers remains at least a fifth higher than for production line workers.)
Many of the trends now driving the economy lean towards stimulating domestic manufacturing activity (e.g., deglobalization; promotion of ‘Buy America’; even an infrastructure spending push, since it will require the input of so many building products).
U.S. manufacturing employment in May rose by +23,000 jobs. The NSA unemployment rate in manufacturing has tightened to 4.8% presently from 11.6% a year ago. Construction’s unemployment rate currently stands at 6.7%, well down from 12.7% in May 2020.
Graph 2: Change in Level of U.S. Construction Employment, Month to Month (M/M) −
Total & by Categories – May 2021
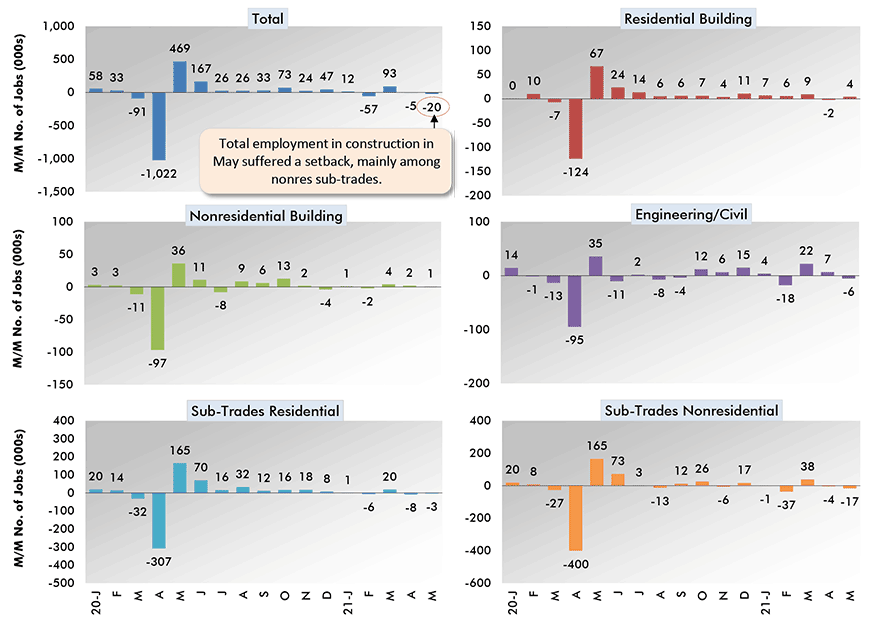
Chart: ConstructConnect.
Graph 3: Y/Y Jobs Change, U.S. Total Industry & Major Subsectors − May 2021
(based on seasonally adjusted payroll data)
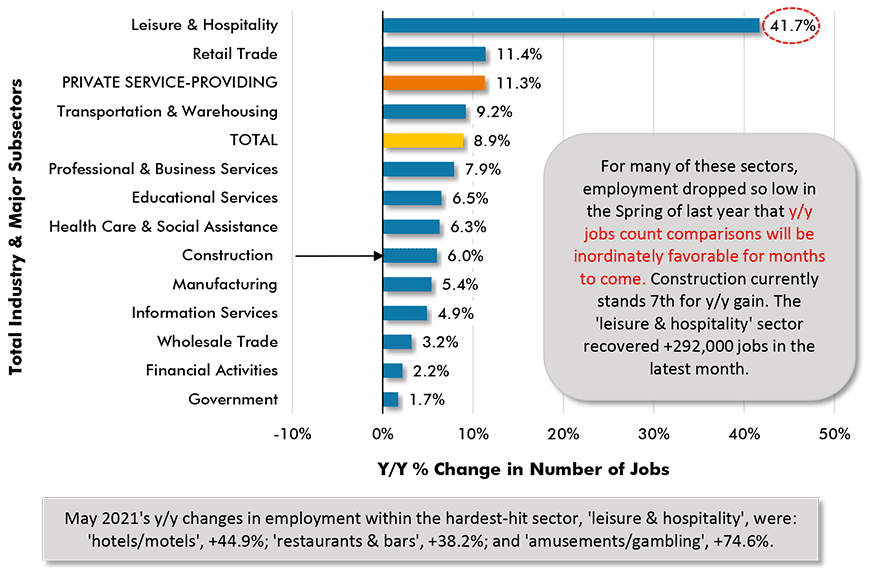
Chart: ConstructConnect.
Please click on the following link to download the PDF version of this article:
Economy at a Glance Vol. 17, Issues 84 and 85 – U.S. Half Million Jobs Increase in May still only Drop in Bucket – PDF
Alex Carrick is Chief Economist for ConstructConnect. He has delivered presentations throughout North America on the U.S., Canadian and world construction outlooks. Mr. Carrick has been with the company since 1985. Links to his numerous articles are featured on Twitter @ConstructConnx, which has 50,000 followers.


Recent Comments