A project to gather and analyze building performance data in B.C. is picking up steam as it releases a report on its second year.
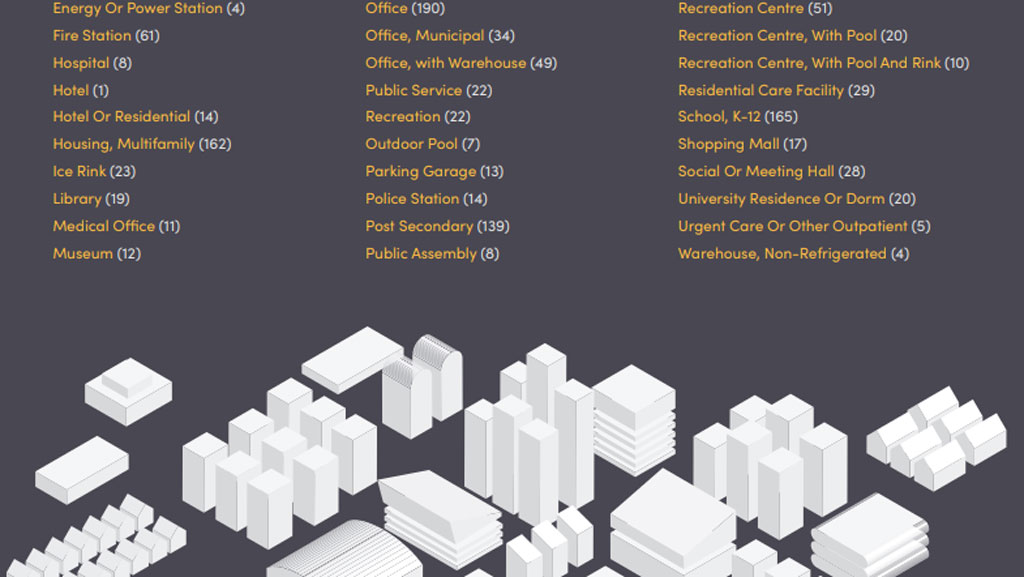
Building Benchmark BC’s second annual report showed participation growth among both property owners and jurisdictions. Total registered buildings more than doubled over the first year while registered floorspace increased 70 per cent.
Further, 16 jurisdictions now partner in the program, which has expanded into the interior of B.C., including the cities of Kamloops and Kelowna.
Building benchmarking is the process of collecting and monitoring energy and greenhouse gas data from a large number of buildings over time, allowing owners, managers, occupants and governments to compare the performance of similar properties.
The initiative’s goal is to inform and inspire public and private sector leadership on built-environment climate change solutions.
Donovan Woollard, the managing director of the OPEN Green Building Society, which is hosting the project, explained now that the project is in its second year, the data has become richer and the benefits to participants are increasing.
“We invested a lot in the software side to give richer insights,” said Woollard. “Our building scorecard section is a lot richer than last year.”
Scorecards now include a year-over-year comparison of energy and emissions performance; percentile ranking based on property type for various performance metrics; month-to-month performance compared with other buildings; an end-use breakdown of energy and greenhouse gas intensity; and suggestions on how to improve performance.
Woollard explained for private participants in the program, like Kelson Group, the data can provide valuable insight into the most effective ways to spend dollars. The company owns multi-unit residential buildings in B.C. and Alberta
“Benchmarking allows us to find out which buildings are the least efficient compared to others that are of a similar nature, which helps us prioritize,” said Kelson CEO Jason Fawcett in the report. “We’re already doing some benchmarking between our properties, but now we have that information from our peers, to learn if others are doing better or worse than us, and confirm if we are heading in the right direction or if there’s more we need to do.”
On the government side, Woollard noted benchmarking provides a massive head start as various jurisdictions are indicating building performance requirements are on the horizon.In 2023, the City of Vancouver will require owners of commercial and multifamily buildings larger than 5,000 square metres to benchmark and report the energy and emissions performance of their properties.
At the provincial level, B.C. will require greenhouse gases across the economy to drop 16 per cent below 2007 levels starting in 2025. It will also review its buildings and communities target and consider narrowing its percentage range.
“Some jurisdictions are introducing carbon pollution limits, where buildings need to be under a defined carbon intensity or face penalties. Our benchmark platform and dataset will help governments to set those targets and track compliance,” said Woollard. “I think there is benefit that comes from building your policy and capital allocation around real performance data.”
Now that the program’s data set has become larger and its tools more sophisticated, some insights have come to light.
For example, the 2020 data set revealed a significant drop-off in energy use intensity (EUI) for rec centres and other buildings where large groups typically congregate.
The report noted as these buildings shut their doors to reduce the spread of COVID-19, they shifted the heating, cooling and ventilation systems into idle. The team also saw energy use decline somewhat in office buildings and primary and secondary schools, as many employees began to work from home and teachers delivered their lessons remotely
While the program expected to see a corresponding increase in energy use intensity in condos and apartment buildings as a result of the shift, it never came.
It’s something Benchmark BC is looking into, but Woollard thinks it is possible that some building types aren’t adjusting their heating and cooling needs as closely to occupancy and usage as they could be.
“It suggests that we heat and cool some spaces the same way whether 100 or two people are there and that has major implications,” he said.
As for the future of the program, Woollard said he and his team intend to keep evolving how they track and manage the data.
“We have been on this path from colouring with crayons toward drawing with lasers,” he said, noting that they will continue to identify data gaps and sort out the complexities of different building types for reporting.
He also has a larger vision for how the data can be used.
“We want to aggregate it up to a city level and a provincial level so we can see the contributions to the economic model like employment potential,” said Woollard. “Being able to give that bigger economic picture helps cities and property managers. It helps reinforce not just climate mitigation but also jobs transition.”
Those interested in participating in the program can find more information at buildingbenchmarkbc.ca.
Follow the author on Twitter @RussellReports.


Recent Comments