U.S. Total Jobs Gain Impacted by GM Strike
November’s U.S. employment report from the Bureau of Labor Statistics (BLS) records a net increase in the nation’s jobs count of +266,000. Such a large gain, however, is somewhat distorted by a +54,000 increase in manufacturing jobs that comes on the heels of a -43,000 decline the month before. The big swing from one month to the next was mostly due to the onset of the strike at General Motors in October, followed by resolution four weeks later.
Therefore, the number carrying more significance for November’s jobs picture is the impressive uptick in private services-providing jobs, +206,000. While the average monthly increase in total jobs in America to date this year has been +180,000, down from +223,000 through the same January-November period of last year (i.e., -19%), the pullback in ‘services’ jobs has been far less severe, +149,000 compared with +161,000 (i.e., -7%).
Both the seasonally adjusted (SA) and not seasonally adjusted (NSA) unemployment rates stayed extremely tight in the latest reporting month, 3.5% and 3.3% respectively. The SA rate was down from 3.6% in October; the NSA rate was the same as in October.
Three-quarters of U.S. Services Jobs Climb Originated in Three Sectors
Within ‘services’, three-quarters of the +206,000 month-to-month climb in employment arose in just three sub-sectors, ‘education and health’, +74,000; ‘leisure and hospitality’, +45,000; and ‘professional and business services’, +38,000.
The ‘education and health’ increase of +74,000 was weighted more towards ‘health care and social assistance’ (+60,000) than ‘education’ (+14,000).
Hiring by government continued to be restrained, +12,000, and it was all at the local level, +13,000, as the states kept their staffing flat and Washington made a minor reduction, -1,000.
‘Transportation and warehousing’ (+16,000), ‘information services’ (+13,000) and ‘financial activities’ (also +13,000) added to their payrolls to almost the same extent. ‘Retail trade’ hiring was barely perceptible (+2,000).
Graph 1 shows the relative year-over-year changes in employment achieved by the economy’s major sub-sectors. ‘Education and health’ (+2.8%) has moved into first place ‒ a position previously often occupied by ‘construction’ ‒ with ‘leisure and hospitality’ (+2.5%) in second.
Construction has dropped back into third spot, tied with ‘professional and business services (both at +2.0%).
Graph 1: Y/Y Jobs Growth, U.S. Total Industry & Major Subsectors −
November 2019 (based on seasonally adjusted payroll data)
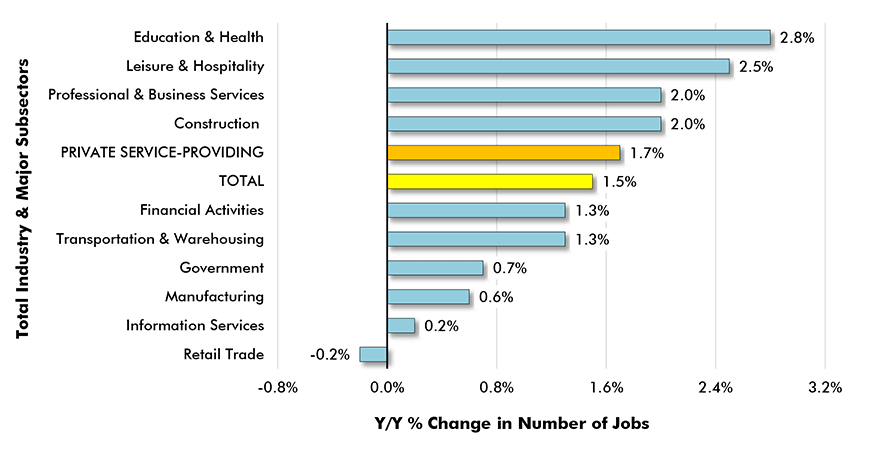
Chart: ConstructConnect.
Weaker U.S. Construction Jobs Performance Confirmed by Wages
Employment in the construction sector in November versus October was almost unchanged, +1,000. The monthly average construction sector jobs count with only December still to go has been +12,000, a drop of more than half (-55%) versus 2018’s comparable figure of +26,000.
Graph 2 showcases how put-in-place investment spending on total construction in the U.S. has been making no headway since the beginning of 2018.
Delving deeper into the latest construction data, there are signs that a revival in homebuilding may be emerging. Permits have been trending upwards faster than unit-starts. 1.4 million (annualized) units for starts is now within sight. For too long, 1.3 million was the best that could be hoped for.
Graph 3, however, shows one market segment of construction offering an extreme challenge, manufacturing. A peak was reached in mid-2015 and has not been replicated since.
Nor are wages in construction keeping up with what is occurring in the overall economy. In November for ‘all jobs’, not including supervisory personnel, hourly and weekly earnings were +3.7% and +3.0%. For construction workers, compensation gains rose less at +2.0% hourly and +2.5% weekly.
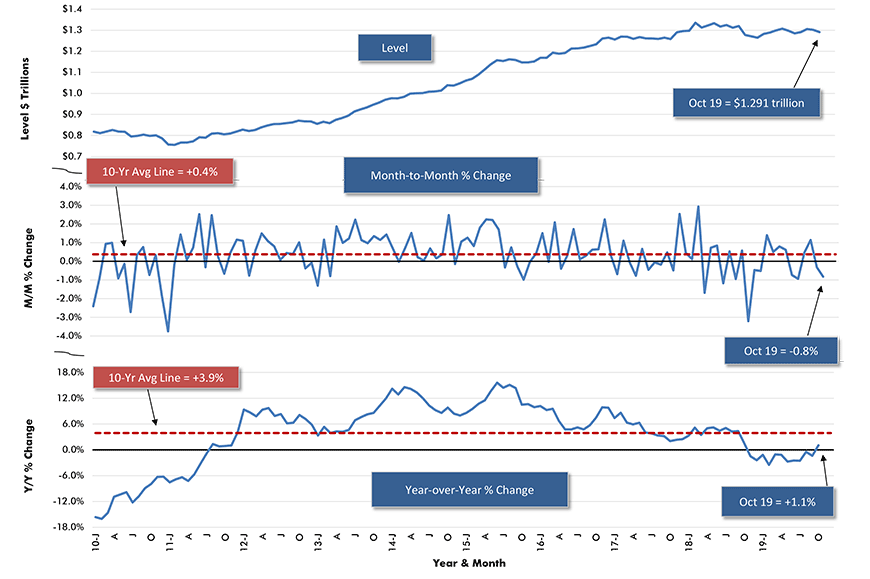
Chart: ConstructConnect.
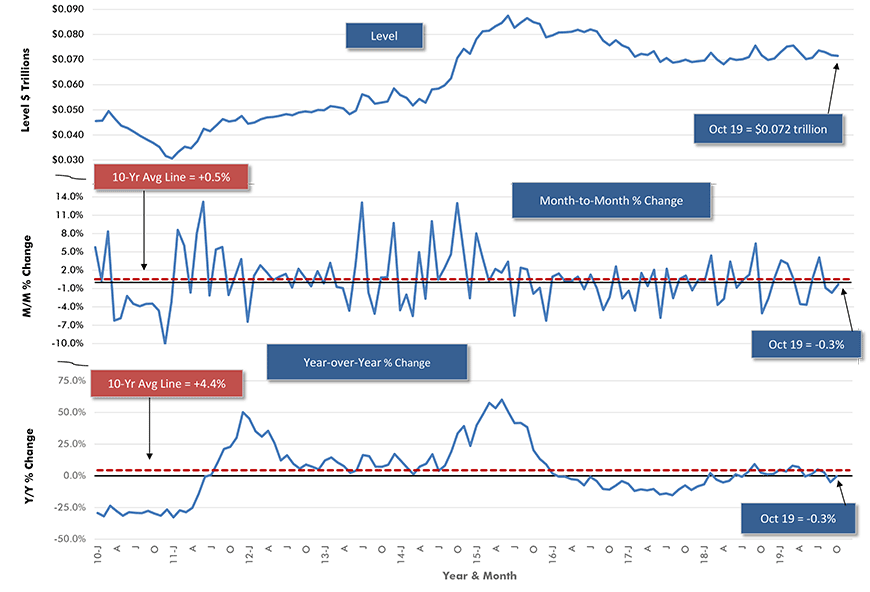
Chart: ConstructConnect.
Graph 4: Average Weekly Earnings Y/Y – ‘All Jobs’ and Construction
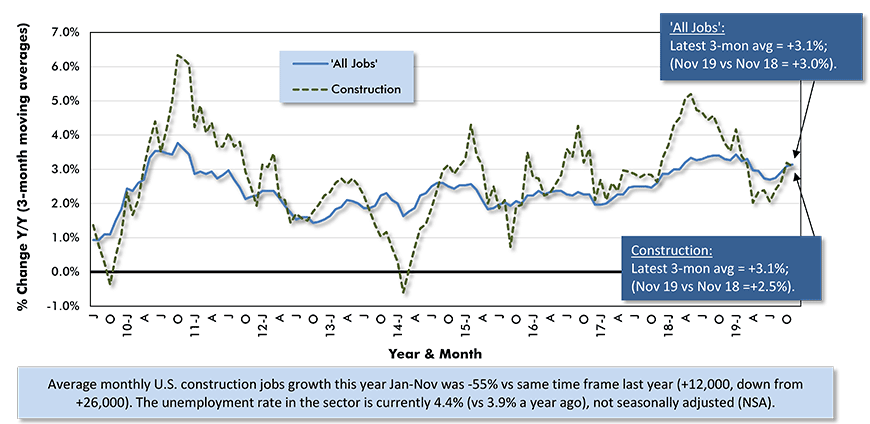
Chart: ConstructConnect.
Canadian Jobs Slump in November
According to Statistics Canada, the total jobs count north of the border fell by -71,000 in November. The decline was split almost evenly between full-time (-38,000) and part-time (-33,000) work. And it occurred almost entirely within the private (-69,000) (i.e., as opposed to public/government) sector.
Despite the employment plunge in the latest period, the 11-month average for Canadian jobs this year has been +26,000, up by more than half (+52%) from 2018’s comparable number of +17,000.
Especially noteworthy for Canada’s labour market this year has been the fact that services jobs have averaged +32,000 monthly, a doubling versus last year’s +16,000.
Canadian construction employment in November was +5,000, but only +12,000 year to date. But that’s a lot better performance than the nation’s manufacturing sector has been managing. The number of Canadian production-line jobs in November was -27,000, after a drop of -23,000 in October. Year-to-date manufacturing jobs are -44,000.
Table 1: U.S. and Canadian Jobs Markets – November, 2019
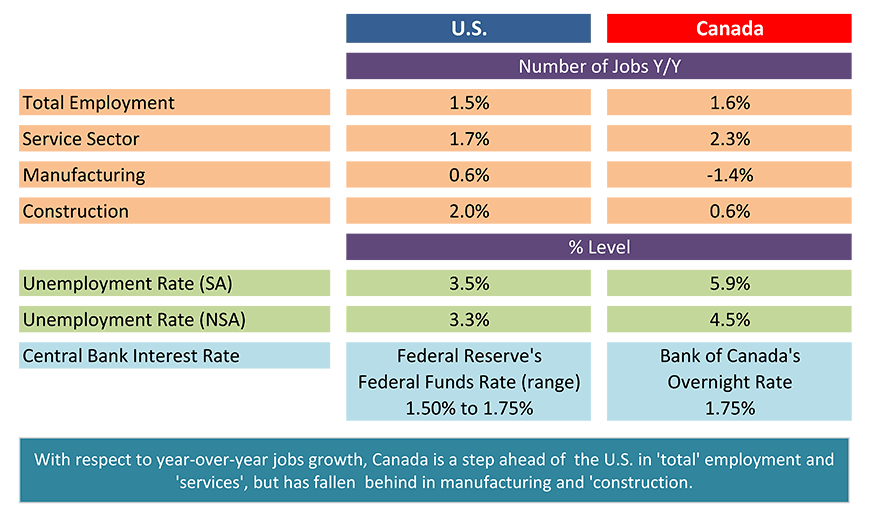
U.S. labor data is from a ‘payroll survey’ / Canadian labour data is from a ‘household survey’.
Canadian NSA unemployment rate ‘R3’ is adjusted to U.S. concepts (i.e., it adopts U.S. equivalent methodology).
Table: ConstructConnect.
Super Canadian Wage Growth
From Table 11 of Statistics Canada’s latest Labour Force Survey, both average hourly and weekly wages cross-country were +4.5% year over year in November. Those are rates of compensation increase well ahead of U.S. results.
With respect to other Canada-U.S. comparisons year over year, it’s Canada ahead in total jobs creation (+1.6% to +1.5%) and services jobs creation (+2.3% to +1.7%), but behind in manufacturing (-1.4% to +0.6%) and construction (+0.6% to +2.0%).
Provincially, the lowest unemployment rate in the land is still to be found in British Columbia, 5.0%. Three other provinces are tied for second place at 5.6% ‒ Quebec, Ontario and Manitoba.
As for employment growth year over year, Ontario (+3.2%) is leading the way, with much less-populous Prince Edward Island (+3.1%) only a step behind.
Table 2: Canadian Workforce Earnings,
Year over Year – November 2019
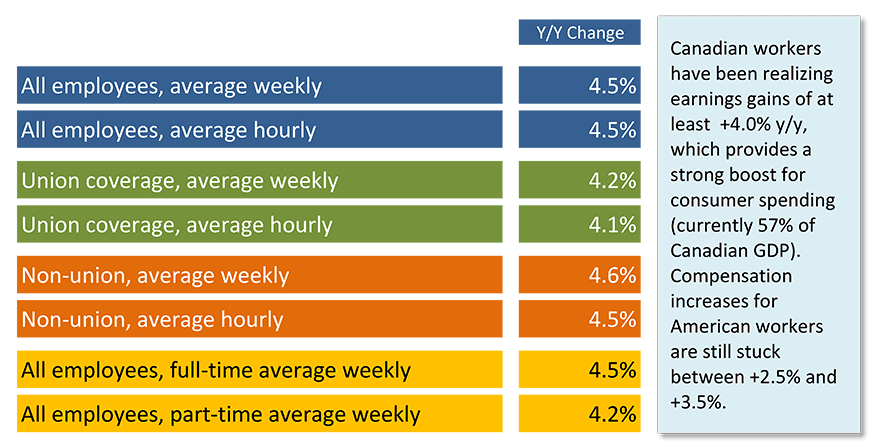
(‘Current’ means there has been no scaling back to remove effects of inflation.)
Table: ConstructConnect.
Graph 5: Canada’s Provincial Labour Markets – November 2019
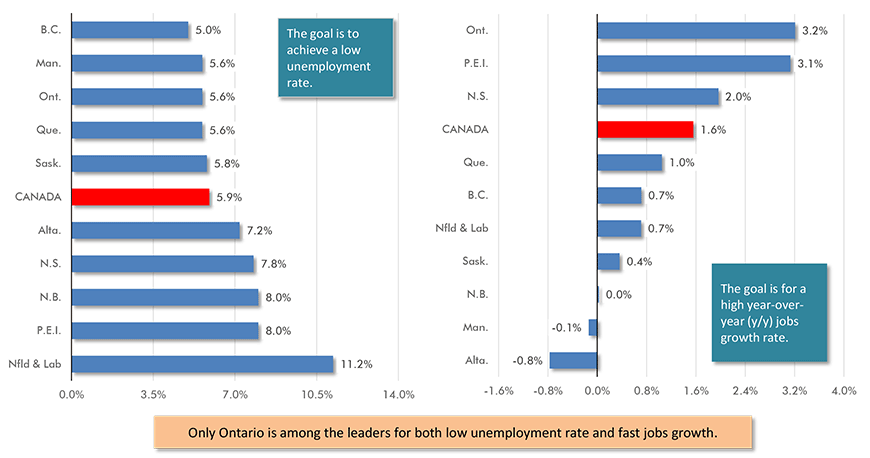
Chart: ConstructConnect.
Alex Carrick is Chief Economist for ConstructConnect. He has delivered presentations throughout North America on the U.S., Canadian and world construction outlooks. Mr. Carrick has been with the company since 1985. Links to his numerous articles are featured on Twitter @ConstructConnx, which has 50,000 followers.


Recent Comments
comments for this post are closed