U.S. March Retail Sales Worse M/M (-6.2%) than Y/Y (-3.8%)
The first cracks in U.S. consumer spending appeared in the Census Bureau’s report titled Advance Monthly Sales for Retail and Food Services, March 2020. Retail sales comprise about 40% of consumer spending and consumer spending makes up 70% of gross domestic product (GDP).
This article sets out the March retail sales figures in four successively more dramatic eye-popping charts.
Leaving aside ‘food services’ for the moment, let’s begin with retail alone as appearing in Graph 1. Total retail sales in the latest month dropped in value by $29 billion. On a year-over-year basis, they were -3.8%. It was their first y/y negative performance since the 2008-2009 recession.
In most instances, for a data series, the year-over-year percentage change will be greater than the month-to-month change. Generally, more happens in a year than a month.
With respect to U.S. retail sales in March, however, the month-to-month change, at -6.2% was considerably more alarming than the year-to-year change, -3.8%. The deterioration didn’t take its own sweet time, it happened overnight.
Graph 1: Total Retail Sales in U.S. Monthly
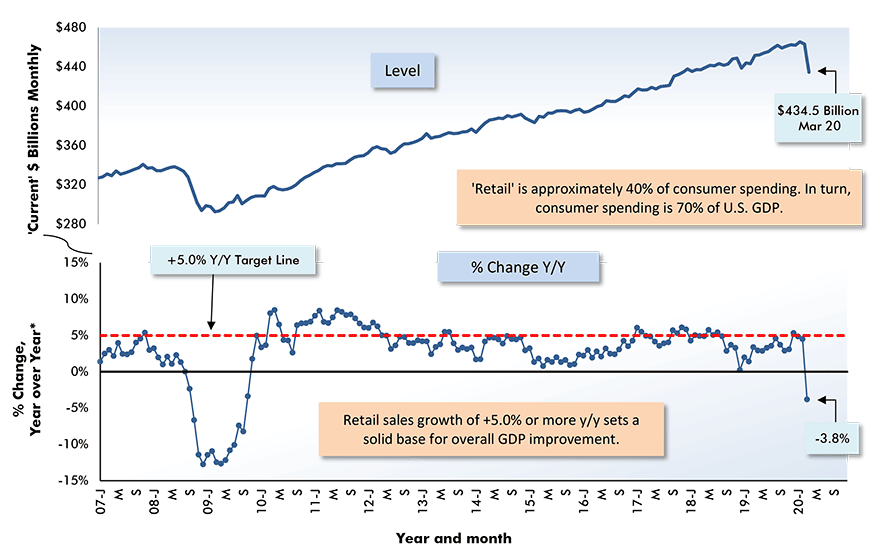
Adjusted for seasonality and trading day differences, but not for price changes (i.e., figures are in ‘current’ dollars).
Auto Sector Sales Lose Share to Grocery Stores
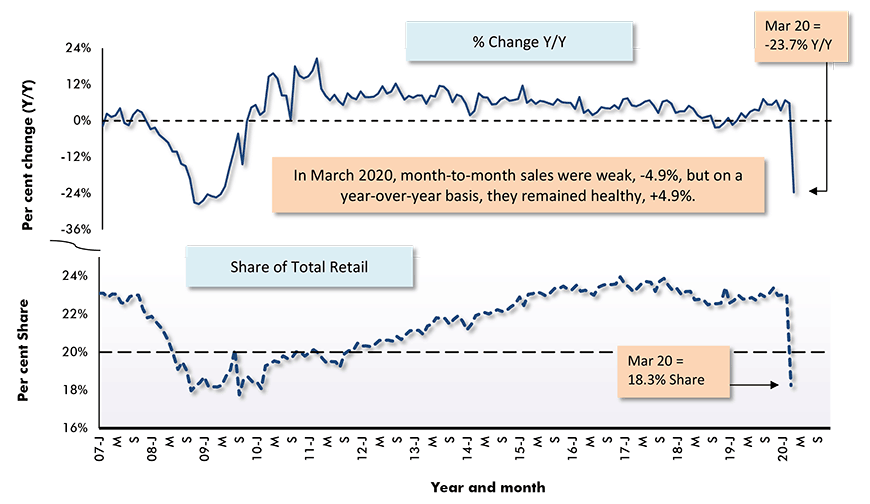
Motor vehicle and parts sales have claimed a more than 20% share of total retail sales for the past eight years. That all changed in the latest month, March 2020. Suddenly, auto sector sales plunged from 23.0% of total retail to only 18.3%.
Motor vehicle and parts sales were down by about a quarter in March both year over year (-23.7%) and month to month (-25.6%).
The nearly five percentage point share of total retail that motor vehicle and parts lost in the latest month were almost all picked up by ‘food and beverage stores’, which moved from 14.1% to 18.9%. Grocery store sales have soared so far during the pandemic.
There’s been some degree of panic buying. Stockpiling of some goods at home has resulted in shortages in the store of sanitizing and paper products, as well as other items such as hair dye.
Included among disappearing sanitizing and paper products are disinfecting wipes, baby wipes, paper towels, tissue paper and toilet paper.
Graph 2: U.S. Motor Vehicle & Parts Sales Within Total Retail
Coronavirus Wave Strikes Food Services and Drinking Places First
As bad as the current circumstances have been for total retail sales (-6.2% m/m and -3.8% y/y), they’re still a far cry from the despair evident at ‘food services and drinking places’ (Graph 3).
Revenues rung up by restaurants and bars in March were -26.5% m/m and -23.0% y/y. Even in the darkest days of the last recession, there wasn’t the decimation in eat-drink-and-be-merry sales that are being seen today.
Restaurants and bars were among the first establishments to be closed when limitations on group gatherings were imposed or highly recommended in most of the nation in mid-March. Some eating places are continuing in operation by bumping up their offerings of take-out and delivery, but this earns them only a fraction of their former take.
The total job loss in America in March was a staggering -701,000. Almost 60% of that decline occurred at ‘food services and drinking places’.
Graph 3: Year-Over-Year (Y/Y) U.S. Monthly Sales,
Retail vs Food Services & Drinking Places
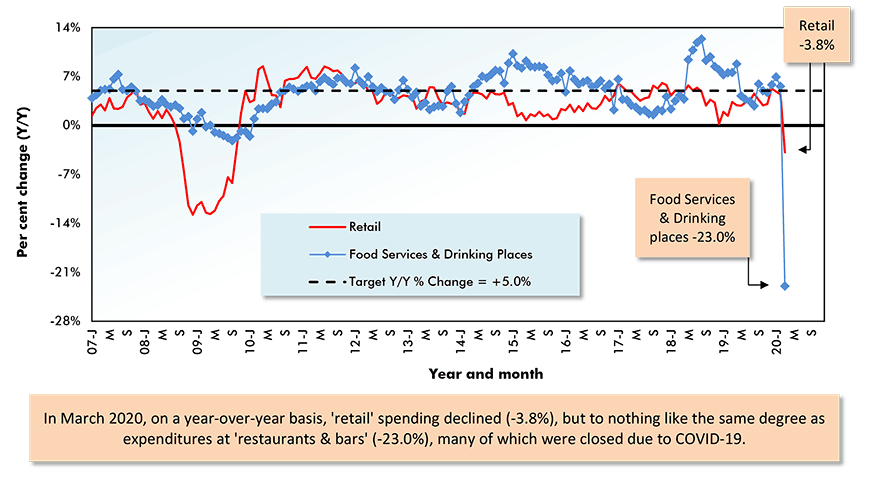
Current dollars, with adjustments made for seasonal variation, holiday & trading day differences, but not for price changes.
Not Every Aspect of Retail was Flung to the Mat in March
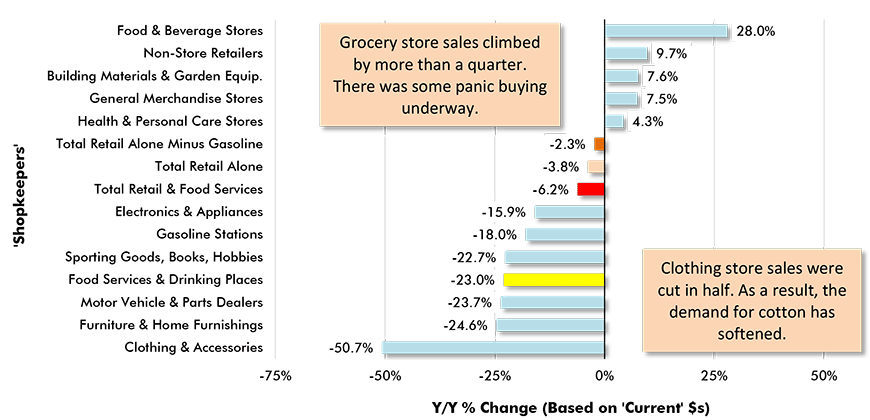
Not every aspect of retail was flung to the mat in March. Five shopkeeper sub-categories experienced sales that were either great or not bad. As previously mentioned, ‘food and beverage store’ sales were outstanding. They climbed by more than a quarter both year over year, +28.0%, and month to month, +25.6% m/m.
‘Nonstore retailer’ sales were +9.7% y/y and +3.1% m/m. This category includes vendors who sell primarily through Internet platforms. If anything, the percentage increases for nonstore retailers surprise on the downside. An easy supposition is that they would have skyrocketed in the latest month, due to so many consumers sheltering at home.
Watch for April’s ‘nonstore’ results. They should impress.
The other three sub-categories with increases in sales in March were: ‘building materials and garden equipment’, +7.6% y/y and +1.3% m/m; ‘general merchandise stores’, +7.5% y/y and +6.4% m/m; and ‘health and personal care stores’ (pharmacies), +4.3% both y/y and m/m.
On the flip side, though, four shopkeeper sub-categories suffered year-over-year declines in revenue that exceeded -25.0%, or one quarter. Included in this list of the battered were: ‘sporting goods, hobby, musical instrument and book stores’, -22.7%; the aforementioned ‘motor vehicle and parts dealers’, -23.7%; ‘furniture and home furnishing stores’, -24.6%; and worst of all, ‘clothing and clothing accessory stores’, -50.7%.
‘Gasoline station’ sales were -18.0% y/y. Gas stations are used to wide swings in their earnings because the price of their main product, petrol, can shoot higher for months at a time, then descend markedly lower for a while. The international price of oil, on which the domestic price of gasoline depends, is currently in a decidedly down phase. In fact, the global price of oil has touched as low as zero. Some producers are, at the margin, paying customers to take excess supply of their hands.
The gasoline sub-index in March’s Consumer Price Index (CPI) report was -10.2% year over year.
Graph 4: U.S. Retail & Food Services Sales Y/Y – March 2020
Alex Carrick is Chief Economist for ConstructConnect. He has delivered presentations throughout North America on the U.S., Canadian and world construction outlooks. Mr. Carrick has been with the company since 1985. Links to his numerous articles are featured on Twitter @ConstructConnx, which has 50,000 followers.


Recent Comments