Unemployment Rate at 14.7% could have been Worse
It could have been worse. I thought it would be worse. Next month’s figure will probably be worse. I’m speaking of April’s U.S. seasonally adjusted (SA) unemployment rate, as calculated by the Bureau of Labor Statistics (BLS). It came in at 14.7%, after being just 4.4% in March.
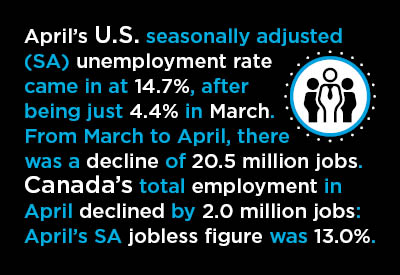
If you’re looking for a figure that’s jaw-dropping, turn to the total number of jobs in the country. From March to April, there was a decline of 20.5 million.
There’s been no comparable degree of negativity in the labor market since the Great Depression, nine decades ago. (In the 2008-09 recession, the SA unemployment rate maxed out at 10%; in the Great Depression, at 25%. I had expected April 2020’s figure to be closer to 20%.)
There’s been foreshadowing of bad news to come on the month-to-month employment front from the weekly ‘initial jobless claims’ results. During the past seven weeks, 33 million Americans have joined the ranks of first-time (in this cycle) unemployment insurance seekers.
April’s monthly labor force survey was carried out in the middle of the month. Therefore, it doesn’t include the staffing cutbacks that have occurred since then. The latest two weeks of initial jobless claims have summed to 7.0 million.
Graph 1: U.S.: Month-to-month Total Employment Change
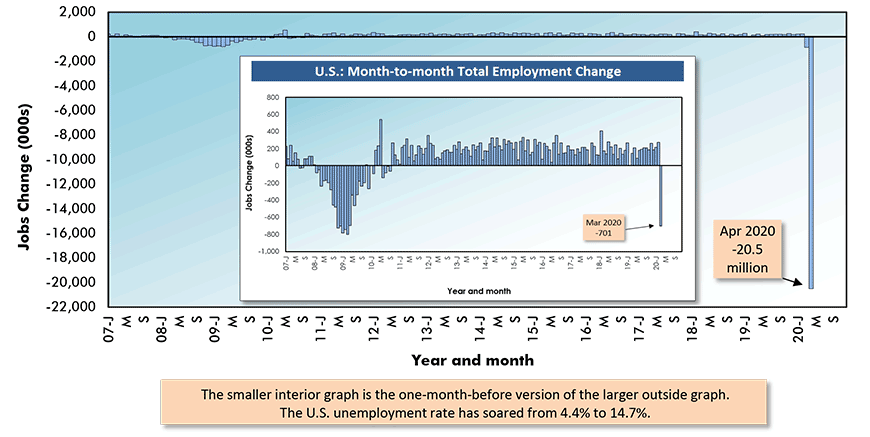
Chart: ConstructConnect.
Nearly a Million Individuals Cut Loose from U.S. Construction Payrolls
The construction sector in April saw 975,000 individuals cut loose from payrolls. The jobs carnage was more extreme among specialty trade contractors (-691,000) than general contractors (-284,000).
Employment in heavy and engineering construction (-79,000 jobs) wasn’t affected as severely as in building construction (-206,000).
Construction’s not seasonally adjusted (NSA) unemployment rate soared in the latest month to 16.6%. In April of 2019, it had been 4.7%.
Surface appearances notwithstanding, the construction sector – from a maintaining-employment point of view – was relatively fortunate in April. It continued to be treated as ‘essential’ under almost all state government work-or-not-work (i.e., ‘shelter at home’) directives.
Construction’s unemployment woes pale compared with those of the ‘leisure and hospitality’ sector, where April’s jobless rate was a mindboggling 39.3%. That’s more than a third of workers in the hospitality and restaurant/bar business being sidelined. Most, but not all of them, are from a younger-leaning age cohort of the labor force.
The industrial sectors with the biggest job losses month-to-month in April were as follows: no surprise, ‘leisure and hospitality’, -7.7 million; yes, a surprise, ‘education and health services’, -2.5 million; ‘professional and business services’, -2.1 million; ‘retail trade’, also -2.1 million; and manufacturing, -1.3 million.
Why the surprise expressed concerning health services jobs? One might easily assume that with all the medical attention being paid to coronavirus patients, the health care industry would be (unwillingly) thriving. What such an assumption overlooks, though, is that all manner of elective surgery (heart, cancer, etc.), with the accompanying fees that pay hospital bills, is being postponed indefinitely.
Graph 2: U.S. Total Employment
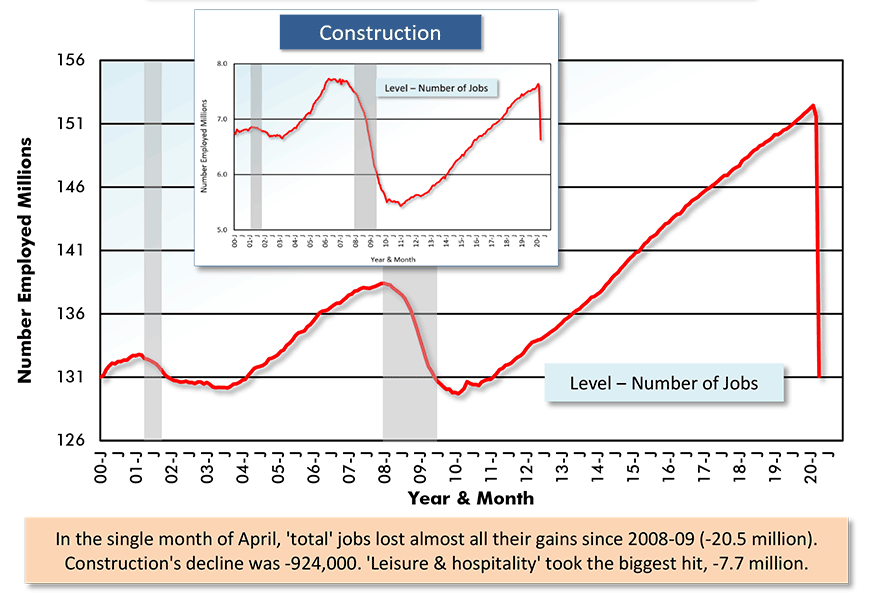
Latest data points are for April, 2020 / Based on seasonally adjusted (SA) data.
Chart: ConstructConnect.
Graph 3: U.S. Total Employment
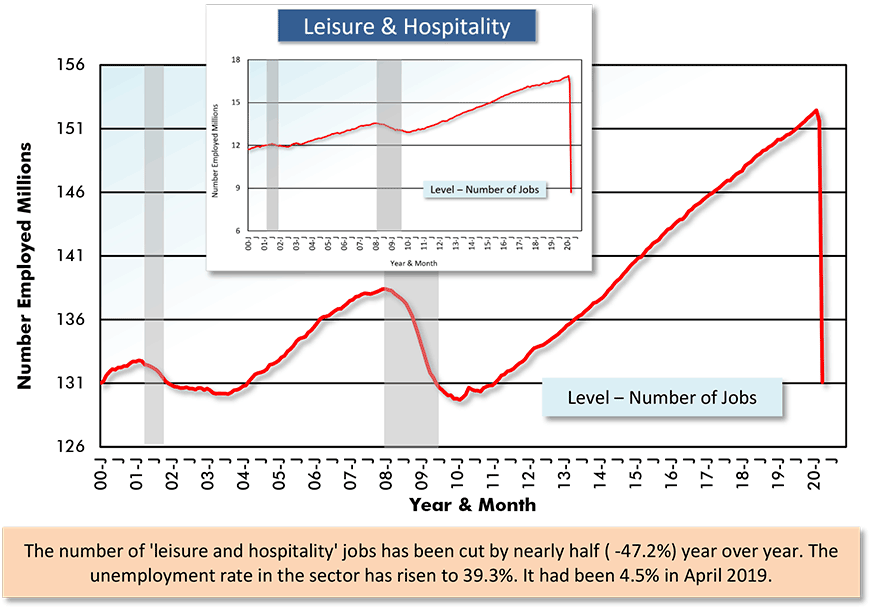
Latest data points are for April, 2020 / Based on seasonally adjusted (SA) data.
Chart: ConstructConnect.
Canada Matches U.S. in Jobs Contraction
Canada’s total employment in April declined by 2.0 million jobs, according to Statistics Canada. On a per capita basis (i.e., the population of the U.S. is nine times Canada’s), that’s a month-to-month jobs shrinkage about on a par with America’s.
But where Canada did come out a little better than the U.S. was with respect to unemployment rate. April’s SA jobless figure north of the border was 13.0% (compared with 14.7% for south of the border). In March, Canada’s unemployment rate was 7.8%.
The unemployment rate for Canadian workers aged 15 to 24 shot up to 27.2% in the latest month, from 16.8% in March.
Also noteworthy is that 1.9 million of the 2.0 million Canadian jobs-loss in the latest month was in the private sector. The public sector rollback was a comparatively miniscule -77,000 jobs.
Construction employment in Canada in April was -314,000 jobs. Three other sectors with large job declines were: ‘wholesale and retail trade’, -374,000; ‘accommodation and food services’, -321,000; and ‘manufacturing’, -267,000.
April’s month-to-month employment changes in Canada’s four most populous provinces were: Ontario, -689,000; Quebec, -557,000; British Columbia, -264,000; and Alberta, -244,000.
Queen’s Park, the provincial seat of government in Ontario, first allowed construction activity to continue, then revoked the privilege. (Now, in May, Ontario construction work is a ‘go’ again.)
Graph 4: Canada: Month-to-month Total Employment Change
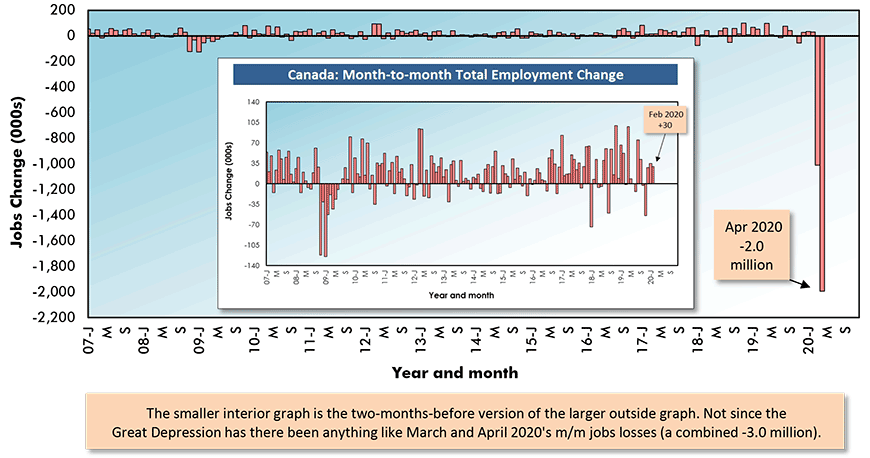
Chart: ConstructConnect.
Graph 5: Canada Total Employment
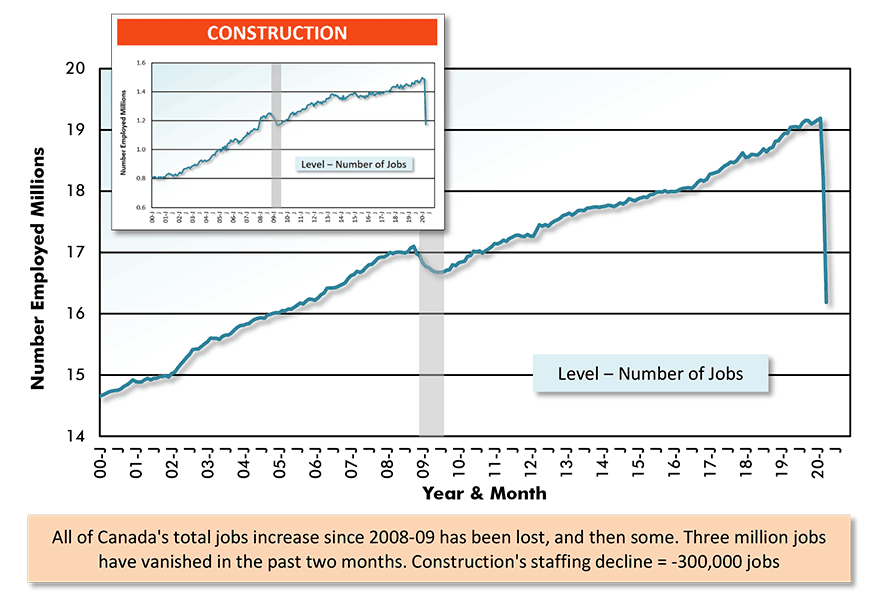
Latest data points are for April, 2020 / Based on seasonally adjusted (SA) data.
Chart: ConstructConnect.
Graph 6: Change in Construction Employment – Canada vs U.S.
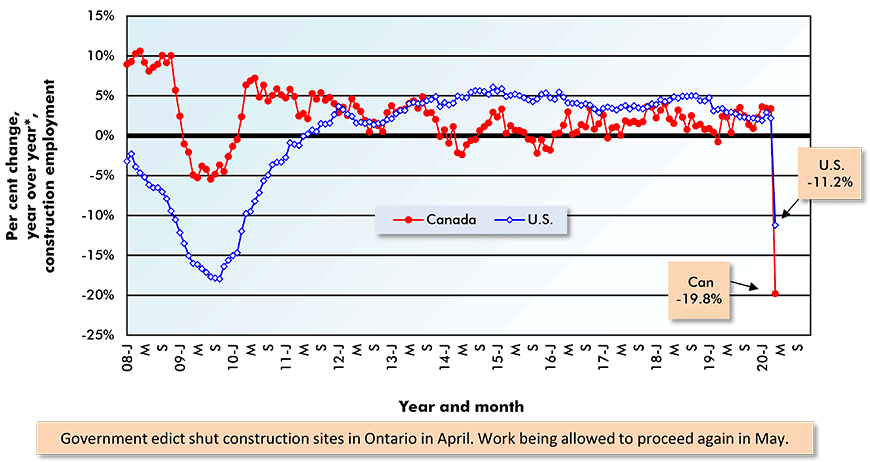
"Year over year" is the monthly figure versus the same month of the previous year.
Chart: ConstructConnect.
Table 1: U.S. and Canadian Jobs Markets – April 2020
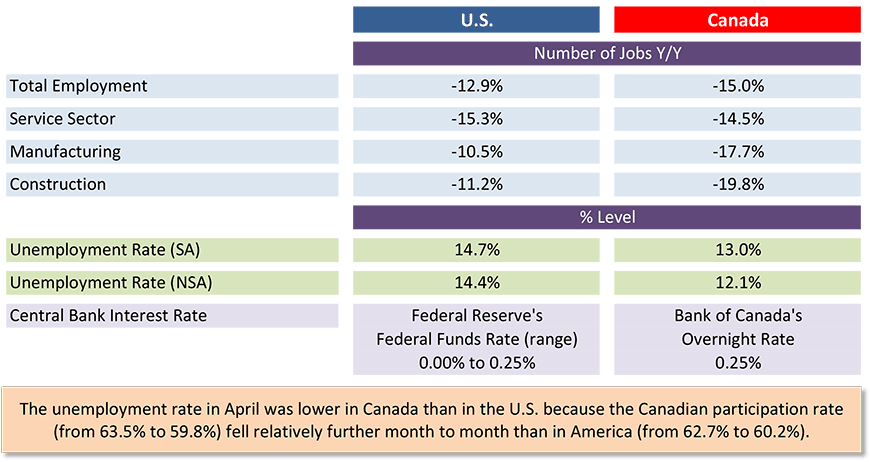
U.S. labor data is from a ‘payroll survey’ / Canadian labour data is from a ‘household survey’.
Canadian NSA unemployment rate ‘R3’ is adjusted to U.S. concepts (i.e., it adopts U.S. equivalent methodology).
Table: ConstructConnect.
Worst Provincial Unemployment Rate? Quebec
For the province of Newfoundland and Labrador, this is a ‘heady’ moment. It no longer has the highest unemployment rate in the land. Its 16.0% rate is second to Quebec’s 17.0%.
Presently, there isn’t a single province with an unemployment rate below a double-digit percentage.
One final note concerning the Canadian economy is warranted. Canada Mortgage and Housing Corporation (CMHC)’s latest housing starts figures have just been published and in April, they were 166,000 units seasonally adjusted and annualized (SAAR). In most months during the past decade, they’ve hovered in close proximity to 200,000 units SAAR.
Graph 7: Canada’s Provincial Labour Markets – April 2020
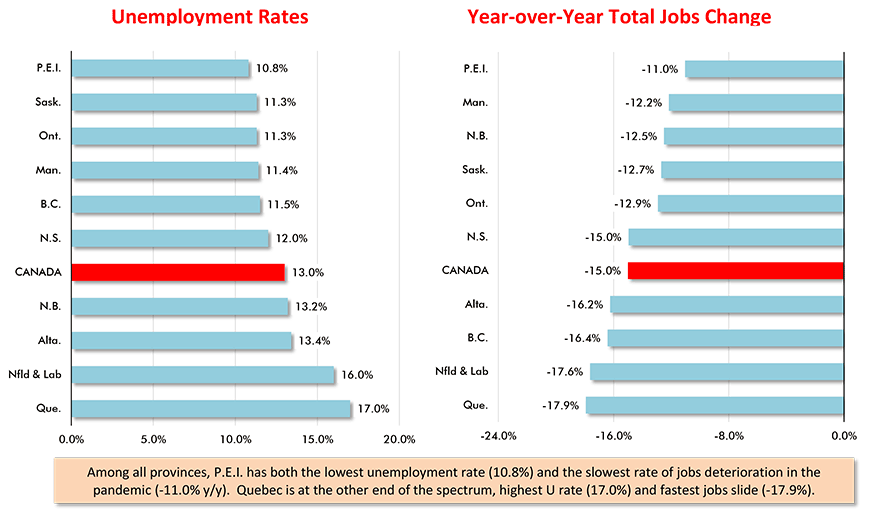
Chart: ConstructConnect.
Alex Carrick is Chief Economist for ConstructConnect. He has delivered presentations throughout North America on the U.S., Canadian and world construction outlooks. Mr. Carrick has been with the company since 1985. Links to his numerous articles are featured on Twitter @ConstructConnx, which has 50,000 followers.


Recent Comments
comments for this post are closed