There’s a two-sided nature to exchange rate stories that make them particularly interesting. If the currency of Nation A is strengthening relative to the currency of Nation B, then there is an equal and opposite weakening of the currency of Nation B relative to the currency of Nation A.
There is always a flip side. In the realm of exchange rates, there is an ‘obverse’ and an ‘inverse’ to every currency movement.
Usually, the wording of currency rate transactions asks something like, “How many Euros or pounds sterling or pesos or yen will one American dollar be able to purchase?”
If the figure increases over time, that’s appreciation; if it decreases, then depreciation.
An appreciating currency in Nation A versus Nation B makes imports into A from B cheaper and travel from A to B more of a bargain.
The U.S. has long possessed a strong currency. Even during the 2008-2009 global financial crisis, foreign money flowed into the ‘greenback’ because it was judged a ‘safe harbor’.
One of the chief determinants of exchange rates is relative interest rates. International currency investors ‘arbitrage’ yields (i.e., borrow from the one place to make a higher return in another).
The Federal Reserve has announced an intention to keep U.S. interest rates near zero in nominal terms out to 2023 at least. There are reasons to suppose this will be an almost impossible task.
U.S. Dollar Retreats vs Japanese Yen & Swiss Franc
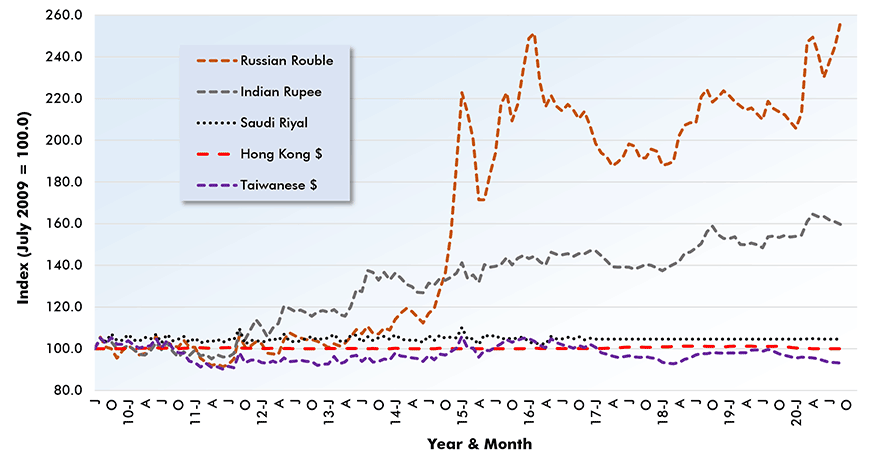
Graphs 1 to 3 adopt an ‘index’ format to lay out the strength of the U.S. dollar versus 15 foreign currencies. The index methodology enables 15 separate graphs to be condensed into three.
For each international currency, the U.S. dollar exchange rate in July 2009 (i.e., the first month following the Global Financial Crisis) is set equal to 100.0. The exchange rate in each subsequent month is divided by July 2009’s figure and multiplied by 100.
When the curve is rising, the U.S. dollar is growing stronger. One U.S. dollar can buy more units of the foreign currency. (On the flip side, the other nation’s currency is becoming weaker.)
With all the series having the same starting point (July 2009 = 100.0), the journeys to ‘ending points’ tell crucial stories.
From all three graphs, the U.S. dollar has appreciated significantly versus the Brazilian real, the Russian rouble, the Mexican peso and the Indian rupee over the past ten years.
From an opposite perspective, the real, rouble, peso and rupee have experienced substantial adjustments downwards.
Setting aside the peso in Graph 1, the U.S. dollar appreciated versus the pound, Canadian dollar (‘loonie’), Euro and Japanese yen until late-2015. The relationships have stayed fairly stable since then, although a point to note is that the greenback has been gradually softening versus the yen for about five years.
From Graph 2, and leaving aside the Brazilian real, U.S. dollar movements relative to the Australian dollar, Chinese yuan, South Korean won and Swiss franc have been in a consistently narrow range. The only weakness (and it’s been mild) shown by the greenback, of late, has been with the Swiss franc.
The Chinese government deliberately keeps the yuan close to the U.S. dollar.
There is a similar situation for two of the currencies in Graph 3. The monetary authorities in Saudi Arabia and Hong Kong target parity for their home currencies with the U.S. dollar.
Also, the ‘New Taiwan dollar’ (Graph 3) has been strengthening a little compared with the U.S. dollar. (Its curve has been marginally declining.)
(Indexed to July 2009, the first month following the Global Financial Crisis)
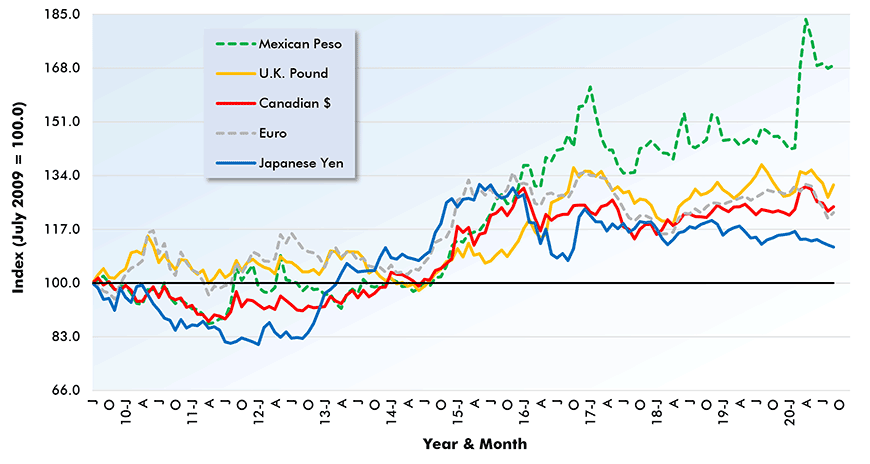
Chart: ConstructConnect.
(Indexed to July 2009, the first month following the Global Financial Crisis)
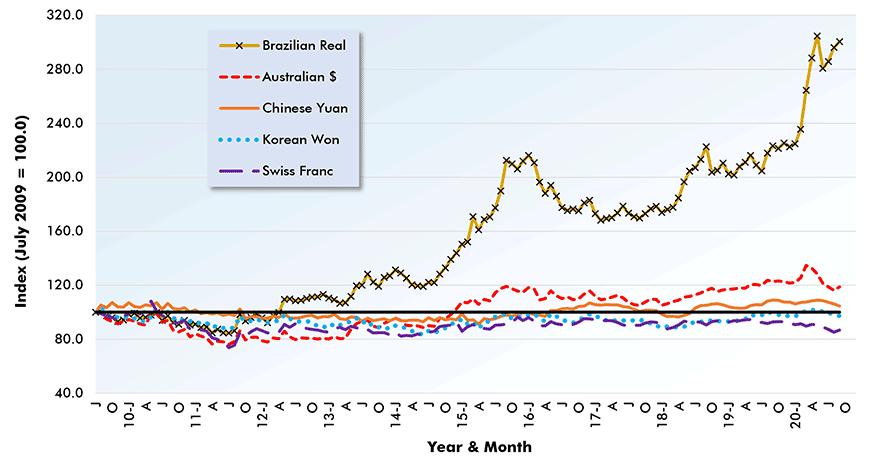
Chart: ConstructConnect.
(Indexed to July 2009, the first month following the Global Financial Crisis)
Hong Kong $ & Saudi Riyal deliberately kept at, or near, parity with U.S. $.
Chart: ConstructConnect.
Canada’s Currency Offers Buffer to Deglobalization
Graph 4 highlights how the Canadian dollar has been performing versus five major international currencies, using the same index methodology as employed for the U.S. dollar in Graphs 1 to 3.
The ‘loonie’ has been making gains versus the peso; has been staying about even with the pound and the Euro; and has been falling behind the yen and the greenback.
The second largest source, after the U.S., of Canadian imports is China. Because Beijing won’t let its yuan/renminbi stray too far from the greenback, the loonie’s relationship to the yuan is about the same as it is for the U.S. dollar.
The loonie would benefit from revitalized world trade that would ‘juice’ demand for and the prices of the raw materials in Canada’s resource sector and bring more spark back to the nation’s principal equity market, the Toronto Stock Exchange.
Graphs 5 and 6 are a departure from the first four graphs in this article. They show the history of the actual exchange rate between the greenback and the loonie. The curve in Graph 6 (Canadian dollars that can be purchased with one U.S. dollar) is the inverse of the curve in Graph 5 (greenbacks, or the fraction thereof, that can be bought with one loonie).
During most of the past twenty years, the Canadian dollar has been valued at less than parity with the U.S. dollar. The low-valued loonie and proximity to the U.S., however, presently provide Canadian entities with a unique advantage. As U.S. firms pursue deglobalization (a fallout from the pandemic), linkages with Canadian suppliers are more likely to be left intact.
As one example, Ford Motors has just promised $2 billion in capital spending at its facilities in Oakville, Ontario to go towards electric vehicle (EV) production.
(Indexed to July 2009, the first month following the Global Financial Crisis)
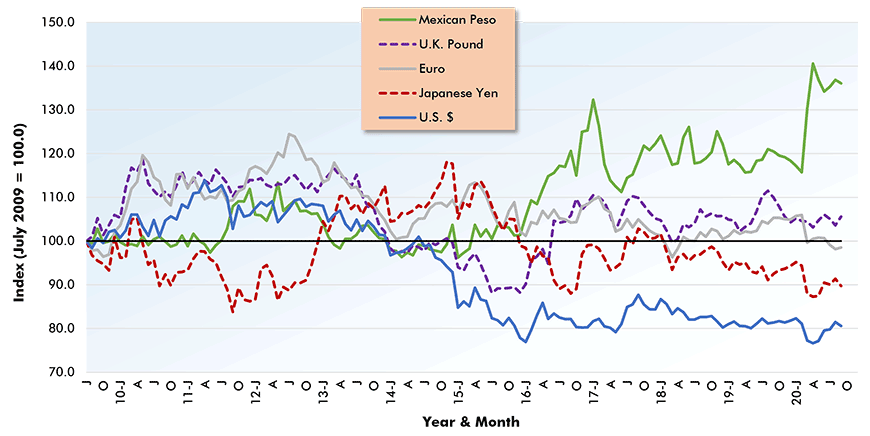
Chart: ConstructConnect.
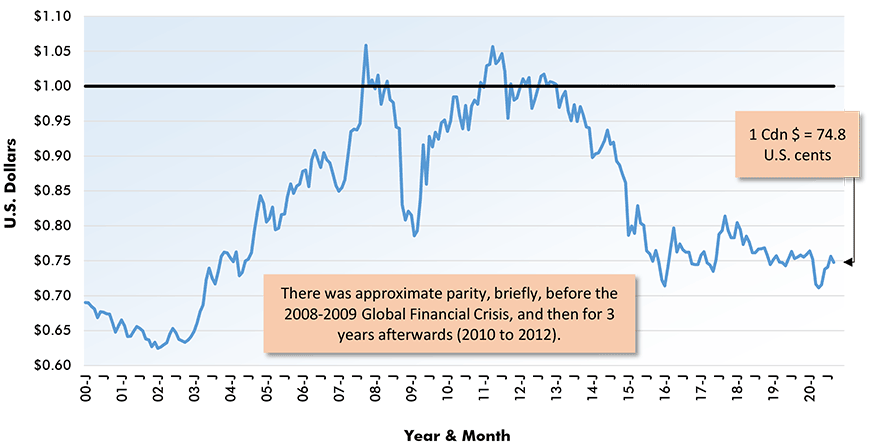
Chart: ConstructConnect.
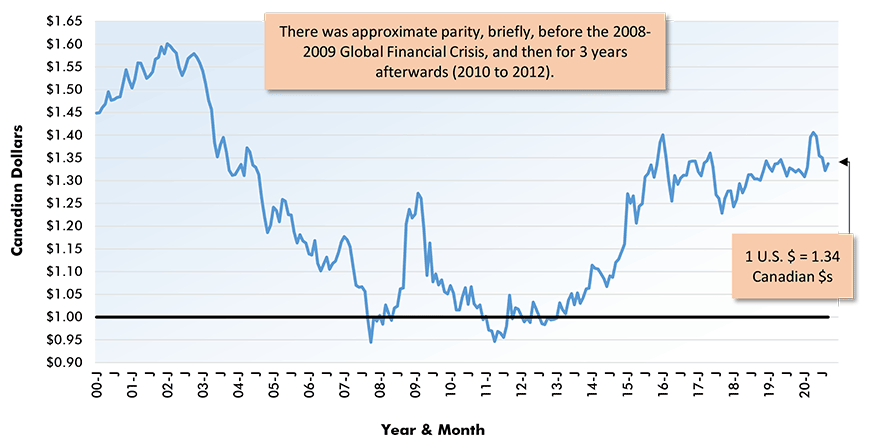
Chart: ConstructConnect.
An Inhibiting Currency Impact on Foreign Capital Inflows
The U.S. Federal Reserve has promised low interest rates over a lengthy horizon.
Low interest rates do not offer support for the value of a nation’s currency. If international investors believe they can make more elsewhere, that’s where they’ll send their money.
The latest (July) U.S. foreign trade results revealed a deficit in ‘goods’ trade that was nearly one trillion dollars, sitting on the cusp of a new record shortfall.
If the U.S. dollar falls due to the Fed’s low interest rate policy, help may arrive for the ‘goods trade’ deficit. Imports will become more expensive and exports less pricey. The extent of the ‘goods trade’ correction will matter greatly.
There will be a tough juggling act to pull off. Continuing to attract the capital inflows needed to finance a sizable ongoing goods trade deficit will be made doubly hard by an exchange rate drop.
It’s one thing to ask foreign investors to accept a lower interest rate. It’s an extra hitch to have them anticipate that when they eventually withdraw their funds, it might be at an eroded exchange rate, reducing whatever returns seemed possible at the outset.
Alex Carrick is Chief Economist for ConstructConnect. He has delivered presentations throughout North America on the U.S., Canadian and world construction outlooks. Mr. Carrick has been with the company since 1985. Links to his numerous articles are featured on Twitter @ConstructConnx, which has 50,000 followers.


Recent Comments
comments for this post are closed