
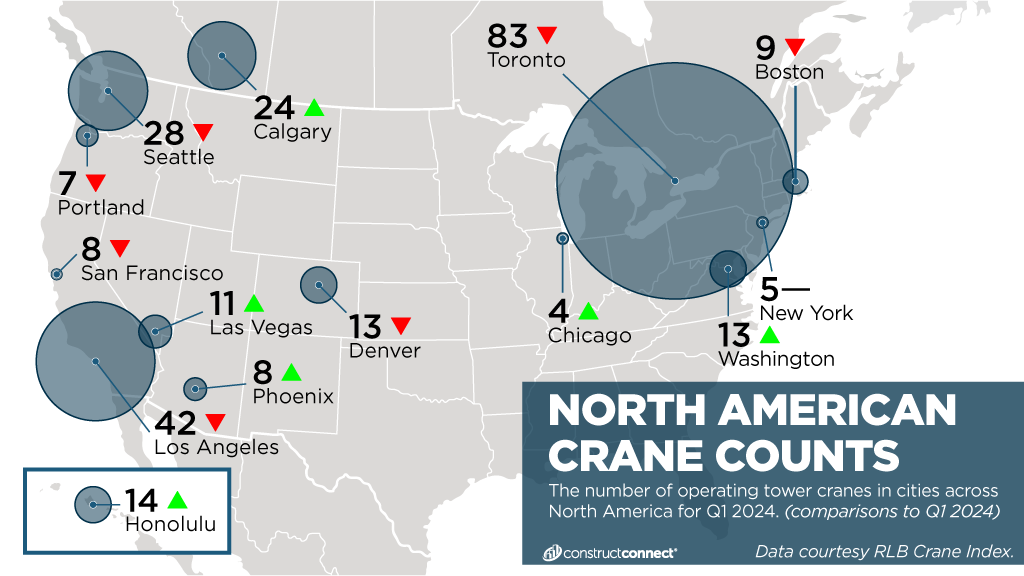
TORONTO — Toronto remained the champion of Rider Levett Bucknall’s (RLB) biannual crane count of 14 North American metropolitan areas in Q3 2024.
The numbers for the Ontario city are no longer quite as overwhelming as previously reported, however, because the crane data is now being gathered from a smaller region.
RLB has announced it is now prioritizing the downtown core area of Toronto, which has the highest density of construction projects. The revised radius is 3.5 kilometres from the Bloor Street West and Avenue Road centre.
As of Q1 2024, the core area contributes to approximately 35 per cent of the overall Toronto crane count. The new crane count for Toronto was 83.
The Q1 Toronto crane count, using a larger region, determined there were 221 cranes in the city.
Q3 counts were collected in August and the data was released Oct. 7. It tallies cranes in 14 cities across the continent where RLB has offices.
In Toronto, the residential sector leads with 43 cranes, an increase of 11, while the mixed-use sector decreased to 26 cranes. Growth is also evident in the health care, education, public assembly and transportation sectors.
The Toronto data suggests a recovery from the construction slowdown observed in Q1 2024, indicating renewed growth in development activities, stated RLB.
Los Angeles had the second highest crane count in Q3 with 42, down eight from Q1.
The other three cities in the top five for Q3 were Seattle, 28, down 10 from Q1; Calgary, 24, up four from Q1; and Honolulu, 14, down two from Q1.
Others in random order are Denver, 13, down one from Q1; Washington, D.C., 13, up one from Q1; Boston, nine, down six from Q1; Las Vegas, 11, up one from Q1; Portland, seven, down two from Q1; San Francisco, six, down two from Q1; New York, five, unchanged from Q1; Chicago, four, down five from Q1; and Phoenix, eight, up one from Q1.
Overall, in Q3 2024, the construction landscape held steady across North America, as the rate of decrease competes with the rate of cranes breaking ground, RLB stated.
The majority of the cranes continue to be stationed at residential and mixed-use projects, making up 69 per cent of the overall count. The survey reports a slight decrease of five per cent (15 cranes) from its Q1 2024 edition of the RLB Crane Index.
Of the 14 cities surveyed, four experienced a decrease of greater than 20 per cent; seven increased; and three held steady.
The mixed-use sector continues to dominate crane activity, reflecting strong demand for diverse developments. Major projects in sectors such as health care, education and infrastructure are driving investment and construction efforts.
Despite challenges of high office vacancy rates in certain areas, the overall construction activity remains robust, RLB said, indicating a “dynamic and evolving urban development.”

Recent Comments