Two of North America’s four major stock market indices set new all-time records in August.
The Dow Jones Industrials (DJI) index climbed above 17,000 and, at August’s month-end closing, was 15.4% higher than at the same time last year.
The S&P 500 took wing and soared above 2,000 for the first-time ever. Year over year at the end of the latest month, it was +22.7%.
Canada’s major stock market index, capturing share price movements on the Toronto Stock Exchange (TSX), has finally caught fire as well. At a reading of 15,626, it is approaching a new benchmark level, 16,000.
But it’s NASDAQ that has been most remarkable of all. Its July month-end closing was +27.6% versus end-of-August last year.
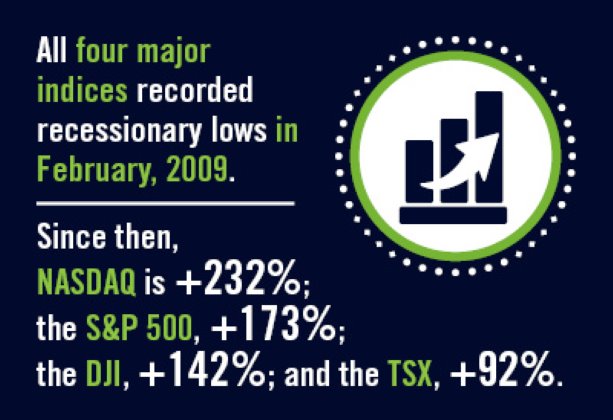
Compared with its trough level in February 2009, NASDAQ is a stunning +232%.
The other three major indices also recorded recessionary lows in February 2009. Since then, the S&P 500 is +173%; the DJI, +142%; and the TSX, +92%.
The TSX has achieved a fair measure of success in playing catch-up. At the start of this year, it was only +69% when compared with February 2009.
Over the past year or so, there has been considerable discussion and questioning in the media about why stock market prices have been so buoyant.
In light of many of the latest statistics on the economy, it now appears investors got it right.
U.S. “real” (i.e., inflation-adjusted) gross domestic product (GDP) growth in the second quarter of this year occurred at a rapid annualized rate of 4.2%.
Consumer expenditures on durable goods ‒ e.g., motor vehicles, etc. (there will be more on this in a moment) ‒ launched into orbit, +14.3% annualized.
Canada’s Q2 GDP advance wasn’t quite as quick, but it was a satisfying +3.2% nonetheless.
August’s Purchasing Managers’ Index (PMI) of the Institute of Supply Management (ISM) jumped 1.9% to reach 59.0%, its highest level since March 2011.
The ISM has found that a reading of 59.0% for its PMI has historically corresponded with an inflation-adjusted GDP growth rate of 5.1%.
Certain industries are turning in outstanding performances. For example, monthly annualized light motor vehicle sales in the U.S. have fought back near 16.0 million units. They dropped as low as 9.0 million in early 2009.
Autodata Corporation is reporting that General Motors (GM) has taken the largest share of total U.S. light motor vehicle sales through July of this year, 17.8%. That’s despite the spate of recalls that have plagued the company and necessitated appearances by top executives before congressional committees.
Ford (15.4% of the total) is in second place, with third and fourth positions going to Toyota Motors (14.4%) and Chrysler/Fiat (12.4%).
Among the four “majors”, Chrysler has recorded the biggest year-to-date sales leap, +13.3%. Toyota (+6.1%) has been next, followed by GM (+3.5%). Ford’s sales (-0.4%) have been more or less flat.
The U.S. automotive and parts industry in July was operating at an exceptionally high 88.6% of its capacity, according to the Federal Reserve Board.
Canadian light motor vehicle sales (i.e., passenger cars and light trucks including SUVs and minivans) are now near 1.8 million units annualized. That’s 100,000 units more than they were at their best before 2009’s giant crater.
According to DesRosiers Automotive Consultants, Canadian light motor vehicle sales in the individual month of July rose by a percentage change that was in double digits, +11.3%.
Year to date, versus the same January-to-July-period of last year, they were +4.1%.
Chrysler/Fiat has taken over as the country’s number one nameplate, with a market share of 16.0%. Its sales year over year through seven months were +5.3%.
Ford, with a 15.8% slice of the total, is a close second, although its year-to-date sales have been on a plateau, +0.1%.
General Motors is in third position, with a 13.1% share and a year-to-date unit-sales increase of 1.5%.
Toyota sits in fourth spot with a 10.0% share and year-over-year sales of +2.4%.
Nissan and Honda are the two second-tier automobile suppliers in Canada which have experienced the greatest year-to-date sales advances, +30.8% and +8.6% respectively.
To close out this article, I’d like to return to NASDAQ and the firms it represents best. There are a few points of interest I’d like to share.
TechAmerica Foundation, in its Cyberstates 2013 report, has calculated that the following six states provided the most jobs in the high-tech sector in 2012: (1) California (968,800); (2) Texas (485,600); (3) New York (318,200); (4) Virginia (285,400); (5) Florida (270,900); and (6) Massachusetts (254,000).
At 9.8% of its total employment, Virginia has the highest concentration of “cyber” workers
InfoWorld Magazine’s web site features a slide show which sets out a Top 10 ranking of U.S. states according to number of firms primarily engaged in IT activities.
It differs a little from TechAmerica’s list, including some alternative and additional jurisdictions.
In order, they are: (1) California; (2) Texas; (3) Florida; (4) Illinois; (5) New York; (6) Virginia; (7) Georgia; (8) New Jersey; (9) Pennsylvania; and (10) North Carolina.
| INDEX | 52-WEEK LOW | 52-WEEK HIGH | YEAR AGO (AUG 30, 2013) |
MONTH AGO (JUL 31, 2014) |
Latest Month-end Closing Prices (AUG 29, 2014) |
PER CENT CHANGE, LATEST VERSUS |
|||
| 52-WEEK LOW | 52-WEEK HIGH | YEAR AGO | MONTH AGO | ||||||
| Dow Jones Industrials NYSE (^dji) |
Oct 8 13 14,777 |
Aug 26 14 17,154 |
14,810 | 16,563 | 17,098 | 15.7% | -0.3% | 15.4% | 3.2% |
|
S & P 500 |
Sep 3 13 1,640 |
Aug 26 14 2,005 |
1,633 | 1,931 | 2,003 | 22.1% | -0.1% | 22.7% | 3.7% |
| NASDAQ (^ixic) |
Sep 3 13 3,613 |
Aug 29 14 4,580 |
3,590 | 4,370 | 4,580 | 26.8% | 0.0% | 27.6% | 4.8% |
| S & P/TSX Composite TSX (^gsptse) |
Oct 8 13 12,692 |
Aug 26 14 15,653 |
12,654 | 14,331 | 15,626 | 23.1% | -0.2% | 23.5% | 1.9% |
Securities Dealers Automated Quotations (NASDAQ), Toronto Stock Exchange (TSE) and Reuters.
Table: Reed Construction Data.


Recent Comments
comments for this post are closed