The intertwined and vibrating lines in Graphs 1, 2 and 3 may appear to be a maelstrom of confusion, but they actually tell a coherent story. Moreover, the latest results support the notion that since the end of last year, the world economy has been moving into better balance.
The index values in the three graphs are based on monthly average U.S. dollar exchange rates with the 15 countries that account for most of America’s foreign trade.
For all 15 other currencies, the exchange rate in July 2009 is set equal to 100.0 and each subsequent value is expressed relative to that starting value. (As a hypothetical example, if 1 US dollar could buy 10 of another country’s currency units in July 2009, but 12.5 in December 2014, then the index value will be 100.0 in July 2009, but 125.0 in December 2014.)
The history in Graphs 1, 2 and 3 runs from July 2009 to the present. July 2009 has been chosen as the kick-off marker because it was the first month of recovery after the Great Recession.
There is one key feature of the graphs that should be noted and it relates to the fact that an exchange rate can always be denominated in two ways. There are flip-side perspectives.
By adopting “the amount of the foreign currency that 1 USD will buy”, a rising slope will indicate a ‘greenback’ that is growing stronger. If the inverse had been chosen instead – i.e., the amount of U.S. dollars that the foreign currency will buy – then a climbing slope would have meant the opposite, a faltering American coinage.
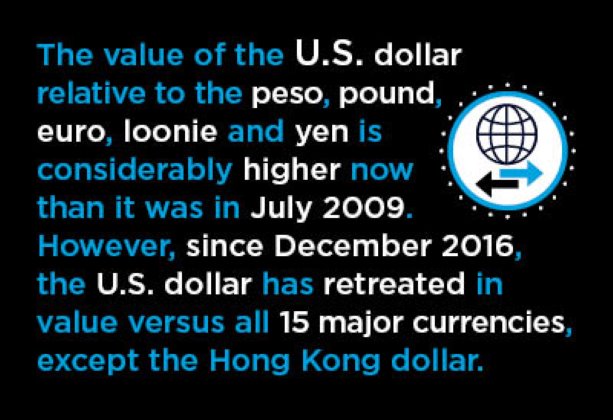
Graph 1 clearly illustrates that the value of the U.S. dollar relative to the peso, pound, euro, loonie and yen is considerably higher now than it was in July 2009.
(Indexed to July 2009, the beginning of the recovery from the Great Recession)

Chart: ConstructConnect
Graph 2 highlights that the U.S. dollar is presently much stronger versus the Brazilian real; but only a little up on the Australian dollar and the Chinese yuan; and down a bit relative to the Korean won and the Swiss franc. (The Swiss franc is the ‘healthiest’ currency in the world.)
(Indexed to July 2009, the beginning of the recovery from the Great Recession)

Chart: ConstructConnect
Graph 3 shows the value of the greenback – relative to July 2009 − much improved on the Russian rouble and the Indian rupee, but about level with the Saudi riyal, Hong Kong dollar and the Taiwanese dollar.
(Indexed to July 2009, the beginning of the recovery from the Great Recession)

Chart: ConstructConnect
With respect to the Saudi, Hong Kong and Taiwanese currencies, the governments and central banks standing behind those notes of legal tender have long adopted monetary policies to maintain steady relationships with the U.S. greenback.
The Russian rouble and Brazilian real have obviously struggled the most. Both Russia and Brazil have been battered by depressed commodity prices, − about which there will be more elaboration in a moment − but they have also had to deal with their own uniquely negative circumstances.
Brazil has been plagued by corruption charges that have cost it leadership in both the private and public sectors. Russia has been burdened with economic sanctions imposed by the West in retaliation for President Putin’s expansionist policies in the Ukraine.
The foregoing lays out the big picture. There’s much more to be examined and discussed.
What the vertical lines in Graphs 1, 2 and 3 show are two clear turning points for the value of the U.S. dollar.
In the summer of 2014, Saudi Arabia made the decision to pump out as much low-cost oil as it possibly could, in an attempt to beat back the surge in U.S. energy production from hydraulic fracturing, and to maintain market share vis à vis some other OPEC countries. (There has been ongoing fierce competition with Iran for dominance in the Middle East.)
The international price of crude oil plummeted. After sitting near $100 USD per barrel from 2011 through the front half of 2014, it began a slide that bottomed out at $30 in February 2016.
Many other commodities became ensnared in pricing downdrafts as well.
The currencies of countries with economies that are dependent on foreign sales of raw materials suffered accordingly.
America, though, as almost the single standard bearer of economic growth among all industrialized nations, saw its currency soar. Adding to the greenback’s upward momentum was a Federal Reserve that, alone among central banks around the world, began a hesitant program of interest rate tightening.
(International currency traders move funds to where yields are climbing. It also helps greatly if the underlying debt instruments are judged to be ‘safe’.)
There is also the second turning point for the U.S. dollar to consider. It appears to have begun in the closing months of last year.
In terms of gross domestic product (GDP) growth, the rest of the world is finally picking up the pace. Europe and Japan are showing more signs of economic life. China, which never decelerated to the degree once feared, is becoming more active again. Plus there’s one interesting observation concerning China that warrants special mention.
China’s annual GDP growth may have slowed from between +10% and +12% in the mid-00s to about +6% at present, but the implications for commodities demand are more subtle than may be supposed. The accumulation of output growth in China over the past 10-15 years means that each percentage-point of present-day advance is on top of a bigger base.
Also, Saudi Arabia – with plans to take its state oil company (ARAMCO) public – has patched over some of its differences with fellow OPEC members and has committed to a more expensive price for oil (i.e., near $50 USD per barrel), to be achieved through supply management.
The recent positive shifts in the world economy have produced the currency results set out in Graph 4. Since December 2016, the U.S. dollar has retreated in value versus all the other 15 major currencies, except the Hong Kong dollar (+0.7%).
(July 5, 2017 versus December, 2016)

Table: ConstructConnect
The pull-backs range from a minimal -0.6% relative to the Saudi riyal to an extreme -12.3% versus the Mexican peso. The greenback has lost – 3.5% to the Japanese yen and -7.7% to the euro.
The other way of looking at it, of course, is that those other currencies have bulked up.
From the other side of the looking glass, for example, the Japanese yen has gained +3.6% in value versus the greenback, and the euro, +8.3%.
Compared with the Canadian dollar, the greenback has back-tracked -3.5% (i.e., the same as for the yen), while the loonie has stepped forward +3.6%.
Moving on to concentrate on Canada’s currency, Graphs 5, 6 and 7 show its performance versus all the same currencies as have already been discussed, for the same time period as in Graphs 1, 2 and 3.
(Indexed to July 2009, the beginning of the recovery from the Great Recession)

Chart: ConstructConnect
(Indexed to July 2009, the beginning of the recovery from the Great Recession)

Chart: ConstructConnect
(Indexed to July 2009, the beginning of the recovery from the Great Recession)

Chart: ConstructConnect
Once again, the graphs have been constructed so that a rising slope indicates a strengthening Canadian dollar. A declining curve captures fragility.
There is the same first vertical boundary line for the loonie as for the greenback, positioned in July 2014. After the price of oil began its steep descent, the Canadian dollar could no longer stay even with the U.S. dollar.
Canada’s dollar stepped on the down escalator relative to the U.S. dollar and relative to several other major currencies, especially those that are essentially in a fixed relationship with the greenback.
But a second turning point for the loonie has come a little later than for the greenback, in April 2017.
Canada has been moving past the oil price shock. Job creation, especially in some new high-tech areas, has been remarkably buoyant. ‘Real’ (i.e., inflation-adjusted) national output growth in Q1 of this year reached almost +4.0%. Retail sales have been blistering. Housing starts have stayed solid. And it doesn’t hurt that the price of oil has moved up from $30 USD per barrel into a range of $45-$50.
Since April of 2017, and as illustrated in Graph 8, the loonie has lost headway only versus the Swiss franc (-0.7%) and the euro (-2.7%). It has stayed even versus the peso (0.0%). Otherwise, the improvement in the Canadian economy has lifted it versus 12 of the 15 currencies under consideration.
(July 5, 2017 versus April, 2017)

Table: ConstructConnect
With the Bank of Canada now facing some pressure to move interest rates upwards again, support for the loonie will build further.
The cheerier scenario being depicted for the Canadian economy does, however, have a readily-apparent potential flaw.
An ultra-low-valued loonie has been counted on to help Canadian manufactures restore sales in export markets. Losing a portion of that advantage may prove painful.


Recent Comments
comments for this post are closed