The tables accompanying this article highlight some of the key statistics on construction employment in 48 U.S. States. The source material from the Bureau of Labor Statistics (BLS) omits Delaware, the District of Columbia (D.C.) and Hawaii. The most recent data is for November 2017 and is not seasonally adjusted (NSA).

Table 1 ranks states by number of construction workers; Table 2 ranks states by year-over-year change in number of construction workers; and Table 3 ranks states by year-over-year percentage change in number of construction workers.
It’s not surprising that the large-population-states also account for the highest numbers of construction workers. The ranking positions 1 through 7 in Table 1 − i.e., California followed by Texas, Florida, N.Y., Pennsylvania, Illinois and Ohio − exactly correspond with the latest (for July 1, 2017) state population rankings.
Further down the listing, however, there are some significant variances. For example, Georgia is 8th for population, but 11th for construction employment; Michigan is 10th for population, but 13th for construction employment; New Jersey is 11th for population, but 15th for construction employment; Washington is 13th for population, but 9th for construction employment; Maryland is 19th for population, but 12th for construction employment; Colorado is 21st for population, but 14th for construction employment; and Louisiana is 25th for population, but 17th for construction employment.
A main conclusion to be drawn from the above set of numbers is that Washington, Maryland, Colorado and Louisiana are ‘punching above their weight’ in construction employment.
On the flip side, Georgia, Michigan and New Jersey are not holding their own with respect to on-site work relative to residency counts.
Table 1: U.S. States – Construction Employment
November 2017 – Not Seasonally Adjusted (NSA)
| Rank | State | No. of Workers | |
| 1 | California | 841,800 | |
| 2 | Texas | 733,000 | |
| 3 | Florida | 530,800 | |
| 4 | New York | 388,300 | |
| 5 | Pennsylvania | 253,100 | |
| 6 | Illinois | 220,600 | |
| 7 | Ohio | 219,200 | |
| 8 | North Carolina | 202,800 | |
| 9 | Washington | 200,400 | |
| 10 | Virginia | 194,200 | |
| 11 | Georgia | 181,400 | |
| 12 | Maryland | 170,400 | |
| 13 | Michigan | 168,800 | |
| 14 | Colorado | 162,900 | |
| 15 | New Jersey | 160,200 | |
| 16 | Massachusetts | 158,500 | |
| 17 | Louisiana | 154,800 | |
| 18 | Indiana | 142,400 | |
| 19 | Arizona | 142,200 | |
| 20 | Minnesota | 125,600 | |
| 21 | Tennessee | 123,600 | |
| 22 | Missouri | 118,000 | |
| 23 | Wisconsin | 115,600 | |
| 24 | Oregon | 103,800 | |
| 25 | Utah | 100,100 | |
| 26 | South Carolina | 98,300 | |
| 27 | Alabama | 91,500 | |
| 28 | Nevada | 90,500 | |
| 29 | Oklahoma | 83,400 | |
| 30 | Kentucky | 83,300 | |
| 31 | Iowa | 77,700 | |
| 32 | Kansas | 63,900 | |
| 33 | Connecticut | 59,000 | |
| 34 | Arkansas | 53,100 | |
| 35 | Nebraska | 51,200 | |
| 36 | New Mexico | 47,600 | |
| 37 | Idaho | 45,300 | |
| 38 | Mississippi | 43,900 | |
| 39 | West Virginia | 33,900 | |
| 40 | North Dakota | 32,000 | |
| 41 | New Hampshire | 29,300 | |
| 42 | Maine | 29,200 | |
| 43 | Montana | 27,900 | |
| 44 | South Dakota | 23,600 | |
| 45 | Rhode Island | 22,300 | |
| 46 | Wyoming | 20,900 | |
| 47 | Vermont | 16,100 | |
| 48 | Alaska | 15,400 |
Table: ConstructConnect.
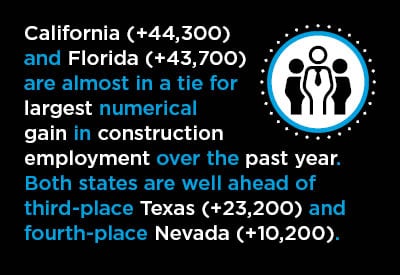
Table 2 spotlights that California (+44,300) and Florida (+43,700) are almost in a tie for largest numerical gain in construction employment over the past year. Both states are well ahead of third-place Texas (+23,200).
While it’s a further sizable step down to ranking positions four and five in Table 2, Nevada and Pennsylvania should still be pleased with their year-over-year construction jobs gains of +10,200 and +10,100 respectively.
Table 2: U.S. States – Change in Construction Employment
Nov 2017 vs Nov 2016 – Based on NSA Data
| Rank | State | + / – No. of Workers | |
| 1 | California | 44,300 | |
| 2 | Florida | 43,700 | |
| 3 | Texas | 23,200 | |
| 4 | Nevada | 10,200 | |
| 5 | Pennsylvania | 10,100 | |
| 6 | New York | 9,900 | |
| 7 | Louisiana | 9,800 | |
| 8 | Washington | 9,500 | |
| 9 | Oregon | 9,100 | |
| 10 | Massachusetts | 8,900 | |
| 11 | Arizona | 8,300 | |
| 12 | Indiana | 8,100 | |
| 13 | Maryland | 7,100 | |
| 14 | Alabama | 6,600 | |
| 15 | Oklahoma | 6,400 | |
| 16 | Colorado | 6,300 | |
| 17 | Ohio | 6,100 | |
| 18 | Minnesota | 5,400 | |
| 19 | Virginia | 5,200 | |
| 20 | Utah | 4,900 | |
| 21 | Tennessee | 4,800 | |
| 22 | New Jersey | 4,600 | |
| 23 | Kentucky | 3,600 | |
| 24 | Michigan | 3,300 | |
| 25 | Arkansas | 3,000 | |
| 25 | New Mexico | 3,000 | |
| 27 | Idaho | 2,700 | |
| 27 | Rhode Island | 2,700 | |
| 29 | New Hampshire | 2,300 | |
| 29 | West Virginia | 2,300 | |
| 31 | Kansas | 2,100 | |
| 32 | Georgia | 2,000 | |
| 33 | Wisconsin | 800 | |
| 34 | Maine | 700 | |
| 35 | Alaska | 600 | |
| 36 | Mississippi | 400 | |
| 36 | Vermont | 400 | |
| 38 | South Dakota | -100 | |
| 39 | Wyoming | -200 | |
| 40 | Illinois | -300 | |
| 40 | South Carolina | -300 | |
| 42 | Connecticut | -600 | |
| 43 | Montana | -700 | |
| 44 | Nebraska | -1,300 | |
| 45 | North Dakota | -2,200 | |
| 46 | North Carolina | -2,300 | |
| 47 | Iowa | -6,900 | |
| 48 | Missouri | -7,000 |
Table: ConstructConnect.
Table 3 on year-over-year percentage gains in construction employment features, at the top, some states already mentioned – i.e., Nevada in 2nd spot, at +12.7%, and Florida in 4th, at +9.0% − but also several newcomers that have not appeared in the discussions so far.
Rhode Island has had an outsized jump of +13.8%, but the level of construction in that state remains low (only 22,300). The same can be said for New Hampshire, +8.5%, but relative to a low base (less than 30,000 construction workers).
More impressive have been the results for Oregon, Oklahoma and Alabama, at +9.6%, +8.3% and +7.8% respectively. Those three states have construction employment ranging from 80,000 to 100,000. (Nation-wide, the year-over-year increase in construction jobs in November 2017 was +2.7%.)
Table 3 also reveals those states where there have been year-over-year percentage declines in construction employment. Five (or half) of the ten states with losses are situated in the center of the country – Iowa, -8.2%; North Dakota, -6.4%; Missouri, -5.6%; Nebraska, -2.5%; and South Dakota, -0.4%. (Illinois, at -0.1%, is being assessed as flat.)
From a construction employment standpoint, some of those Midwest states would benefit from a start-up of work on the Keystone XL pipeline expansion.
As a last point of interest, states generally display seasonality in their construction employment dependent on their locations, north versus south. In northern states, snow and icy conditions from December through March can delay or put a hold on field work and job site opportunities.
In the south, there can be the extremes of hurricanes and tornadoes, but they don’t arrive with the several-months-long predictability of winter.
There are three southern states that, since 2000, have exhibited virtually no seasonality in construction employment: Arizona, Florida and Nevada.
There have been nine other mainly southern states that have shown little seasonality in the provision of construction jobs: Alabama, California, Georgia, Louisiana, Mississippi, New Mexico, North Carolina, South Carolina and Texas.
Table 3: U.S. States – % Change in Construction Employment
Nov 2017 vs Nov 2016 – Based on NSA Data
| Rank | State | % Change No. of Workers | |
| 1 | Rhode Island | 13.8% | |
| 2 | Nevada | 12.7% | |
| 3 | Oregon | 9.6% | |
| 4 | Florida | 9.0% | |
| 5 | New Hampshire | 8.5% | |
| 6 | Oklahoma | 8.3% | |
| 7 | Alabama | 7.8% | |
| 8 | West Virginia | 7.3% | |
| 9 | Louisiana | 6.8% | |
| 10 | New Mexico | 6.7% | |
| 11 | Idaho | 6.3% | |
| 12 | Arizona | 6.2% | |
| 13 | Arkansas | 6.0% | |
| 13 | Indiana | 6.0% | |
| 15 | Massachusetts | 5.9% | |
| 16 | California | 5.6% | |
| 17 | Utah | 5.1% | |
| 18 | Washington | 5.0% | |
| 19 | Kentucky | 4.5% | |
| 19 | Minnesota | 4.5% | |
| 21 | Maryland | 4.3% | |
| 22 | Pennsylvania | 4.2% | |
| 23 | Alaska | 4.1% | |
| 24 | Colorado | 4.0% | |
| 24 | Tennessee | 4.0% | |
| 26 | Kansas | 3.4% | |
| 27 | Texas | 3.3% | |
| 28 | New Jersey | 3.0% | |
| 29 | Ohio | 2.9% | |
| 30 | Virginia | 2.8% | |
| 31 | New York | 2.6% | |
| 32 | Maine | 2.5% | |
| 32 | Vermont | 2.5% | |
| 34 | Michigan | 2.0% | |
| 35 | Georgia | 1.1% | |
| 36 | Mississippi | 0.9% | |
| 37 | Wisconsin | 0.7% | |
| 38 | Illinois | -0.1% | |
| 39 | South Carolina | -0.3% | |
| 40 | South Dakota | -0.4% | |
| 41 | Wyoming | -0.9% | |
| 42 | Connecticut | -1.0% | |
| 43 | North Carolina | -1.1% | |
| 44 | Montana | -2.4% | |
| 45 | Nebraska | -2.5% | |
| 46 | Missouri | -5.6% | |
| 47 | North Dakota | -6.4% | |
| 48 | Iowa | -8.2% |
Table: ConstructConnect.


Recent Comments
comments for this post are closed