
This article provides a ranking of America’s Top Dozen States according to their goods export volumes in full year 2017. Total U.S. goods exports last year amounted to almost one-and-a-half trillion dollars. The background foreign trade data comes from the Census Bureau’s web-based site entitled USA Trade Online.

While it’s relatively easy to open a free account, if one is not familiar with ‘pivot tables’, there is a bit of a learning curve to access the statistics.
The type-of-product designations follow the definitions in the North American Industry Classification System (NAICS).
(1) Texas:
Texas, with export shipments of $264.1 billion and a 17.9% share of the nation’s total, was the leader among U.S. states for foreign sales in 2017. The NAICS category at the top of the Lone Star State’s exports list was ‘computer and electronic products’ ($47.0 billion), but close behind were ‘petroleum and coal products’ ($44.0 billion), ‘chemicals’ ($40.0 billion) and ‘oil and gas’ ($32.0). ‘Chemicals’ exports were dominated by synthetic rubber.
While Texas has a high level of computer-product exports, it would be more accurate to say that the State is especially strong in energy-product export sales. Energy products as a catch-all would combine refined petroleum (e.g., gasoline), chemicals, crude oil and natural gas for more than $100 billion.
In 2017, there were substantial increases in oil exports from Texas to China, Canada and South Korea. Other major customers for Texas crude last year were Mexico and Brazil.
Also making significant contributions to export sales from Texas in 2017 were ‘transportation equipment’ ($22.4 billion) and ‘machinery, except electrical’ ($21.0 billion). Within ‘transportation equipment’, there was an almost even split between ‘motor vehicles and parts’ ($9.4 billion) and ‘aerospace products’ ($8.5 billion).
(2) California:
With a goods export sales volume of $171.9 billion, amounting to an 11.6% share of the national total, California ranked second among states for foreign shipments in 2017. Like Texas, California’s top export category was ‘computer and electronic products’ ($43.7 billion).
On a micro level, however, the Golden State in 2017 experienced hefty foreign sales of automatic data processing machinery, magnetic and optical readers and movie and audio equipment.
There were five other NAICS categories where California’s export sales shone in 2017: ‘transportation equipment’ ($19.0 billion); ‘machinery, except electrical’ ($17.1 billion); ‘miscellaneous manufacturing commodities’ ($14.1 billion); ‘agricultural products’ ($13.7 billion); and ‘chemicals’ ($13.3 billion).
‘Transportation equipment’ exports from California were weighted more towards ‘aerospace products’ ($8.7 billion) than ‘motor vehicles’ ($5.3 billion). The major sub-component of ‘miscellaneous manufacturing commodities’ was ‘medical equipment’ ($5.7 billion).
California’s major ‘agricultural products’ exports were ‘fruits and tree nuts’ and its primary ‘chemicals’ exports were ‘pharmaceuticals’.
Pausing at this point for a moment, it should be stated that the first two States in our ranking – i.e., Texas and California – are in a league of their own for export sales. Both had double-digit percentage shares (17.9% and 11.6% respectively) of the U.S. total in 2017, placing them well ahead of third-ranked Washington State (5.2%).
(3) Washington:
Eleven states lay claim to ‘transportation equipment’ as their main export product. Furthermore, ‘transportation equipment’ ($278.4 billion) is the number one export product of the entire country, ahead of ‘computer and electronic products’ ($208.0 billion) and ‘chemicals’ ($192.6 billion) in second and third positions.
But it may be a surprise for some readers to learn that Washington, not Michigan, is the State with the largest volume of ‘transportation equipment’ export sales. In fact, Washington had a significant margin of victory over Michigan in 2017, $43.9 billion to $29.2 billion.
While Michigan’s ‘transportation equipment’ export strength in 2017 lay, as would be expected, in ‘motor vehicles and parts’ ($28.0 billion), Washington’s was derived from ‘aerospace products’ ($42.4 billion).
The main export product from Washington State is civilian aircraft. About one-quarter of the Evergreen State’s civilian aircraft export shipments last year went to China. More than half were destined for Asia.
Washington also did well in ‘agricultural product’ export sales last year ($10.5 billion), led by ‘oilseeds and grains’. Washington’s total export sales of $77.0 billion in 2017, claiming a 5.2% share of the nation’s total, placed it in third spot among all states.
(4) New York:
The Empire State, with a level of $75.3 billion and a 5.1% share of the national total, ranked fourth for export sales in 2017. New York’s number one export product carries the vague NAICS description ‘miscellaneous manufactured commodities’ ($23.0 billion).
One of the largest sub-components of N.Y.’s ‘miscellaneous manufactured commodities’ export sales last year was ‘medical equipment’.
As a sidebar, the U.S. State that is the largest exporter of gold is Nevada. In 2017, almost all of Nevada’s gold exports were dispatched to Switzerland.
The State that is the second largest exporter of gold, though, is New York. N.Y. is a major supplier of gold powder (for paint) to India.
(5) Illinois:
Illinois, with a level of $64.9 billion and a 4.4% slice of the national total, grabbed fifth spot for export sales among all States in 2017. The large diverse economy in Illinois generated export opportunities across a wide-range of product lines. The two frontrunners were ‘machinery, except electrical’ ($11.0 billion) and ‘chemicals’ ($8.9 billion).
The largest portion of ‘chemicals’ from Illinois was ‘pharmaceuticals’.
The Top 10 States or Territories for ‘chemicals’ exports in 2017 were: Texas ($40.0 billion); California ($13.3); Puerto Rico ($12.7); Louisiana ($9.7); Indiana ($9.4); New Jersey ($9.0); Illinois ($8.9); North Carolina ($8.4); Pennsylvania ($7.9); and Ohio ($6.3).
Of those ten, four had a specialty in ‘pharmaceuticals’: California ($6.4 billion); North Carolina ($4.8); Illinois ($3.3); and Pennsylvania ($3.2). The other six delivered what are termed ‘basic chemicals’.
(6) Michigan:
Michigan, with a level of $59.8 billion and a 4.0% share of the national total, occupied sixth place for export sales among all States in 2017. Being home to Detroit, Michigan’s standout export product was ‘motor vehicles and parts’ ($28.0 billion).
While Michigan still retains its reputation for auto-making, there were six other states with commendable ‘motor vehicle and parts’ export sales last year: Texas; South Carolina; California, Ohio; Indiana; and Alabama.
(7) Louisiana:
Louisiana was seventh for export sales among all U.S. States in 2017 ($56.5 billion and a 3.8% share). Louisiana’s main export was ‘petroleum and coal products’ ($18.2 billion), followed by ‘agricultural products’ ($15.8 billion).
(8) Florida:
Florida was ranked eighth for export sales in 2017, with a level of $55.0 billion and a 3.7% share of the country-wide total. The Sunshine State’s main NAICS-denominated export was ‘computer and electronic products’ ($12.9 billion).
(9) Ohio:
Among all States, Ohio placed ninth last year, with a level of $50.1 billion and a share of 3.4%. The Buckeye State’s main export product was ‘transportation equipment’, split about evenly between ‘motor vehicles and parts’ and ‘aerospace products’.
(10) Pennsylvania:
Pennsylvania placed tenth for export sales in 2017, with a level of $38.6 billion and a share of 2.6%. The Keystone State’s foreign shipments were led by ‘chemicals’ ($7.9 billion).
(11) Indiana and (12) Georgia:
Completing the Top Dozen in 2017 were Indiana in eleventh position ($37.8 billion and 2.6%) and Georgia in twelfth ($37.2 billion and 2.5%). Both States showed strength in ‘transportation equipment’ ($11.5 billion and $9.8 billion), but while the Hoosier State cultivated ‘motor vehicle and parts’ exports, the Peach State concentrated on ‘aerospace product’ exports.
Map 1: America’s Top Dozen States according to their goods export volumes in full year 2017
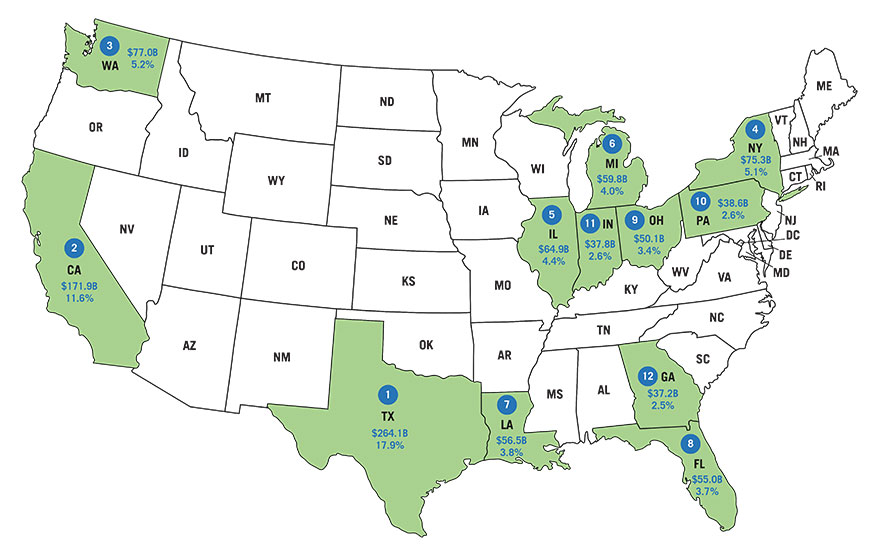
Total goods export sales volume in $US Billions/Per cent (%) share of national total – shown for each of the dozen states.
Data source: Census Bureau: USA Trade Online.
Graphic: ConstructConnect.
In Other U.S. Goods Export News:
West Virginia managed a 41% increase in export sales last year, thanks to a pick-up in shipments of bituminous coal. The major client nations were Ukraine, Netherlands, Italy and France.
Kentucky, in 2017, achieved impressive export sales of ‘transportation equipment’ ($17.6 billion), two-thirds of which were ‘aerospace products’ ($11.7 billion).
Kentucky is second to Washington for exports of aerospace products. It consistently beats California and Texas. Many plants in Kentucky produce components for Boeing and Airbus.
Whereas Washington’s aerospace output mainly ‘flies’ to Asia, Kentucky’s production is directed more to Europe.
Chinese Tariff Retaliation:
China isn’t happy about the tariffs the Trump Administration is placing on America’s foreign purchases of solar panels, steel and aluminum. Beijing has announced that retaliatory measures will be taken against the U.S. imports that China buys. Some of the main products to be targeted by China will be pork, wine, nuts and recycled aluminum.
The rhetoric has become severe. There’s talk of a ‘trade war’. The situation, however, has not deteriorated to that alarming degree quite yet.
The five States leading America’s export sales to China in 2017 were:
- Washington ($18.3 billion comprised mainly of ‘transportation equipment’ and ‘agricultural products’);
- California ($16.4 billion comprised mainly of ‘computer and electronic products’);
- Texas ($16.3 billion comprised mainly of ‘oil and gas’ and ‘chemicals’);
- Louisiana ($8.0 billion comprised mainly of ‘agricultural products’); and
- South Carolina ($6.2 billion comprised mainly of ‘transportation equipment’).
The ‘transportation equipment’ exports to China from Washington were almost all aerospace- related. From South Carolina, they were about half aerospace and half motor vehicles. (BMW is supplying Asian customers from a huge auto assembly plant in Spartanburg, South Carolina.)
The agricultural product exports to China from California and Louisiana in 2017 were mainly oilseeds and grains.
The states with the largest volumes of hog/swine exports to China in 2017 were North Carolina, Missouri, Oklahoma, South Carolina, Georgia, Kansas and Iowa.
But those dollar volumes, compared with some of the other export products already mentioned, were modest.
On the trade front, the U.S. and China are currently engaged in a skirmish. The sparks won’t really fly until China – from its point-of-view − is ‘provoked’ into slapping penalties onto imports of U.S. aerospace, motor vehicle and computer products.
Map 2: Top Five U.S. States – Export Sales to China in 2017
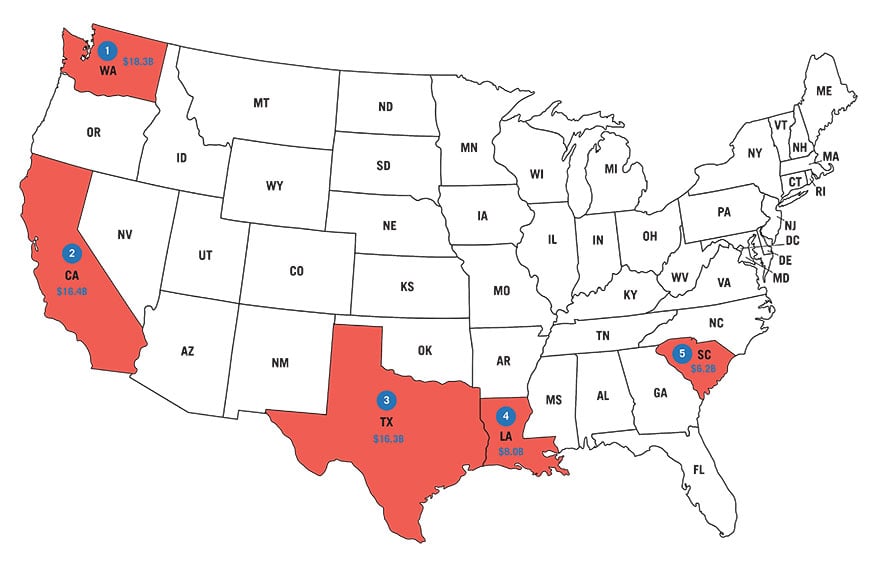
Total goods export sales volume in $US Billions for top five states to China.
Data source: Census Bureau: USA Trade Online.
Graphic: ConstructConnect.


Recent Comments