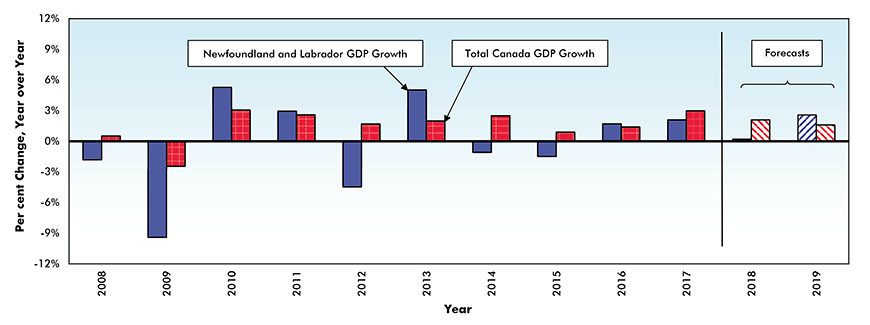
The combination of a -8.9% retreat in capital spending in 2016 followed by a -9.2% drop in 2017 and the prospect of a further projected -27.8% decline in 2018, will probably cause Newfoundland and Labrador to grow in the range of 0.0% to 0.5% in 2018, following back-to-back gains of 1.9% and 2.1% in the previous two years.
As noted in our last update on the Rock’s economy, this sharp contraction in CAPEX is largely the result of a projected 31.2% drop in spending on oil and gas projects, specifically on the Hebron offshore oil platform, which started producing oil in late 2017, and a concomitant slowdown in spending on the Muskrat Falls hydro electric project. Two projects which will help to partially offset this drop in investment are the Huskey White Rose expansion and the start of work on Voisey’s Bay underground mining.
Although the direct impact of the reduction in energy- project-related employment occurred in mid-2017, service-producing industries have continued to downsize well into 2018. As a result, total employment year to date is down by -1%.
Reflecting the protracted slowdown in hiring, the province’s job vacancy rate fell to a twelve year low of 1.6% in Q1/2018. Given the hostile hiring climate which has existed over the past year, it is not surprising that 3,400 Newfoundlanders have moved to other provinces, more than offsetting a net inflow of 1,200 international migrants. Despite this net outflow of individuals to other provinces and a corresponding shrinkage in the labour force, Newfoundland’s unemployment rate, currently 14.5%, has edged higher since the beginning of the year.
Consistent with the weak pattern of hiring and the rising unemployment rate noted above, Newfoundlanders spent less in the first quarter of this year than they did during the comparable period in 2016.
Driven (pun intended) by a 5% y/y decline in sales of motor vehicles and parts, retail sales contracted -1.4% y/y in the quarter compared to a 1.9% y/y gain in Q1/2017. Despite the weak pattern of employment and the exodus of individuals to other provinces, year to date sales of existing homes are up by 2.3% while the months’ supply of homes for sale, currently at 14.5, has retreated from the record high 17.9 it reached in April.
While the market for existing homes is still quite weak, new residential construction has picked up in the last few months. Year to date, housing starts are up by 30% y/y largely due to a surge in starts of multiple units, the majority of which are located in St. John’s which, in contrast to the rest of the province, has seen an inflow of population over the past year.
Looking ahead, the effects of the retreat in capital spending together with austerity measures announced in the province’s March budget, will hobble Newfoundland’s economy well into next year.
This view is reinforced by the Canadian Federation of Independent Business’ most recent Business Barometer which has signalled slower growth since the beginning of the year. Moving into 2019, the province’s prospects appear brighter as the combination of higher oil prices and increased production from the recently completed Hebron offshore oil platform fuel government revenue and give a further boost to the province’s energy exports which year to date are up by 38%.
Assuming that oil prices remain in the range of $60 to $70 USD and the current trade dispute between the U.S. and Canada is resolved in a satisfactory fashion, we expect the Newfoundland and Labrador economy to expand in the range of 2% to 3% in 2019.
Real* Gross Domestic Product (GDP) Growth – Newfoundland and Labrador vs Canada

Chart: ConstructConnect – CanaData.


Recent Comments
comments for this post are closed