
June 2018’s figure on total employment in construction in the U.S., as calculated by the Bureau of Labor Statistics (BLS), was +4.1% compared with June 2017. The comparable number for north of the border from Statistics Canada was a percentage point lower at +3.1%. But +3.1% was a commendable climb nonetheless.

Meanwhile, total jobs growth over the past year has been +1.6% in America and +1.2% in Canada. Clearly, with respect to hiring, the construction sector has commanded center stage in both countries.
While those national construction jobs advances have been stellar, the issue to be addressed in this article concerns how regional patterns have varied – i.e., by states and provinces.
First, to gain some perspective, accompanying Table 1 ranks nominal levels of construction employment in U.S. states and Canadian provinces. For Canada, the provinces of Newfoundland and Labrador, Prince Edward Island, Nova Scotia and New Brunswick have been combined into the Atlantic Region.
The four largest states by population are California (39.5 million July 1, 2017), Texas (28.3 million), Florida (21.0 million) and New York (19.8 million).
From Table 1, those same four states, and in the same order, are situated at the top of the ranking for the size of their construction workforces.
California has 864,000 construction workers, followed by Texas (763,000), Florida (542,000) and New York (416,000).
There is a next tier of seven states with construction payrolls of more than 200,000 but less than 300,000 – Pennsylvania, Illinois, Ohio, North Carolina, Washington, Virginia and Georgia.
In a joint U.S.-Canada comparison, Ontario (with a population of 14.4 million) would place fourth for number of construction workers (534,000), behind Florida and ahead of New York.
Alberta, Quebec and British Columbia would also appear prominently in U.S.-Canada combined, since their construction workforces exceed 200,000.
| U.S. States – Construction Employment | |||
| June 2018 – Not Seasonally Adjusted (NSA) | |||
| Rank | State | No. of Workers | |
| 1 | California | 863,600 | |
| 2 | Texas | 763,100 | |
| 3 | Florida | 541,700 | |
| 4 | New York | 415,500 | |
| 5 | Pennsylvania | 265,500 | |
| 6 | Illinois | 241,800 | |
| 7 | Ohio | 237,300 | |
| 8 | North Carolina | 221,400 | |
| 9 | Washington | 211,700 | |
| 10 | Virginia | 203,700 | |
| 11 | Georgia | 201,800 | |
| 12 | Michigan | 187,100 | |
| 13 | Colorado | 174,400 | |
| 14 | Massachusetts | 168,100 | |
| 15 | Maryland | 167,100 | |
| 16 | Arizona | 161,300 | |
| 17 | New Jersey | 157,300 | |
| 18 | Louisiana | 152,100 | |
| 19 | Indiana | 150,600 | |
| 20 | Minnesota | 136,100 | |
| 21 | Wisconsin | 133,600 | |
| 22 | Tennessee | 124,400 | |
| 23 | Missouri | 124,200 | |
| 24 | Oregon | 106,800 | |
| 25 | Utah | 106,400 | |
| 26 | South Carolina | 99,700 | |
| 27 | Nevada | 91,400 | |
| 28 | Alabama | 87,900 | |
| 29 | Iowa | 84,400 | |
| 30 | Kentucky | 79,100 | |
| 31 | Oklahoma | 77,800 | |
| 32 | Connecticut | 65,300 | |
| 33 | Kansas | 63,000 | |
| 34 | Nebraska | 54,700 | |
| 35 | Arkansas | 53,000 | |
| 36 | Idaho | 50,000 | |
| 37 | New Mexico | 48,700 | |
| 38 | Mississippi | 45,100 | |
| 39 | Hawaii | 36,300 | |
| 40 | West Virginia | 35,300 | |
| 41 | Maine | 31,500 | |
| 42 | Montana | 31,100 | |
| 43 | North Dakota | 29,800 | |
| 44 | New Hampshire | 29,400 | |
| 45 | South Dakota | 25,200 | |
| 46 | Delaware | 23,300 | |
| 47 | Wyoming | 21,600 | |
| 48 | Rhode Island | 20,400 | |
| 49 | Alaska | 17,200 | |
| 50 | Vermont | 16,300 | |
| 51 | District of Columbia | 16,100 | |
| Canadian Provinces – Construction Employment | |||
| June 2018 – Seasonally Adjusted (SA) | |||
| Rank | Province | No. of Workers | |
| 1 | Ontario | 534,000 | |
| 2 | Alberta | 251,600 | |
| 3 | Quebec | 247,600 | |
| 4 | British Columbia | 234,200 | |
| 5 | Atlantic Region | 79,800 | |
| 6 | Saskatchewan | 50,900 | |
| 7 | Manitoba | 47,700 | |
Data for Canada’s northern territories is not available.
Table: ConstructConnect.
Table 2 highlights that the regional distribution of construction’s employment pickup in the U.S. has been widespread. There have been construction job hikes in 42 states, plus the District of Columbia, over the past year. Only eight states have recorded declines.
In Canada, the big gains in construction employment have been narrowly focused, occurring in just two provinces, Alberta (+7.0% y/y) and Ontario (+6.0%).
According to percentage increases, the states that have been leading U.S. construction jobs growth have been: Arizona, +10.0% y/y; Georgia, +9.1%; Michigan, +8.3%; Oregon, +7.8%; West Virginia, +7.6%; and Massachusetts and New Hampshire, both +7.3%.
The five states demonstrating the most weakness in construction employment have been: South Carolina, -3.3% y/y; New Jersey and Missouri, tied at -2.4%; Alaska, -1.1%; and North Dakota, -1.0%.
In nominal terms, the states with the most uplift in construction employment have been the four population and workforce frontrunners: California, +44,300; Texas, +42,500; Florida, +32,800; and New York, +19,300.
Another five states have managed construction jobs increases of more than 10,000 since the mid-point of last year: Georgia, +16,900; Arizona, +14,600; Michigan, +14,400; Massachusetts, +11,500; and Illinois, +11,000.
Ontario, +30,200, and Alberta, +16,500, have also achieved outsized gains in construction employment during the latest 12 months.
| U.S. States – % Change in Construction Employment | |||
| June 2018 vs June 2017 – Based on NSA Data | |||
| Rank | State | No. of Workers | |
| 1 | Arizona | 10.0% | |
| 2 | Georgia | 9.1% | |
| 3 | Michigan | 8.3% | |
| 4 | Oregon | 7.8% | |
| 5 | West Virginia | 7.6% | |
| 6 | Massachusetts | 7.3% | |
| 6 | New Hampshire | 7.3% | |
| 8 | Nevada | 6.8% | |
| 9 | Wisconsin | 6.6% | |
| 10 | Florida | 6.4% | |
| 11 | Rhode Island | 6.3% | |
| 12 | Connecticut | 6.2% | |
| 12 | Utah | 6.2% | |
| 14 | Maine | 6.1% | |
| 14 | New Mexico | 6.1% | |
| 16 | Texas | 5.9% | |
| 17 | Idaho | 5.7% | |
| 18 | California | 5.4% | |
| 18 | Delaware | 5.4% | |
| 20 | Indiana | 5.0% | |
| 21 | New York | 4.9% | |
| 21 | Wyoming | 4.9% | |
| 23 | Illinois | 4.8% | |
| 24 | North Carolina | 4.5% | |
| 25 | Colorado | 4.4% | |
| 26 | Iowa | 3.8% | |
| 27 | Alabama | 3.7% | |
| 27 | Minnesota | 3.7% | |
| 27 | Washington | 3.7% | |
| 30 | Mississippi | 3.4% | |
| 31 | Virginia | 3.2% | |
| 32 | South Dakota | 2.9% | |
| 33 | Montana | 2.6% | |
| 34 | Louisiana | 2.4% | |
| 34 | Tennessee | 2.4% | |
| 36 | District of Columbia | 1.9% | |
| 36 | Kansas | 1.9% | |
| 36 | Nebraska | 1.9% | |
| 39 | Ohio | 1.8% | |
| 40 | Pennsylvania | 1.5% | |
| 41 | Arkansas | 1.1% | |
| 41 | Maryland | 1.1% | |
| 43 | Hawaii | 0.0% | |
| 44 | Oklahoma | -0.3% | |
| 45 | Kentucky | -0.5% | |
| 46 | Vermont | -0.6% | |
| 47 | North Dakota | -1.0% | |
| 48 | Alaska | -1.1% | |
| 49 | Missouri | -2.4% | |
| 49 | New Jersey | -2.4% | |
| 51 | South Carolina | -3.3% | |
| Canadian Provinces – % change in Construction Employment | |||
| June 2018 vs June 2017 – Based on SA Data | |||
| Rank | Province | % change No. of Workers | |
| 1 | Alberta | 7.0% | |
| 2 | Ontario | 6.0% | |
| 3 | British Columbia | 0.3% | |
| 4 | Quebec | -0.4% | |
| 5 | Manitoba | -1.6% | |
| 6 | Saskatchewan | -1.9% | |
| 7 | Atlantic Region | -2.9% | |
Data for Canada’s northern territories is not available.
Table: ConstructConnect.
Graphs 1 through 4 show how current construction employment levels in Florida, California, New York and Texas compare with their previous peaks.
While construction employment in Florida has recovered to a significant degree, its latest level is still 21.7% below its earlier highwater mark.
Chart: ConstructConnect.
Like Florida, California is not all the way back, but its shortfall is a more modest 8.5%.
Chart: ConstructConnect.
Now for the success stories. The present level of construction employment in the state of New York is 9.3% above its prior ‘best’. And Texas has surged beyond its 2008 summit by 11.4%.
Chart: ConstructConnect.
Chart: ConstructConnect.
The two accompanying maps show the year-over-year change in state construction employment in a slightly different light.
The states shaded in green have recorded construction jobs increases greater than the national average of +4.1%. As set out in the ‘legend’, the deeper the shade of green, the faster the rate of jobs improvement.
The states shaded in blue have fallen below the national rate of construction jobs increase. The more intense the hue of blue, the further they have stumbled behind.
The split between green and blue is as even as it can be. There are 25 states that have beaten the national average and there are 25 states, plus the District of Columbia, that are stragglers.
The even distribution is another confirmation that the overall strength in construction employment in the U.S. is not due to any small cluster of states.
Regionally, there’s good news on many fronts.
Data source: Bureau of Labor Statistics (BLS).
Graphic: ConstructConnect.
Map 1: U.S. State Construction Employment, June 2018 vs June 2017
(greater than the U.S. nation-wide rate of +4.1%)
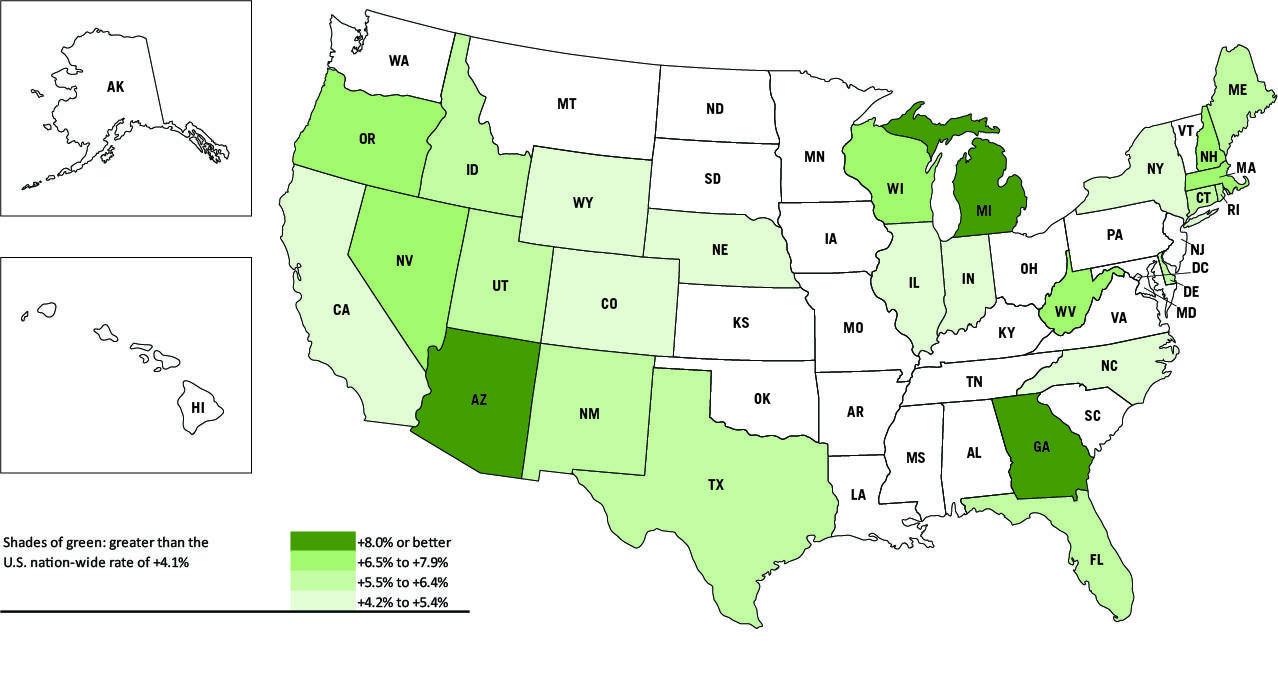
Data source: Bureau of Labor Statistics (BLS).
Graphic: ConstructConnect.
Map 2: U.S. State Construction Employment, June 2018 vs June 2017
(lower than the U.S. nation-wide rate of +4.1%)

Data source: Bureau of Labor Statistics (BLS).
Graphic: ConstructConnect.


Recent Comments
comments for this post are closed