The Trump Administration in Washington has recently imposed $200 billion in tariffs on imports from China. Included in those new duty assessments are auto parts.

This action, along with another key development in Mexico, has introduced a strange twist into the dynamics of where, in North America, motor vehicle assemblers may wish to carry out future capital spending.
Before getting into the meat of the matter, however, let’s first examine the history of motor vehicle demand in the U.S. and Canada, as set out in Graphs 1 through 3.
Graphs 1 and 2 show the shift that has been occurring in consumer demand away from passenger cars and towards what are known in the industry as ‘light trucks’. The designation ‘light trucks’ includes trucks short of heavy-duty freight haulers and it also encompasses a vast array of highly popular vans and SUVs.
Fuel efficiency is still best among cars, but ‘light trucks’ have also made significant strides in reducing energy consumption, going partly electric and lowering harmful carbon emissions.
The clearly-defined switchover to greater consumer demand for ‘light trucks’ versus passenger cars began four years earlier in Canada (in early 2010) than in the U.S. (in early 2014).
Graph 1: Motor vehicle sales in the U.S.
(12-month moving totals)
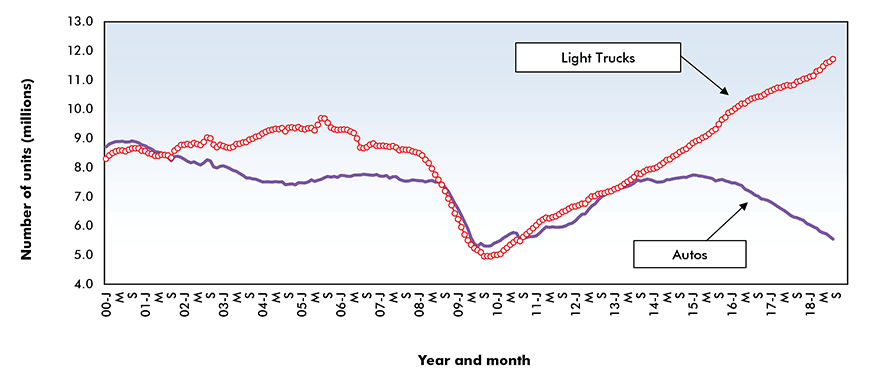
Data source: U.S. Bureau of Economic Analysis (BEA) / Chart: ConstructConnect – CanaData.
Graph 2: Motor vehicle sales in Canada
(12-month moving totals)
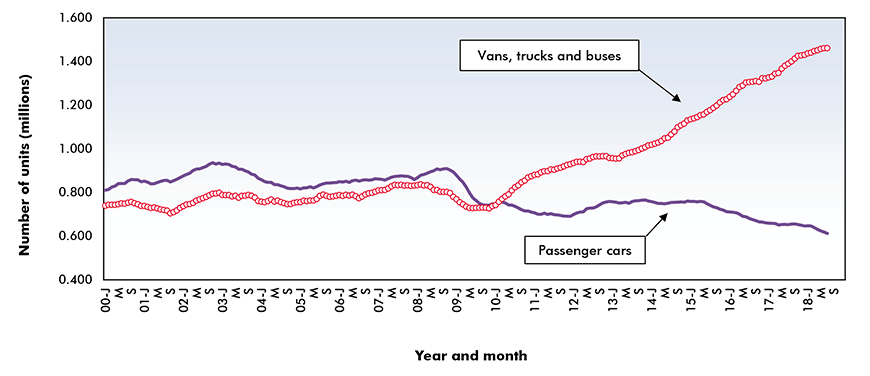
Data source: Statistics Canada / Chart: ConstructConnect – CanaData.
Graph 3 highlights that total annualized demand (in units) for motor vehicles in the U.S. has returned to the same level (about 17.5 million) as before the 2009 recession, but it has stayed flat over the past three years.
After mid-2009, Canadian annualized demand for motor vehicles climbed steadily and the level at present (close to 2.1 million units) has far surpassed its former peak.
Lately, Canada has proven to be the better motor vehicles sales market.
Graph 3: Total motor vehicle sales in the U.S. and Canada
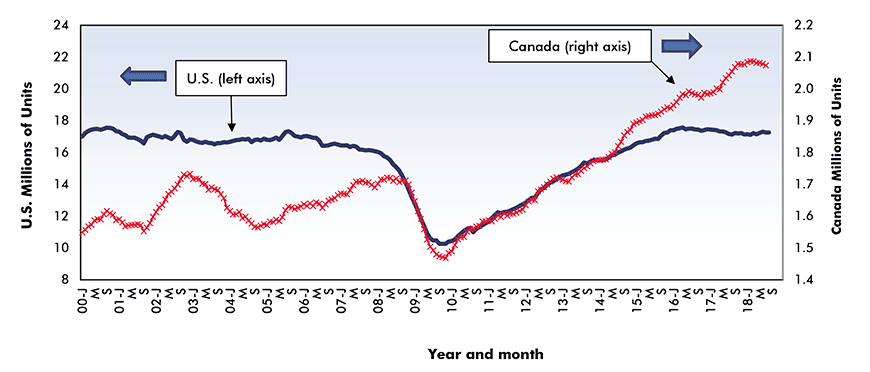
Data source: U.S. Bureau of Economic Analysis (BEA) / Chart: ConstructConnect – CanaData.
But it is the U.S. that has imposed tariffs on Chinese imports and that exceptional turn of events warrants studying the import numbers in Table 1.
How big a role does the import factor play in total U.S. auto sector demand?
From January to July of this year, the value of total U.S. motor vehicle and parts imports was $211 billion USD. For the same time frame, U.S. retail sales of motor vehicles and parts – a figure which includes transportation and profit markups – was $720 billion USD.
Drawing from another source, the unit numbers on assembled vehicle sales from the Bureau of Economic Analysis (BEA) indicate that imports are a little more than 20% of total U.S. car and ‘light truck’ sales. (This has nothing to say about ‘parts’ imports.)
Whether it be in terms of assembled vehicles or auto parts, Mexico is the major import supplier to the U.S. For the period January-to-July of this year, Mexico supplied 30% of ‘car and light truck’ imports; 38% of ‘parts’ imports; and 34%, or one-third, of total U.S. auto sector imports.
From the top portion of Table 1, China is near the bottom of the ranking-list (in ninth position) as a supplier of assembled cars and light trucks to the U.S.
It’s in the middle portion of Table 1, however, where the more gripping plot line unfolds.
With respect to ‘parts’ imports, China is in second spot as a foreign supplier.
The new tariffs are 10% at present, going to 25% at the beginning of 2019.
There could be a dramatic impact on U.S. motor vehicle costs. Auto industry executives and analysts are warning that the price of some U.S. vehicles may rise by thousands of dollars due to the tariffs on Chinese ‘parts’.
(January-April 2018)
| Car & Light Truck Imports (including SUVs & Vans), | |||||||
| Top 10 Supplier Nations (94% of total) | |||||||
| Rank by Share | % Change Ytd 2018/Ytd 2017 |
||||||
| Country of Origin | $ Billions USD | % of Total | |||||
| (1) | Mexico | $36.6 | 7.6% | 30.3% | |||
| (2) | Canada | $24.8 | -8.5% | 20.5% | |||
| (3) | Japan | $23.5 | 3.0% | 19.5% | |||
| (4) | Germany | $10.3 | -11.2% | 8.5% | |||
| (5) | South Korea | $7.7 | -23.1% | 6.4% | |||
| (6) | United Kingdom | $5.6 | 4.2% | 4.7% | |||
| (7) | Italy | $2.6 | 3.9% | 2.2% | |||
| (8) | Sweden | $1.5 | 36.3% | 1.3% | |||
| (9) | China | $1.1 | -8.4% | 0.9% | |||
| (10) | Thailand | $0.1 | 30.6% | 0.1% | |||
| Sub-total of 10 | $113.9 | -1.7% | |||||
| Total | $120.7 | -0.4% | |||||
| Parts Imports, | |||||||
| Top 10 Supplier Nations (87% of total) | |||||||
| Rank by Share | % Change Ytd 2018/Ytd 2017 |
||||||
| Country of Origin | $ Billions USD | % of Total | |||||
| (1) | Mexico | $34.4 | 5.0% | 37.9% | |||
| (2) | China | $11.2 | 11.0% | 12.4% | |||
| (3) | Canada | $10.1 | 7.6% | 11.1% | |||
| (4) | Japan | $9.0 | 3.1% | 9.9% | |||
| (5) | Germany | $5.7 | -0.1% | 6.2% | |||
| (6) | South Korea | $4.8 | -4.1% | 5.2% | |||
| (7) | Thailand | $2.0 | 10.7% | 2.2% | |||
| (8) | Italy | $1.0 | 60.2% | 1.1% | |||
| (9) | United Kingdom | $0.8 | 7.2% | 0.9% | |||
| (10) | Sweden | $0.2 | 28.2% | 0.2% | |||
| Sub-total of 10 | $79.2 | 5.6% | |||||
| Total | $90.8 | 5.6% | |||||
| Cars + Light Truck + Parts Imports | |||||||
| Top 10 Supplier Nations (91% of total) | |||||||
| Rank by Share | % Change Ytd 2018/Ytd 2017 |
||||||
| Country of Origin | $ Billions USD | % of Total | |||||
| (1) | Mexico | $71.0 | 6.3% | 33.6% | |||
| (2) | Canada | $34.9 | -4.3% | 16.5% | |||
| (3) | Japan | $32.5 | 3.1% | 15.4% | |||
| (4) | Germany | $15.9 | -7.6% | 7.5% | |||
| (5) | South Korea | $12.5 | -16.8% | 5.9% | |||
| (6) | China | $12.3 | 8.9% | 5.8% | |||
| (7) | United Kingdom | $6.5 | 4.6% | 3.1% | |||
| (8) | Italy | $3.7 | 15.3% | 1.7% | |||
| (9) | Thailand | $2.1 | 11.7% | 1.0% | |||
| (10) | Sweden | $1.7 | 35.3% | 0.8% | |||
| Sub-total of 10 | $193.1 | 1.2% | |||||
| Total | $211.4 | 2.1% | |||||
Chart: ConstructConnect.
Price Gap, U.S. versus Canada, to diminish:
Americans have long paid less for their modes of vehicular transport than Canadians. There have been longstanding price gaps for cars, SUVs and light trucks that have favored U.S. consumers.
In a strange twist of fate, it appears the U.S. is ‘voluntarily’ reducing, maybe even eliminating, that discrepancy.
Furthermore, a trading agreement has recently been reached between the U.S. and Mexico that will require a big boost in the wages to be paid to auto sector workers in the latter nation.
If Canada emerges unscathed (i.e., free of U.S. tariffs) from the ongoing NAFTA-upgrade talks, the country will soon gain a notable cost advantage in motor vehicle assembly operations from unfettered access to foreign parts sources.
Major auto assemblers will have a new important reason to look to Canada when considering future large-scale investments.


Recent Comments
comments for this post are closed