There is a widely-adopted ‘rule of thumb’ that says when comparing the U.S. versus Canada, a ten times factor can be applied. It’s supposedly based on population levels.

The ten-to-one (10:1) ratio, however, has become outdated. It was true once, but no longer. In more recent years, the population of Canada has been growing faster than America’s. The ratio now, with the U.S. at 325.9 million people and Canada at 36.7 million, is 9:1.
The purpose of this article is to examine the employment records of the two countries in specific industrial sub-sectors to highlight where the ‘relative’ equivalencies and mismatches occur. One obvious question, is whether Canada is keeping up with the U.S. (i.e., in relative terms) in the creation of high-tech jobs, which will be the key to future prosperity.
The relative performances in jobs generation are most clearly shown in graphs. In the 18 graphs accompanying this article, the scale of the right-hand vertical axis for the U.S. is eight times the left-hand scale for Canada.
Why is a ratio of 8:1 being used rather than 9:1? There’s a rather esoteric explanation. It resides in the realm of economic ‘geekdom’.
In both countries, labor market statistics are calculated in two ways – by means of an employer survey and by means of a household survey. With respect to the number-of-jobs calculation, the latter yields somewhat higher results than the former.
The jobs numbers that are widely taken as most authoritative in the U.S. are derived from the Bureau of Labor Statistics (BLS)’s ‘employer survey’. North of the border, the jobs figures most often quoted come from Statistics Canada’s ‘household survey’.
As can be seen from Graph 1, the curves for total jobs in the U.S. (from the employer survey) and in Canada (from the household survey) line up quite closely when an eight times factor is utilized for the U.S. vertical axis compared with the Canadian.
The relative positions of the curves in the 18 graphs reveal how the two countries are performing vis-à-vis each other in all the specific sub-categories of industrial activity.
Graph 1 − Total Employment:
Several features stand out in Graph 1. The U.S. clearly suffered a much greater drop in total employment in the 2008-2009 recession than did Canada. The pickup in jobs from 2010 through 2015 was, however, much faster in the U.S. From 2016 to the present, Canada has ‘upped its game’ and has managed the same solid upward trajectory as in America.
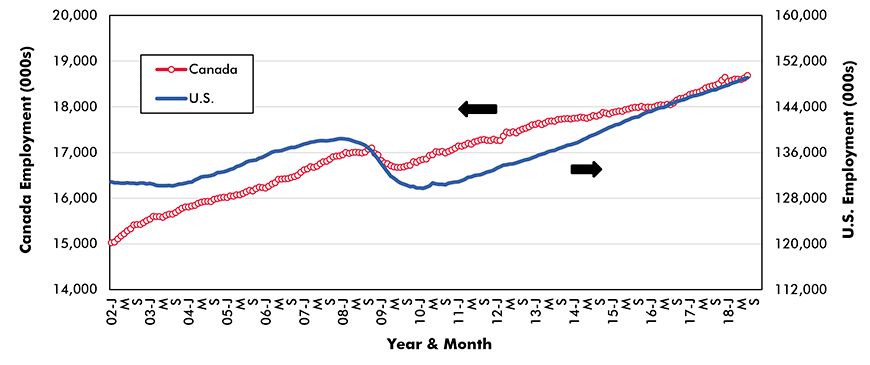
Chart: ConstructConnect.
Graph 2 − Computer System Design Services:
For much of the 00s, Canada displayed lackluster gains in ‘computer systems and design services’ jobs. In 2013, however, the Canadian curve suddenly launched into orbit. Presently, Canadian employment in this corner of hi-tech has almost caught up with (i.e., in relative terms) a U.S. counterpart that has been growing impressively all along.
As a point of interest, there are more behind-the-scenes jobs in ‘computer systems and design services’ than in ‘hotel and motel’ work in both the U.S. and Canada. The strength of employment in this sector is particularly noteworthy given the tendency for so many firms to outsource their ‘backroom’ functions to data management firms in other countries (e.g., India).
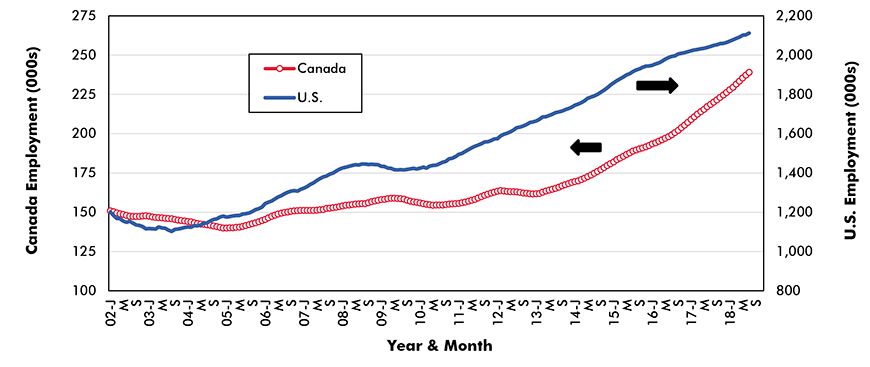
Chart: ConstructConnect.
Graph 3 − Software Publishing:
Since the mid-00s, both the U.S. and Canada have been achieving significant growth in ‘software publishing’ jobs. The Canadian curve, while generally rising, has displayed a bit more volatility and while it has bobbed up against the U.S. curve, it has never quite climbed above it.
The U.S. has the advantage of world-leadership in software development, with many of the best minds congregating in such high-tech hubs as Silicon Valley (San Jose and San Francisco), Seattle, Boston, Washington and Austin. In Canada, Ottawa (Nortel) and Kitchener-Waterloo (Blackberry) were the original leaders in computer-aided communications development.
Lately, though, it’s been Toronto where the biggest advances in STEM (science, technology, engineering and math) hiring have been occurring. Montreal has also picked up the pace and is becoming well known for its digital game-writing community.
There’s an important symbiotic relationship between computer coding work and construction activity. The construction industry will only achieve greater profitability through the adoption of processes (BIM) and products (wearable devices; VR) that enhance productivity. At the same time, the research and development work needed to attain an intellectual ‘leap forward’ requires office and lab space, spurring on the demand for new square footage.
Twenty cities are eagerly awaiting word on which of them will become the location for Amazon’s second headquarters (HQ2). Apple has also expressed an intent to proceed with an HQ2 further afield than in California. After its Cupertino HQ1, Apple’s second biggest ‘footprint’ is in Austin, Texas.

Chart: ConstructConnect.
Graph 4 − Telecommunications:
In the U.S., the number of jobs in the telecommunications sector has been steadily declining for at least 17 years. Displaying quite a different pattern, telecommunications employment in Canada has stayed even over the entire span of years covered in Graph 4.
Due to stringent government regulation, there are only three major players in the telecommunications sector in Canada – Bell, Rogers and Telus. Attempts at entry into the Canadian market by U.S. firms have so far been rebuffed. Apparently, this has been positive for maintaining pay checks. What’s not as clear is whether Canadian consumers are being well served by the minimal degree of competition.
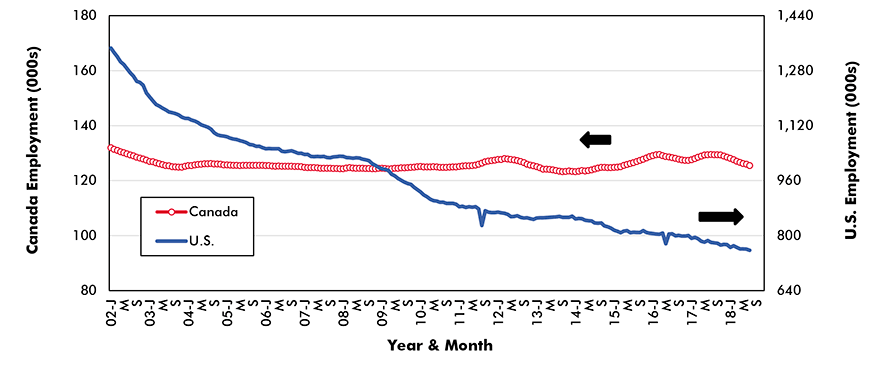
Chart: ConstructConnect.
Graph 5 − Call Centers and Telemarketing:
Except for some recent leveling in employment, ‘call center and telemarketing’ staffing in the U.S. has been sloping upwards for a long time. Even the recession had very little impact on the number of jobs in the sector. By way of contrast, such employment in Canada reached a peak in mid-2008, then fell by one-third over the next five years to mid-2013. During the past two-and-a-half years, it’s been on a gentle recovery path.
The long-term shapes of the curves for ‘call center and telemarketing’ and ‘telecommunications’ jobs in the U.S. have been moving in opposite directions – i.e., upwards for the former versus downwards for the latter. In 2002, there were nearly twice as many jobs in the U.S. telecommunications sector as in call center and telemarketing work. Now, payrolls with call center and telemarketing firms are plumper than with telecommunications firms.
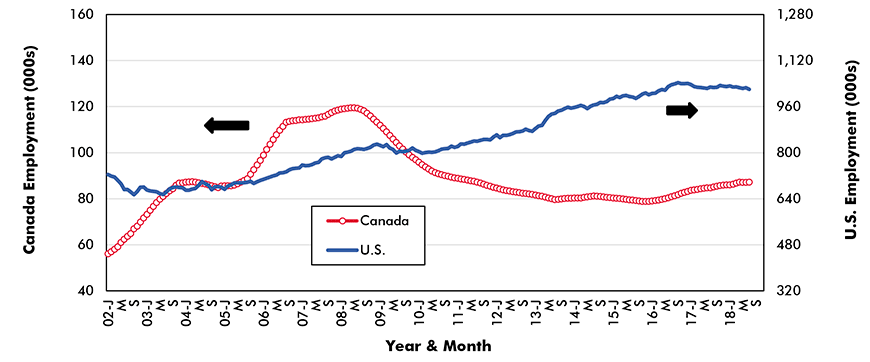
Chart: ConstructConnect.
Graph 6 − Movies, Videos and Music Production:
We’re all dealing with increasingly fast-paced and stressful lifestyles that depend on entertainment as a safety valve. Thank goodness for ‘movie, video and music production’. This is one of the smaller industrial sub-sectors in terms of providing employment, but its importance in capturing societal change while dishing out healthy servings of fun cannot be overstated.
The U.S. film and music scenes are hottest in Hollywood, Nashville, Atlanta and the Big Apple. North of the border, in English-speaking Canada, camera crews and recording studios are busiest in Vancouver and Toronto. La belle province, Quebec, has its own French-speaking broadcast studios. And if rugged exterior shots are needed, filmmakers often turn to Alberta.
As can be seen in Graph 6, Canadian employment in ‘movie, video and music production’ has been racing to catch up with America’s level. Crossover was achieved at the beginning of this year.
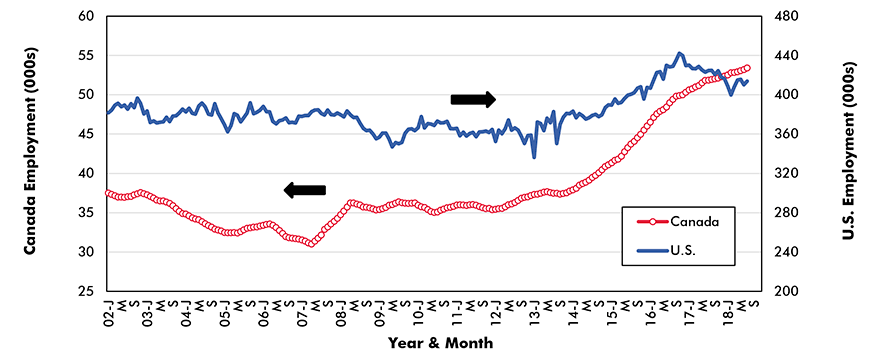
Chart: ConstructConnect.
Graph 7 − Warehousing and Storage:
‘Warehousing and storage’ employment is an area of jobs creation where Canada obviously, as depicted in Graph 7, has not been keeping up with the U.S. The shift away from ‘bricks and mortar’ retailing in favor of online sales platforms and e-based auctioneering has necessitated the construction of large-scale distribution centers.
In 2018, many of the projects appearing in ConstructConnect’s monthly Top 10 construction starts lists have been data and fulfilment centers for the likes of Apple, Amazon and Facebook. Canada has not been acquiring a matching share of this work.
With Canadian jobs in ‘warehousing and storage’ staying flat since 2007, the disparity with the U.S. has grown more glaring, especially since the rapid take-off in such work south of the border since early 2015.
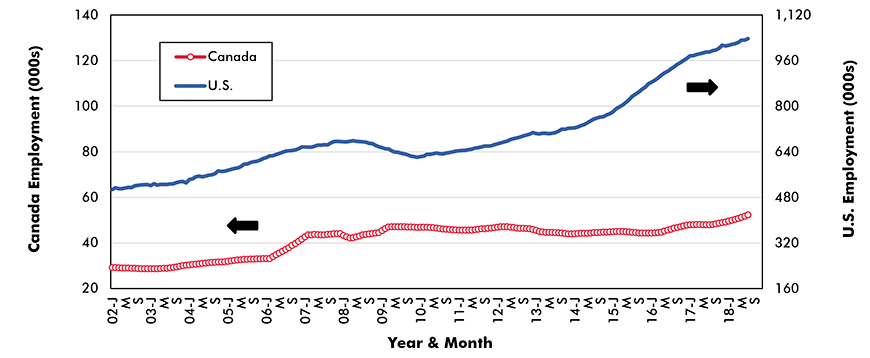
Chart: ConstructConnect.
Graph 8 − Hotels and Motels:
The feverish expansion of jobs in the U.S. ‘hotel and motel’ sector since the recession has corresponded with a cyclical peak in accommodation construction spending. According to ConstructConnect, the dollar volume of hotel/motel construction starts in 2017-2018 has been many times greater than it was in its most recent trough period, in 2011.
The drivers of ‘hotel and motel’ revenue have moved far beyond basic business and tourism travel. In many instances, there are close tie-ins with casino and convention center activity.
It might be supposed that Canada’s lowered-valued currency would be a strong draw for international visitors, thus boosting occupancies and the jobs level. Perhaps some of that effect is behind the climb in Canada’s hotel and motels jobs curve since the recession. But the uptick has fallen well short of what has been happening in the U.S.
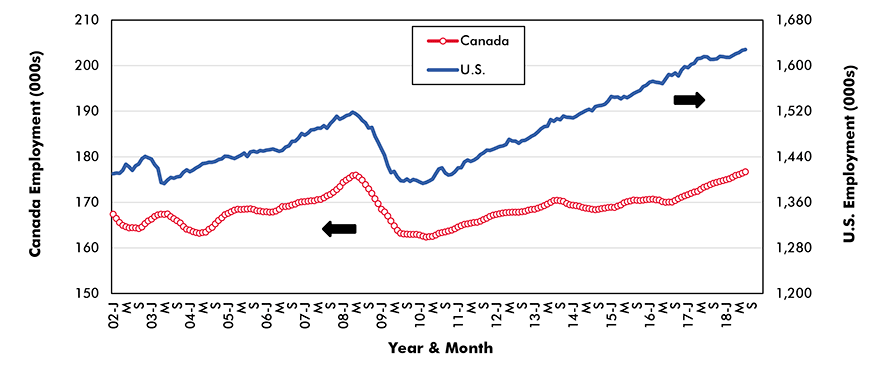
Chart: ConstructConnect.
Graph 9 − Food Services and Drinking Places:
While tracing an almost parallel path, the level of Canadian employment in ‘food services and drinking places’ has been no match, relatively speaking, for the American experience. In both countries, this sector provides high numbers of jobs and there have been nice increases over time. But a quibble that analysts often interject is that such work is usually low-paying.
Better ‘animal spirits’ south of the border arising from superior stock market advances (i.e., the DJI, S&P 500 and NASDAQ all beating the TSX), a 50-year low unemployment rate and outstanding consumer confidence are helping to propel a speedy ascent in U.S. ‘food services and drinking place’ jobs.
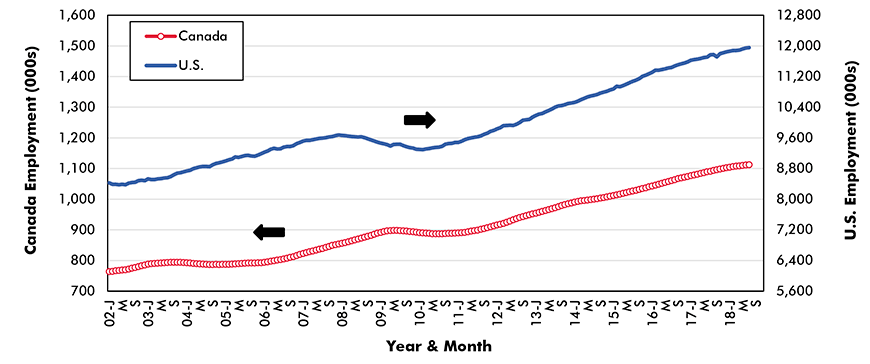
Chart: ConstructConnect.
Graph 10 − Total Manufacturing:
Graph 10 will likely be an eye-opener for many readers. In relative terms, there are more manufacturing jobs in Canada than in the U.S.
Both countries struggled with severe manufacturing employment losses in the 00s, due to more automation and robotics being introduced on production lines and the offshoring of positions to countries with lower pay scales and weaker governing standards with respect to working conditions.
Since the depths of the 2008-2009 recession, the number of U.S. manufacturing jobs has been inching upwards. Over the same time frame, Canada’s manufacturing jobs performance has stayed stagnant.
A major intent of the big U.S. corporate tax cut, from 35% to 21%, is to bring American manufacturers back home from abroad and to stimulate domestic employment in the sector.
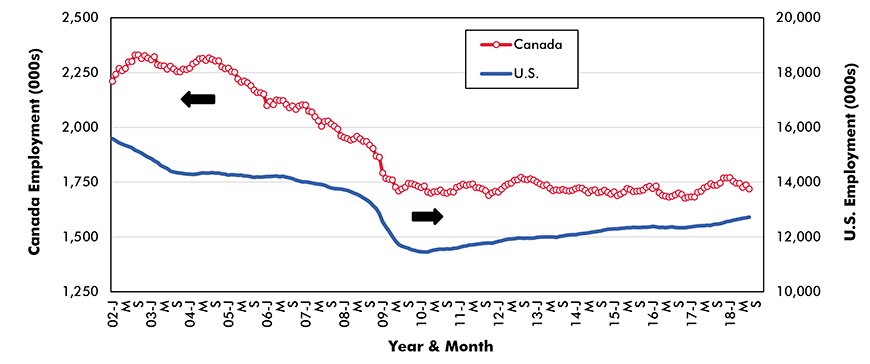
Chart: ConstructConnect.
Graph 11 − Motor Vehicle and Parts Manufacturing:
The establishment of foreign sources of production (e.g., in Mexico, Japan, South Korea and China) sharply curtailed ‘motor vehicle and parts manufacturing’ jobs in the U.S. and Canada from 2002 through 2009. (Chrysler and GM descended into temporary bankruptcy protection.) Thanks to safeguards in NAFTA, Canada’s job losses weren’t quite as steep as in the U.S.
Since mid-2012, there has been rough equivalency of employment in the motor vehicle sector in the U.S. and Canada. That delicate equilibrium was recently threatened when President Trump talked of tearing up NAFTA and imposing tariffs on Canadian auto and parts imports. Such a course of action would have seriously impaired back-and-forth supply chains.
A long and painful negotiating process has given birth to a new NAFTA, the USMCA trade agreement, which requires Mexico to pay a sizable number of its autoworkers more money and ups the North American content provision in new vehicle production. The offshoot is a sunnier prognosis for auto sector jobs in the U.S. and Canada.
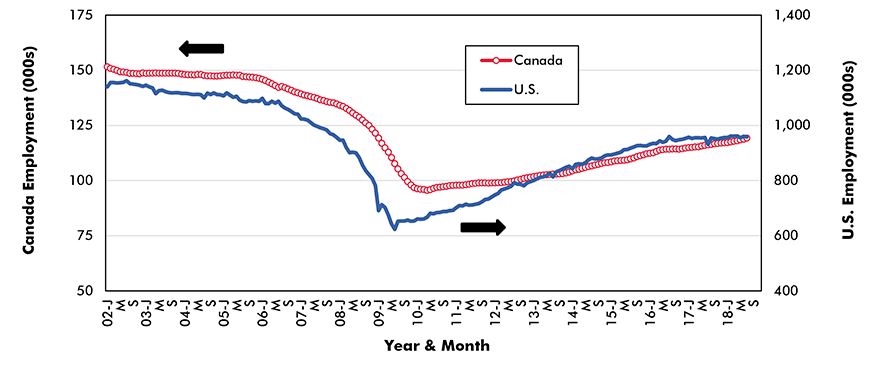
Chart: ConstructConnect.
Graph 12 − Food Manufacturing:
In ‘food (and drink) manufacturing’ jobs, Canada lost some of its lead on the U.S. in 2016-2017.
In 2018, however, Canadian jobs in the sector have been shooting higher, restoring much of the gap that was earlier in place.
When manufacturing jobs are mentioned, the focus is often on the auto sector. It’s an interesting sidebar that the number of jobs in food and drink manufacturing in both the U.S. and Canada exceeds the worker count on vehicle and parts production lines. In Canada, the ratio is currently two-to-one (2:1); in the U.S. one-point-seven-to-one (1.7:1.0).
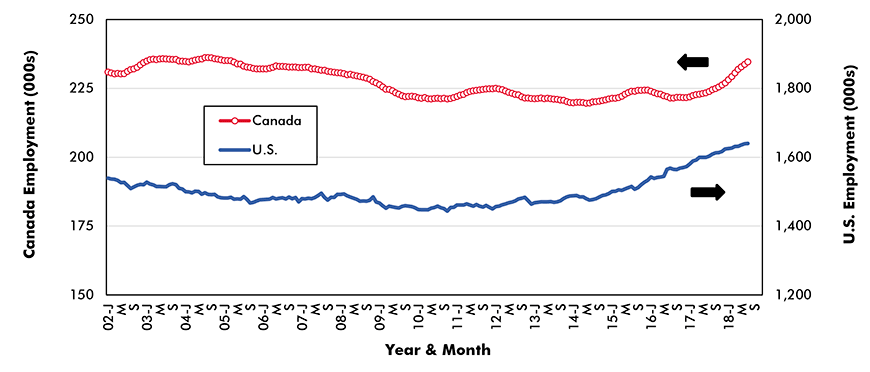
Chart: ConstructConnect.
Graph 13 − Aerospace Product Manufacturing:
As incomes and wealth levels continue to improve in emerging nations, air travel worldwide is expected to expand exponentially in the years ahead. Major international airport construction is a global phenomenon.
In relative terms, the U.S. is vastly outdistancing Canada in aerospace product manufacturing jobs. Of course, the U.S. is home to one of the two premier large aircraft manufacturers in the world, Boeing. (Europe’s Airbus is the other.) In the turboprop and smaller regional jet market, Bombardier has long been Canada’s champion, but it was recently absorbed by Airbus.
Thanks to Boeing’s Seattle-based production facilities, Washington is ranked third among states for U.S. dollar-volume export sales. There are other pockets of strong aircraft manufacturing activity scattered throughout the U.S. – e.g., Wichita, Kansas (private jets).
Trying to push aside the boundaries of science fiction, and widen the opportunities for human space exploration, are a couple of U.S. billionaires. Amazon’s Jeff Bezos is backing Blue Origin and Tesla’s Elon Musk is the business celebrity behind SpaceX.
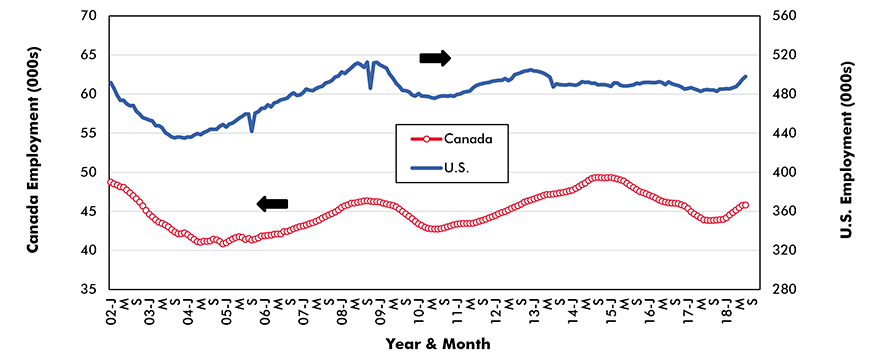
Chart: ConstructConnect.
Graph 14 − Cement and Concrete Product Manufacturing:
From 2007 to 2011, there was a one-third drop in the number of ‘cement and concrete manufacturing’ jobs in the U.S. From 2013 to the present, there has been a mild recovery. But cement and concrete product manufacturing employment has largely moved elsewhere (e.g., Mexico). Canada has done alright on this score. Canada’s jobs curve, with a few exceptions, has been proceeding gradually upwards over many years.
In other industrial areas where the U.S. has been experiencing a curtailment in domestic sources of supply – steel and aluminum – the current administration in Washington has responded by imposing tariffs on imports to stimulate more ‘in-house’ production. Of course, in the short term, these ‘surcharges’ are adding to construction material costs.
Fewer cement jobs in the U.S. has also been an offshoot of environmental crackdowns. With the change in government at the federal level in 2016, regulations to lower carbon emissions have been given a lower priority.
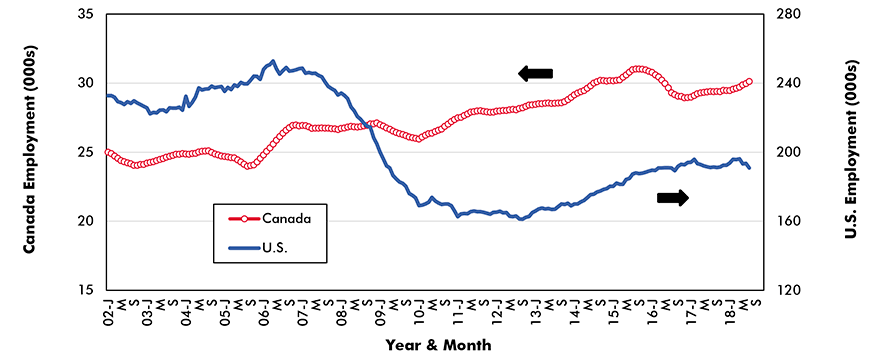
Chart: ConstructConnect.
Graph 15 − Construction:
Employment in construction in Canada was a little higher than in the U.S. (relatively speaking) prior to the 2008-2009 recession. During the recession, the disparity grew quite large and it has been maintained up to the present. It was the collapse in U.S. housing starts (-80% from peak to trough in number of units) that caused the enormous shrinkage in the construction workforce south of the border. Meanwhile, Canadian new home groundbreakings softened to a minor extent, but then quickly recovered.
From 2010 to 2014, Canadian construction employment was also supported by ongoing work on energy mega projects, particularly in Alberta. Much of that capital spending dried up, however, soon after the world price of oil plunged in mid-2014, due to Saudi Arabia abandoning supply management.
Over the past several years, it has been the U.S. that has had a faster rate of construction jobs growth. In fact, with immigration falling out of favor, the U.S. construction sector is now contending with an acute shortage of skilled trades persons.
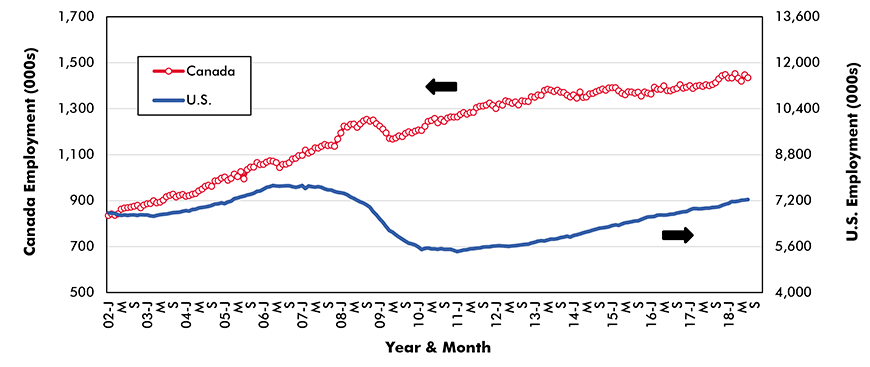
Chart: ConstructConnect.
Graph 16 − Architectural and Engineering Services:
Relative to the number of U.S. jobs in ‘architectural and engineering services’, Canada underachieved through most of the 00s, but then significantly overachieved from 2011 to 2016. During the past year-and-a-half, the curves have moved back into closer alignment.
The top design services companies are not constrained by merely domestic demand. They’ll seek out work in other countries, hoping to design, build and manage massive resource and transportation infrastructure projects. Currency values can be crucial in winning foreign contracts. For years, the U.S. dollar has been elevated (i.e., more expensive); the Canadian dollar, less sprightly (i.e., cheaper).
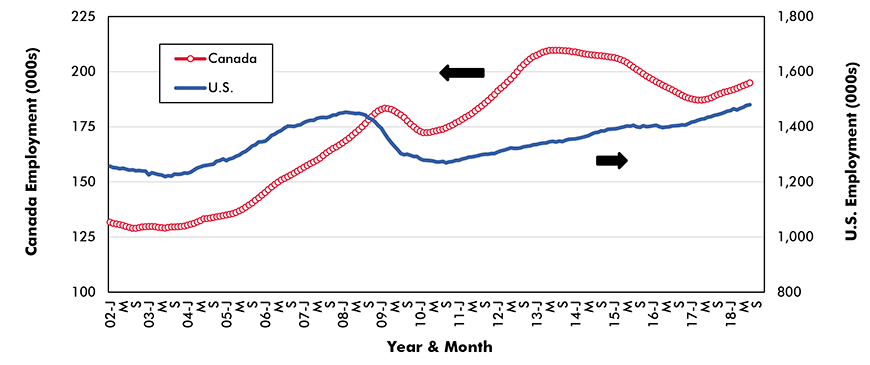
Chart: ConstructConnect.
Graph 17 − Building Materials and Supplies Dealers:
Graph 17 shows that since the Great Recession, near (relative) equivalency has been established in the number of U.S. and Canadian jobs with ‘building materials and supplies dealers’. The parity came after U.S. employment in the sector diminished by one-sixth from 2006 to 2009, while Canadian jobs doubled between 2002 and 2009.
The arrival of the big box do-it-yourself (DIY) stores in Canada (e.g., Home Depot and Lowe’s) have given a substantial lift to employment in the sector north of the border.
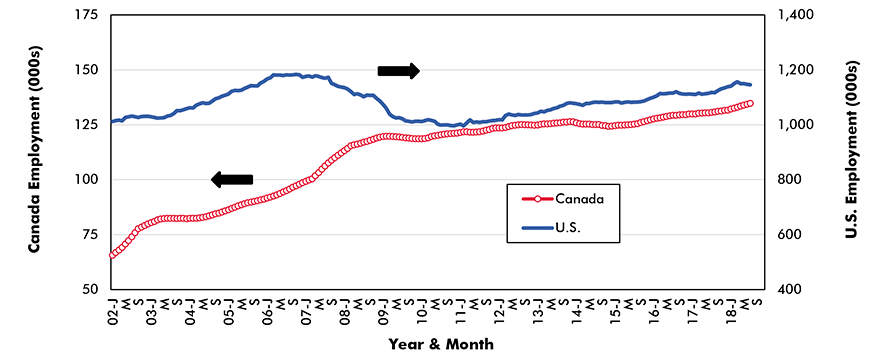
Chart: ConstructConnect.
Graph 18 − Truck Transportation:
Because freight haulers carry so much of the material that keeps economies humming, statistics on trucking are often viewed as a proxy for how national output growth is progressing. The curves setting out ‘truck transportation’ jobs for both the U.S. and Canada in Graph 18 have been encouraging for nearly a decade. It appears that Canada is a tad more dependent on truck transportation, relatively speaking, than the U.S.
Once the trucking industry moves deeper into autonomous vehicles, the whole notion of jobs in the industry serving as a proxy for GDP may evaporate.
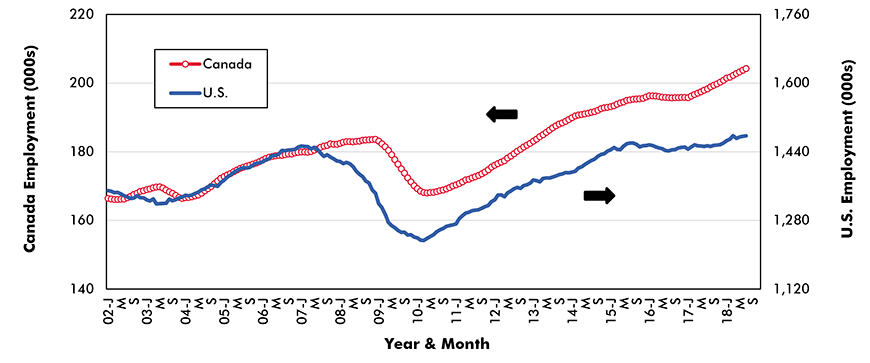
Chart: ConstructConnect.


Recent Comments