A key metric for new commercial tower construction is a city’s office vacancy rate, the lower the better. In turn, what drives office vacancy rates down is greater worker occupancy.

There are disruptors throughout the economy and the office space market is no exception.
Growth in the kinds of employment that used to account for most office-space demand is now being overtaken by different and often more temporary career paths.
The record of jobs creation in 12 industry sub-sectors is explored in Graphs 1 to 3 and in Table 1.
The dozen sub-sectors that have been chosen for study are the ones most clearly accounting for private sector office-space usage in the Bureau of Labor Statistics (BLS)’s monthly Employment Situation report.
The monthly jobs levels in each sub-sector have been converted to indices, with July 2009 chosen as the base (i.e., set equal to 100.0). July 2009 marked the end of the recession and the beginning of the positive turnaround that has prevailed up to the present.
To arrive at the index values for each series, post-July-2009 jobs level have been divided by July 2009’s jobs level (and multiplied by 100) in the following manner – e.g., if March 2014’s jobs level = 1,250 and July 2009 had been 1,000, then March 2014’s index value = 125.0.)
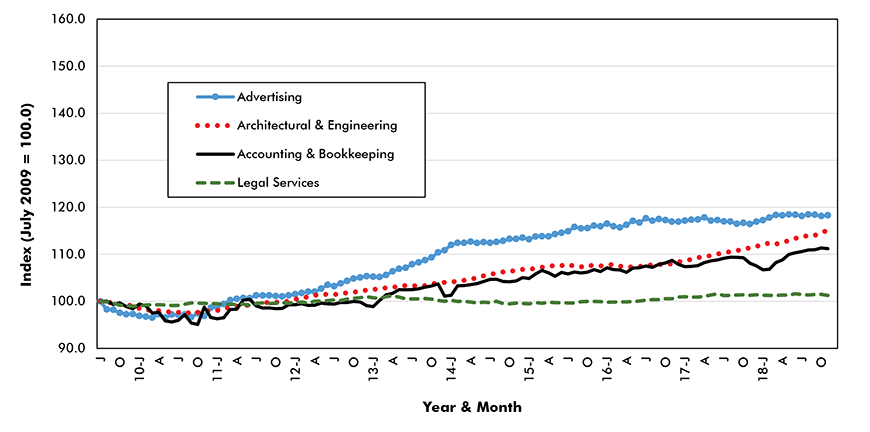
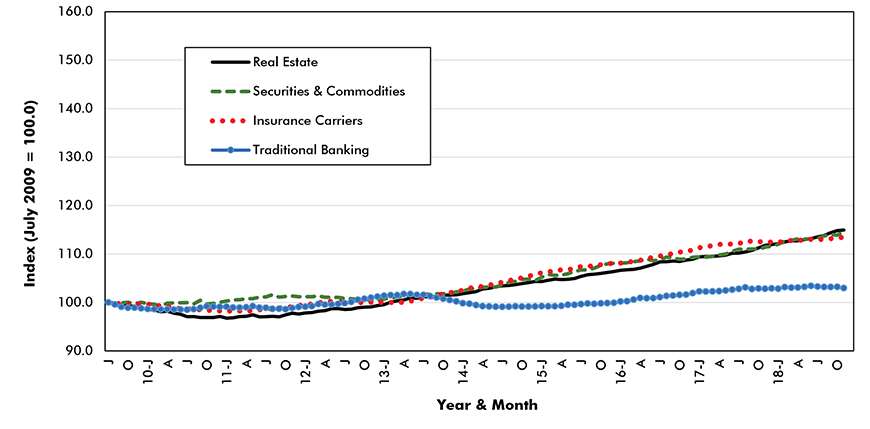
Featured in Graphs 1 and 2 are eight type-of-employment categories where the increases in the number of jobs since the recession have still not risen above +20%.
In Graph 1, the gains from such long-established providers of employment as advertising, architectural/engineering, accounting/bookkeeping and legal services firms have been muted
The recent record of hiring by legal services firms has been especially anemic.
Graph 1: Office Occupancy Jobs (1 of 3)

Chart: ConstructConnect — CanaData.
A similar pattern of weak payroll increases by companies engaged in real estate, securities and commodities trading, insurance protection and traditional banking is apparent in Graph 2.
Job openings with traditional/commercial banks have been particularly slow to materialize.
Graph 2: Office Occupancy Jobs (2 of 3)

Chart: ConstructConnect — CanaData.
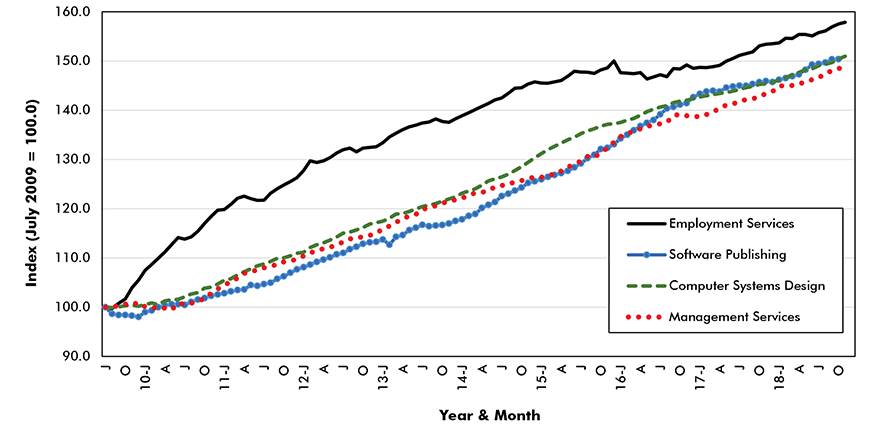
Graph 3 tells an entirely different story. All four sub-sectors – employment services, software publishing, computer systems design work and delivery of management services – have achieved jobs growth of between +50% and +60% over the past nine-and-a-half years.
All four of the sub-sectors in Graph 3 are key participants in the extraordinary changes that are underway in the economy at large.
Graph 3: Office Occupancy Jobs (3 of 3)

Chart: ConstructConnect — CanaData.
The explosion of work in software publishing and computer systems design clearly reflects the boom in the high-tech sector that has taken the NASDAQ stock index to such heights, even after its retreat of late.
The surge in ‘employment services’ work reflects a desire by both employers and employees to be more open in their working arrangements. Many members of a younger generation have been comfortable working ‘gigs’ that allow them to move around and to try out alternative lifestyles. Employers have been increasingly quick to turn to employment services to fulfill their manpower needs.
To provide background, ‘employment services’ includes: employment placement agencies and executive search services; temporary help services; and, interestingly, movie and theatrical casting agencies, as well as model and maid registries.
The fourth sub-sector with outsized jobs growth, management services, also encompasses a host of activities that have leapt forward in prominence. Examples include: environmental, economic, energy, logistics, and customs-and-tariffs consulting services; business start-up consulting services; reorganization and site selection consulting services; and benefits and compensation consulting services.
Table 1 takes the same data behind Graphs 1 to 3, but slightly alters the form. The percentage changes, July 1, 2009 to July 1, 2018 aren’t quite as dramatic because the jobs in each sector are expressed per capita. (To say ‘per capita’ is not perfectly accurate. To eliminate decimal points and make the numbers easier to read, jobs levels in Table 1 have been calculated per 100,000 population.)
The population of the U.S. shifted from 306.8 million at the beginning of the period (July 1, 2009) to 327.2 million at the end of the period covered (July 1, 2018).
Again, though, it’s employment services, computer systems design, management services and software publishing, among office-oriented type-of-work, that stand out. Their percent changes over the past nine-and-a-half years have ranged from +37% for management services to +46% for employment services.
An advantage of Table 1 is that it shows relative sizes of employment pools. The rankings in the first column are based on July 1, 2018 levels. ‘Employment services’, with 1,139 jobs per 100,000 population is at the top of the listing. (In the summer of 2009, ‘traditional banking’ was number one, with employment services and insurance carriers nearly tied for second.)
On a per-100,000-population basis, both traditional banking and legal services have slipped backwards, -3% and -5% respectively. Many financial transactions (formerly handled by bank tellers) and real estate transactions (formerly handled by lawyers) have migrated to the Internet.
Finally, the nature-of-employment changes underway are also prompting developers to become more flexible in their property offerings. Many new tenants are seeking healthier quality-of-life amenities, easily adaptable space potential and shorter-than-previously-standard leases.
Table 1: Office Occupancy Jobs
Number of Jobs in the Sector per 100,000 Population
| % | ||||
| July 1, 2009 | July 1, 2018 | Change | ||
| 1 | Employment Services | 780 | 1,139 | 46% |
| 2 | Insurance Carriers | 772 | 818 | 6% |
| 3 | Traditional Banking | 842 | 815 | -3% |
| 4 | Real Estate | 646 | 688 | 6% |
| 5 | Computer Systems Design | 462 | 646 | 40% |
| 6 | Architectural & Engineering | 425 | 452 | 7% |
| 7 | Management Services | 323 | 444 | 37% |
| 8 | Legal Services | 366 | 348 | -5% |
| 9 | Accounting & Bookkeeping | 298 | 309 | 4% |
| 10 | Securities & Commodities | 278 | 295 | 6% |
| 11 | Advertising | 137 | 152 | 11% |
| 12 | Software Publishing | 84 | 118 | 40% |
Table: ConstructConnect — CanaData.


Recent Comments
comments for this post are closed