Currently, there are four U.S. large-population cities that are standouts for their strong labor markets – Austin, San Jose, Orlando and Salt Lake City.
This conclusion is based on rankings of the nation’s 51 metropolitan statistical areas (MSAs) with downtown-plus-suburban populations of a million or more each in two ways: (1) according to year-over-year jobs growth (with fastest to slowest being best); and (2) by unemployment rates (with lower rather than higher being better).

The results appear in accompanying Table 1. A horizontal line separates the Top Dozen on both the jobs-growth (left) and unemployment-rate (right) sides of the table.
Only the shaded cities, − Austin, San Jose, Orlando and Salt Lake City, − appear in the ‘best’ dozen for both high employment growth and low jobless rates.
Orlando is number 1 one for jobs growth and number 12 for unemployment rate; Austin is 3 for jobs growth and 5 for unemployment rate; San Jose is 6 for jobs growth and 4 for unemployment rate; and Salt Lake City is ranked 10 for both jobs growth and unemployment rate.
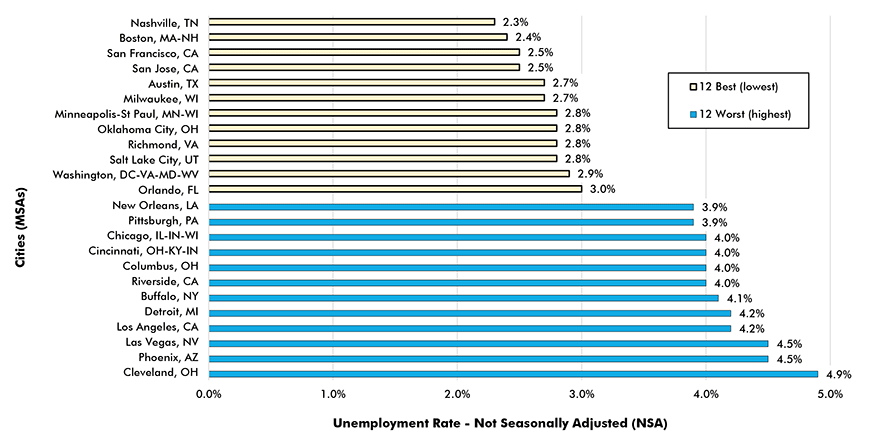
Nashville, which is number 1 for unemployment rate, ranks further down, 21st, for jobs growth. Boston is number 2 for unemployment rate but is only 24th for jobs growth. San Francisco, which is number 3 for unemployment rate is a respectable 16th for jobs growth.
Indianapolis and Oklahoma City also deserve shout-outs. In the table, Indianapolis has relatively high rankings for both jobs growth (13th) and unemployment rate (14th). Oklahoma City is 8th for unemployment rate and a respectable 21st for jobs growth.
Mention should be made, that three of the cities among the Top 12 for jobs growth have been making those strong advances relative to weak levels of employment (i.e., they’ve been climbing off small bases). Phoenix (2nd for jobs growth), Las Vegas (5th) and Cleveland (11th) are in the bottom three positions (50, 49 and 51 respectively) among all 51 cities for unemployment rates.
Moving to the ‘dark side’ of the table, are there cities that are in the Bottom 12 for both jobs growth and unemployment rates? Yes, sad to say, there are five such MSAs – Chicago, Buffalo, Pittsburgh, Los Angeles and Detroit.
Returning to the hottest labor markets for final commentary, there’s evidence that feverish conditions in some local markets are having notable impacts on earnings. For Q4 2018 versus Q4 2017, Orlando’s private-sector all-jobs average hourly earnings increased +8.8%, with average weekly earnings even stronger at +10.8%.
Seattle’s y/y paychecks in Q4 2018 were +8.3% hourly and +8.8% weekly. Nashville’s wages also impressed, with advances of +7.2% hourly and +8.8% weekly.
Table 1: U.S. City Labour Markets
| Ranking by Year-over-year Jobs Change | Ranking by Unemployment Rate | ||||||
| Fastest to slowest | Lowest to Highest | ||||||
| Jan 2019 vs Jan 2018 | January 2019 | ||||||
| 1 | Orlando, FL | 4.0% | 1 | Nashville, TN | 2.3% | ||
| 2 | Phoenix, AZ | 3.7% | 2 | Boston, MA-NH | 2.4% | ||
| 3 | Austin, TX | 3.5% | 3 | San Francisco, CA | 2.5% | ||
| 3 | Houston, TX | 3.5% | 4 | San Jose, CA | 2.5% | ||
| 5 | Las Vegas, NV | 3.4% | 5 | Austin, TX | 2.7% | ||
| 6 | San Jose, CA | 3.3% | 6 | Milwaukee, WI | 2.7% | ||
| 6 | Seattle, WA | 3.3% | 7 | Minneapolis-St Paul, MN-WI | 2.8% | ||
| 8 | Dallas-Ft Worth, TX | 3.2% | 8 | Oklahoma City, OH | 2.8% | ||
| 9 | Raleigh, NC | 3.0% | 9 | Richmond, VA | 2.8% | ||
| 10 | Salt Lake City, UT | 2.7% | 10 | Salt Lake City, UT | 2.8% | ||
| 11 | Atlanta, GA | 2.5% | 11 | Washington, DC-VA-MD-WV | 2.9% | ||
| 11 | Cleveland, OH | 2.5% | 12 | Orlando, FL | 3.0% | ||
| 13 | Cincinnati, OH-KY-IN | 2.3% | 13 | Virginia Beach, VA-NC | 3.0% | ||
| 13 | Indianapolis, IN | 2.3% | 14 | Indianapolis, IN | 3.1% | ||
| 13 | Portland, OR-WA | 2.3% | 15 | Jacksonville, FL | 3.1% | ||
| 16 | New Orleans, LA | 2.2% | 16 | Kansas City, MO-KS | 3.1% | ||
| 16 | San Francisco, CA | 2.2% | 17 | Birmingham, AL | 3.2% | ||
| 18 | Baltimore, MD | 2.1% | 18 | San Antonio, TX | 3.2% | ||
| 18 | Denver, CO | 2.1% | 19 | San Diego, CA | 3.2% | ||
| 18 | Miami, FL | 2.1% | 20 | Tampa, FL | 3.2% | ||
| 21 | Charlotte, NC-SC | 2.0% | 21 | Dallas-Ft Worth, TX | 3.3% | ||
| 21 | Nashville, TN | 2.0% | 22 | Hartford, CT | 3.3% | ||
| 21 | Oklahoma City, OH | 2.0% | 23 | Miami, FL | 3.3% | ||
| 24 | Birmingham, AL | 1.9% | 24 | Raleigh, NC | 3.3% | ||
| 24 | Boston, MA-NH | 1.9% | 25 | Charlotte, NC-SC | 3.4% | ||
| 24 | Philadelphia, PA-NJ-DE-MD | 1.9% | 26 | St. Louis, MO-IL | 3.4% | ||
| 24 | Riverside, CA | 1.9% | 27 | Baltimore, MD | 3.5% | ||
| 24 | San Diego, CA | 1.9% | 28 | Louisville, KY-IN | 3.5% | ||
| 29 | Jacksonville, FL | 1.8% | 29 | Atlanta, GA | 3.6% | ||
| 29 | Sacramento, CA | 1.8% | 30 | New York, NY-NJ-PA | 3.6% | ||
| 31 | Columbus, OH | 1.7% | 31 | Sacramento, CA | 3.6% | ||
| 31 | Tampa, FL | 1.7% | 32 | Denver, CO | 3.7% | ||
| 31 | Virginia Beach, VA-NC | 1.7% | 33 | Memphis, TN-MS-AR | 3.7% | ||
| 34 | Minneapolis-St Paul, MN-WI | 1.6% | 34 | Philadelphia, PA-NJ-DE-MD | 3.7% | ||
| 34 | Richmond, VA | 1.6% | 35 | Providence, RI-MA | 3.7% | ||
| 34 | Washington, DC-VA-MD-WV | 1.6% | 36 | Portland, OR-WA | 3.8% | ||
| 37 | Memphis, TN-MS-AR | 1.5% | 37 | Rochester, NY | 3.8% | ||
| 37 | St. Louis, MO-IL | 1.5% | 38 | Seattle, WA | 3.8% | ||
| 39 | Hartford, CT | 1.4% | 39 | Houston, TX | 3.9% | ||
| 39 | Kansas City, MO-KS | 1.4% | 40 | New Orleans, LA | 3.9% | ||
| 41 | Buffalo, NY | 1.3% | 41 | Pittsburgh, PA | 3.9% | ||
| 42 | Chicago, IL-IN-WI | 1.2% | 42 | Chicago, IL-IN-WI | 4.0% | ||
| 42 | New York, NY-NJ-PA | 1.2% | 43 | Cincinnati, OH-KY-IN | 4.0% | ||
| 42 | Providence, RI-MA | 1.2% | 44 | Columbus, OH | 4.0% | ||
| 45 | Los Angeles, CA | 0.9% | 45 | Riverside, CA | 4.0% | ||
| 46 | Milwaukee, WI | 0.8% | 46 | Buffalo, NY | 4.1% | ||
| 46 | Pittsburgh, PA | 0.8% | 47 | Detroit, MI | 4.2% | ||
| 46 | San Antonio, TX | 0.8% | 48 | Los Angeles, CA | 4.2% | ||
| 49 | Detroit, MI | 0.7% | 49 | Las Vegas, NV | 4.5% | ||
| 50 | Rochester, NY | 0.5% | 50 | Phoenix, AZ | 4.5% | ||
| 51 | Louisville, KY-IN | 0.2% | 51 | Cleveland, OH | 4.9% | ||
| U.S. | 1.8% | U.S. | 3.9% | ||||
Green shade: Cities that are in the Top 12 for both high employment growth & low unemployment rate.
There were 4 in the latest month: Austin, San Jose, Orlando and Salt Lake City.
Based on not seasonally adjusted (NSA) data. / Cities are metropolitan statistical areas (MSAs).
When the ranking numbers are the same, the cities are in a tie.
Data source: Bureau of Labor Statistics (BLS).
Table: ConstructConnect.
Graph 1: Unemployment Rates in Major U.S. Cities − December 2018
12 Best (lowest) and 12 Worst (highest)

Data source: Bureau of Labor Statistics (BLS)/
Chart: ConstructConnect.


Recent Comments