In January, Canada managed an excellent beginning to the new year on the jobs front. According to Statistics Canada’s Labour Force Survey report for the first month of 2019, the net employment climb was +67,000.

The unemployment rate worsened slightly, however, to 5.8% from 5.6% in December, as more individuals entered the labour force. The ‘participation rate’ rose from 65.4% to 65.6%.
The month-to-month changes in full-time versus part-time work were well balanced, with the former at +31,000 and the latter at +36,000.
The number of services jobs shot up month to month, +99,000, but there were contractions in both manufacturing, -6,000, and construction, -9,000.
Manufacturing jobs year over year are now -29,000. Construction sector jobs are ahead year over year, but only by a little, +13,000.
Within services-producing industries, the ‘wholesale and retail’ (+34,000) and ‘professional, scientific and technical services’ (+29,000) sub-sectors went on hiring tears in the latest month.
The total number of jobs in Canada has risen by +327,000 year over year. Ontario alone has contributed more than half (+170,000 or a 52% share) of that total. B.C. has provided the next biggest portion (+62,000 or a 19% slice).
On a percentage-change basis, Canadian jobs are +1.8% year over year. In a departure from the normal pattern, the Atlantic Region is leading the country in year-over-year jobs growth, at +2.1%. The Atlantic provinces have often struggled with jobs creation in the past. The latest performance is welcome news.
In the Central Region, consisting of Quebec and Ontario, the staffing gain has been +1.8%. Jobs movement in the West, from Manitoba through B.C., has been somewhat slower, at +1.6%.
Table 1: Canada’s Provincial Labour Markets − January, 2019
| Unemployment | Employment | |||||||
| Rate | Y/Y Jobs Growth | |||||||
| Nfld & Lab | 11.4% | 3.5% | ||||||
| P.E.I. | 9.9% | 0.5% | ||||||
| N.S. | 6.9% | 2.6% | ||||||
| N.B. | 8.2% | 1.0% | ||||||
| Que. | 5.4% | 0.9% | ||||||
| Ont. | 5.7% | 2.4% | ||||||
| Man. | 5.5% | 2.3% | ||||||
| Sask. | 5.5% | 1.4% | ||||||
| Alta. | 6.8% | 0.5% | ||||||
| B.C. | 4.7% | 2.5% | ||||||
| CANADA | 5.8% | 1.8% | ||||||
Yellow shading when provincial rate is higher than total Canada rate.
Ont., Man., and B.C. have both low unemployment rates and high jobs growth.
Table: ConstructConnect.
Table 1 sets out an interesting way to assess labour markets in Canada’s ten provinces. Table 1 adopts the premise that it’s most desirable to have a low unemployment rate and a rapid rate of jobs improvement.
Therefore, in the unemployment rate column, the figures for the provinces that are less than the national average (5.8%) are shaded purple. In the far-right jobs growth column, the figures that are colored over in yellow are those above the national rate of employment increase (+1.8%).
Three provinces stand out for having both of their numbers highlighted − Ontario, Manitoba and B.C. They would appear to be the best labour markets in the country at this time.
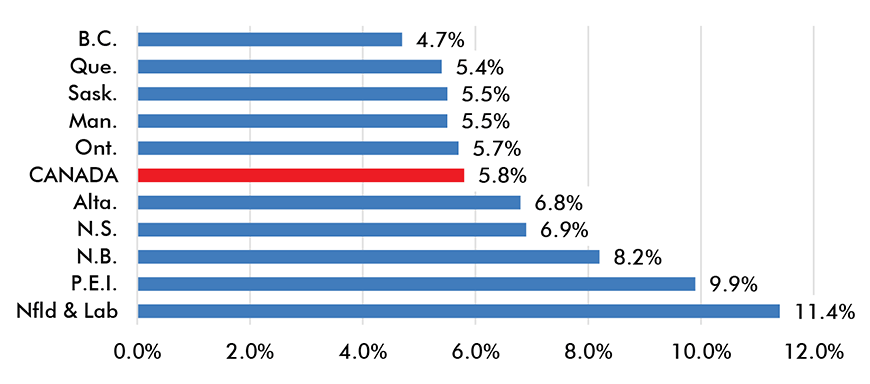
Graph 1 shows provincial unemployment rates cascading down from lowest to highest, with the Canada-wide number in the middle. The lowest unemployment rate is presently in B.C., 4.7%.
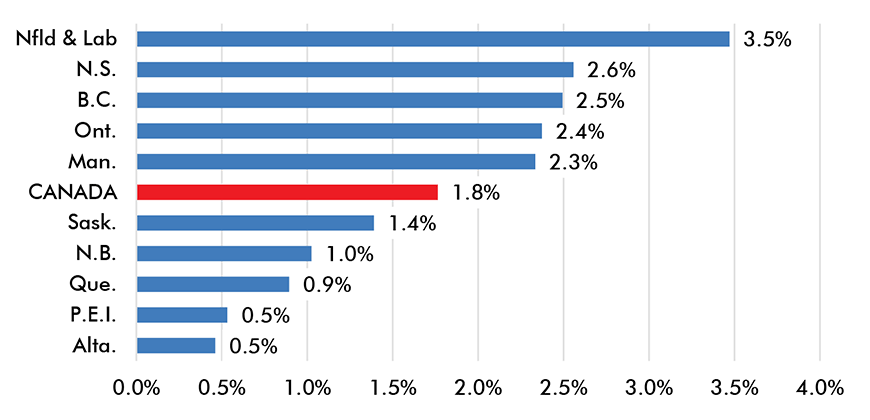
Graph 2 highlights year-over-year jobs growth rates in the provinces, from fastest to slowest, with the total Canada figure again in the center. Unusually, two Atlantic provinces are leading the pack, Newfoundland and Labrador, +3.5%, and Nova Scotia, +2.6%.
Graph 1: Provincial Unemployment Rates – January, 2019

Chart: ConstructConnect.
Graph 2: Provincial Y/Y Jobs Growth – January, 2019

Chart: ConstructConnect.


Recent Comments
comments for this post are closed