In the U.S., there are 51 metropolitan statistics areas with populations of 1 million or more each. The 2017 and 2018 values of construction ‘starts’ in those 51 cities are set out in accompanying Tables 1 and 2.

Table 1 ranks the cities according to 2018 dollar-volume levels; Table 2 ranks them by 2018-versus-2017 percentage changes.
The starts figures have been calculated by ConstructConnect.
In Table 1, in the 2018 dollar-volume column, two cities in Texas lead the pack: Houston at $28.0 billion and Dallas-Ft. Worth at $26.1 billion.
New York ($24.0 billion), Washington ($16.6), Atlanta ($14.8), Los Angeles ($14.3), and Phoenix ($14.3) also score well in Table 1’s ranking.
Map 1: Ranking of Major U.S. Cities by Total Value of Construction Starts: 2018 (in $ billions)
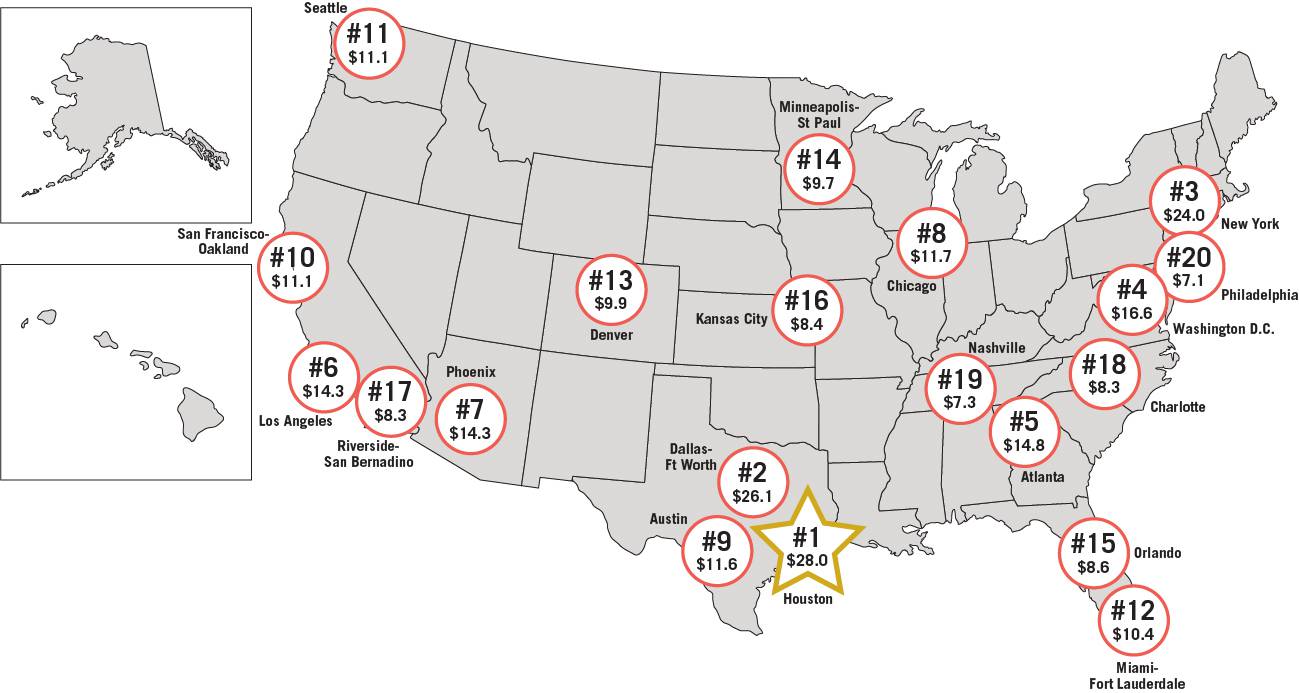
Table 1: Ranking of Major U.S. Cities by Total Value of Construction Starts: 2018
| Rank by | ||||
| $ Value | City / MSA | 2017 | 2018 | % Change |
| ($ Billions) | ||||
| 1 | Houston TX | $24.326 | $27.999 | 15.1% |
| 2 | Dallas-Ft Worth TX | $29.167 | $26.136 | -10.4% |
| 3 | New York NY-NJ | $35.444 | $24.019 | -32.2% |
| 4 | Washington DC-VA-MD-WV | $14.902 | $16.573 | 11.2% |
| 5 | Atlanta GA | $15.369 | $14.826 | -3.5% |
| 6 | Los Angeles CA | $19.548 | $14.288 | -26.9% |
| 7 | Phoenix AZ | $12.608 | $14.274 | 13.2% |
| 8 | Chicago IL | $16.822 | $11.704 | -30.4% |
| 9 | Austin TX | $9.566 | $11.589 | 21.1% |
| 10 | San Francisco-Oakland CA | $13.610 | $11.106 | -18.4% |
| 11 | Seattle WA | $11.846 | $11.061 | -6.6% |
| 12 | Miami-Fort Lauderdale FL | $12.695 | $10.422 | -17.9% |
| 13 | Denver CO | $8.758 | $9.902 | 13.1% |
| 14 | Minneapolis-St Paul MN-WI | $9.865 | $9.706 | -1.6% |
| 15 | Orlando FL | $11.234 | $8.639 | -23.1% |
| 16 | Kansas City MO-KS | $5.682 | $8.364 | 47.2% |
| 17 | Riverside-San Bernardino CA | $8.999 | $8.344 | -7.3% |
| 18 | Charlotte NC-SC | $8.315 | $8.305 | -0.1% |
| 19 | Nashville TN | $9.567 | $7.300 | -23.7% |
| 20 | Philadelphia PA | $7.605 | $7.130 | -6.2% |
| 21 | Portland OR-WA | $7.497 | $7.107 | -5.2% |
| 22 | Las Vegas NV | $7.706 | $6.978 | -9.4% |
| 23 | San Antonio TX | $7.264 | $6.894 | -5.1% |
| 24 | Boston MA | $6.747 | $6.858 | 1.6% |
| 25 | Tampa-St Petersburg FL | $6.265 | $6.809 | 8.7% |
| 26 | Sacramento CA | $5.513 | $6.216 | 12.8% |
| 27 | Raleigh NC | $5.179 | $5.970 | 15.3% |
| 28 | San Diego CA | $7.039 | $5.282 | -25.0% |
| 29 | Baltimore MD | $5.632 | $5.191 | -7.8% |
| 30 | St Louis MO-IL | $7.196 | $5.160 | -28.3% |
| 31 | Cincinnati OH-KY-IN | $4.285 | $5.130 | 19.7% |
| 32 | Salt Lake City UT | $4.329 | $5.016 | 15.9% |
| 33 | Cleveland OH | $3.193 | $4.642 | 45.4% |
| 34 | Indianapolis IN | $4.191 | $4.405 | 5.1% |
| 35 | Richmond VA | $3.818 | $4.345 | 13.8% |
| 36 | Jacksonville FL | $4.832 | $4.305 | -10.9% |
| 37 | Columbus OH | $5.611 | $4.193 | -25.3% |
| 38 | Oklahoma City OK | $3.693 | $4.184 | 13.3% |
| 39 | Milwaukee WI | $4.130 | $4.055 | -1.8% |
| 40 | Providence RI-MA | $2.337 | $3.992 | 70.8% |
| 41 | Pittsburgh PA | $9.307 | $3.856 | -58.6% |
| 42 | Virginia Beach VA-NC | $3.226 | $3.734 | 15.7% |
| 43 | Detroit MI | $2.944 | $3.654 | 24.1% |
| 44 | Louisville KY-IN | $3.272 | $3.455 | 5.6% |
| 45 | Memphis TN-MS-AR | $2.262 | $3.026 | 33.8% |
| 46 | San Jose-Santa Clara CA | $5.248 | $2.695 | -48.6% |
| 47 | Birmingham AL | $2.393 | $2.344 | -2.0% |
| 48 | New Orleans LA | $4.040 | $2.170 | -46.3% |
| 49 | Buffalo-Niagara Falls NY | $1.915 | $1.929 | 0.7% |
| 50 | Rochester NY | $1.990 | $1.757 | -11.7% |
| 51 | Hartford CT | $2.061 | $1.557 | -24.5% |
There is a city with less than a million people that would otherwise have appeared prominently in Table 1. It would have made it into position 12, displacing Miami, thanks to the initiation of work on one, particularly large project. In 2018, Racine, Wisconsin, was the beneficiary of a $10 billion investment launched by Taiwanese electronics giant Foxconn Technology Group.
Lately, there has been uncertainty about the type of activity that will take place at Foxconn’s new Racine facility. The plan, when first conceived, was that it would manufacture liquid crystal display (LCD) screens for television sets. But there has been a shift in thinking by the company’s brass towards more of a focus on research and development. Such a move would suggest a downsizing in scale.
President Trump has been talking with the folks at Foxconn, trying to convince them to stick with their manufacturing intent. In any event, the company is saying it is committed to eventually providing the 13,000 jobs touted in its original proposal.
In Table 2, Providence led all cities in year-over-year percentage change in starts in 2018, at +71%. Kansas City (+47%), Cleveland (+45%), and Memphis (+34%) also turned in stellar performances.
But most of the cities at the top of Table 2 made their large gains relative to low base volumes in the year prior. The most impressive increases in 2018 were made by metro areas that moved beyond already good volumes of groundbreakings in 2017 – Austin, +21%; Houston, +15%; Phoenix, +13%; and Denver, also +13%.
Map 2: Ranking of Major U.S. Cities by 2018 vs 2017 % Change in Total Value of Construction Starts
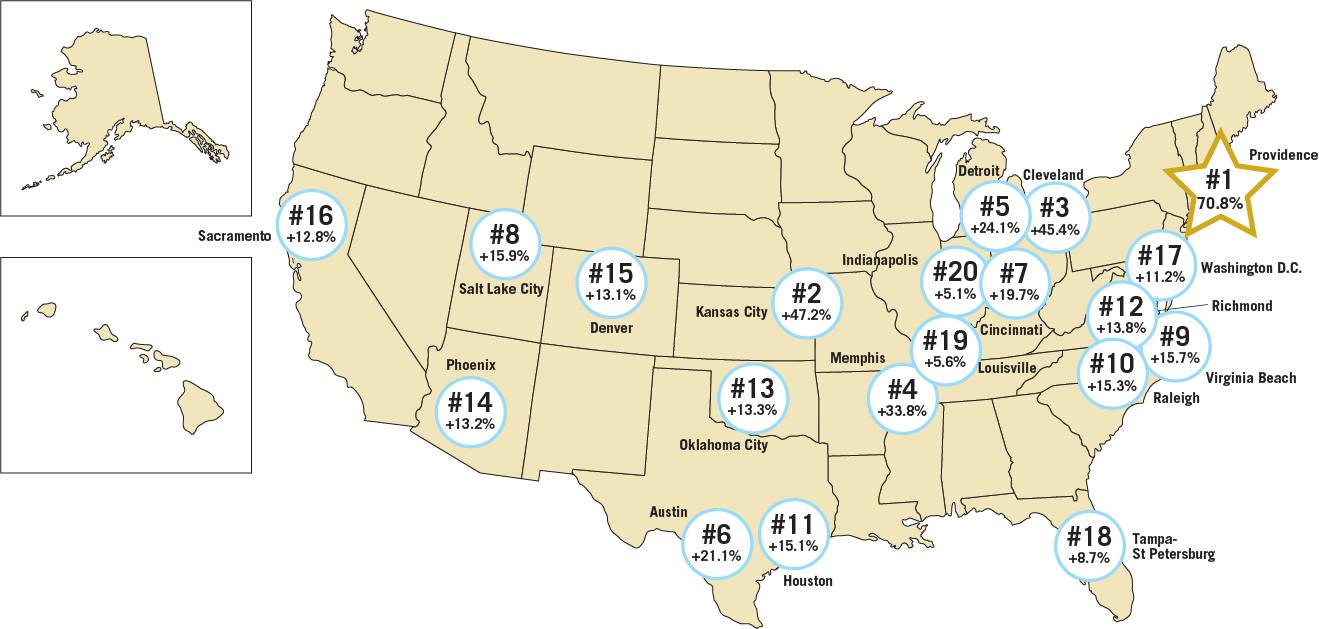
Table 2: Ranking of Major U.S. Cities by 2018 vs 2017 % Change in Total Value of Construction Starts
| Rank by | ||||
| % change | City / MSA | 2017 | 2018 | % Change |
| ($ Billions) | ||||
| 1 | Providence RI-MA | $2.337 | $3.992 | 70.8% |
| 2 | Kansas City MO-KS | $5.682 | $8.364 | 47.2% |
| 3 | Cleveland OH | $3.193 | $4.642 | 45.4% |
| 4 | Memphis TN-MS-AR | $2.262 | $3.026 | 33.8% |
| 5 | Detroit MI | $2.944 | $3.654 | 24.1% |
| 6 | Austin TX | $9.566 | $11.589 | 21.1% |
| 7 | Cincinnati OH-KY-IN | $4.285 | $5.130 | 19.7% |
| 8 | Salt Lake City UT | $4.329 | $5.016 | 15.9% |
| 9 | Virginia Beach VA-NC | $3.226 | $3.734 | 15.7% |
| 10 | Raleigh NC | $5.179 | $5.970 | 15.3% |
| 11 | Houston TX | $24.326 | $27.999 | 15.1% |
| 12 | Richmond VA | $3.818 | $4.345 | 13.8% |
| 13 | Oklahoma City OK | $3.693 | $4.184 | 13.3% |
| 14 | Phoenix AZ | $12.608 | $14.274 | 13.2% |
| 15 | Denver CO | $8.758 | $9.902 | 13.1% |
| 16 | Sacramento CA | $5.513 | $6.216 | 12.8% |
| 17 | Washington DC-VA-MD-WV | $14.902 | $16.573 | 11.2% |
| 18 | Tampa-St Petersburg FL | $6.265 | $6.809 | 8.7% |
| 19 | Louisville KY-IN | $3.272 | $3.455 | 5.6% |
| 20 | Indianapolis IN | $4.191 | $4.405 | 5.1% |
| 21 | Boston MA | $6.747 | $6.858 | 1.6% |
| 22 | Buffalo-Niagara Falls NY | $1.915 | $1.929 | 0.7% |
| 23 | Charlotte NC-SC | $8.315 | $8.305 | -0.1% |
| 24 | Minneapolis-St Paul MN-WI | $9.865 | $9.706 | -1.6% |
| 25 | Milwaukee WI | $4.130 | $4.055 | -1.8% |
| 26 | Birmingham AL | $2.393 | $2.344 | -2.0% |
| 27 | Atlanta GA | $15.369 | $14.826 | -3.5% |
| 28 | San Antonio TX | $7.264 | $6.894 | -5.1% |
| 29 | Portland OR-WA | $7.497 | $7.107 | -5.2% |
| 30 | Philadelphia PA | $7.605 | $7.130 | -6.2% |
| 31 | Seattle WA | $11.846 | $11.061 | -6.6% |
| 32 | Riverside-San Bernardino CA | $8.999 | $8.344 | -7.3% |
| 33 | Baltimore MD | $5.632 | $5.191 | -7.8% |
| 34 | Las Vegas NV | $7.706 | $6.978 | -9.4% |
| 35 | Dallas-Ft Worth TX | $29.167 | $26.136 | -10.4% |
| 36 | Jacksonville FL | $4.832 | $4.305 | -10.9% |
| 37 | Rochester NY | $1.990 | $1.757 | -11.7% |
| 38 | Miami-Fort Lauderdale FL | $12.695 | $10.422 | -17.9% |
| 39 | San Francisco-Oakland CA | $13.610 | $11.106 | -18.4% |
| 40 | Orlando FL | $11.234 | $8.639 | -23.1% |
| 41 | Nashville TN | $9.567 | $7.300 | -23.7% |
| 42 | Hartford CT | $2.061 | $1.557 | -24.5% |
| 43 | San Diego CA | $7.039 | $5.282 | -25.0% |
| 44 | Columbus OH | $5.611 | $4.193 | -25.3% |
| 45 | Los Angeles CA | $19.548 | $14.288 | -26.9% |
| 46 | St Louis MO-IL | $7.196 | $5.160 | -28.3% |
| 47 | Chicago IL | $16.822 | $11.704 | -30.4% |
| 48 | New York NY-NJ | $35.444 | $24.019 | -32.2% |
| 49 | New Orleans LA | $4.040 | $2.170 | -46.3% |
| 50 | San Jose-Santa Clara CA | $5.248 | $2.695 | -48.6% |
| 51 | Pittsburgh PA | $9.307 | $3.856 | -58.6% |
Canada has six cities with populations above 1 million residents each.
The 2018 starts figures for those six north-of-the-border cities, in Canadian and U.S. dollars, were as follows:
- Toronto, $15.7 billion CDN ($11.4 billion USD), +24% y/y;
- Montreal, $13.7 billion CDN ($9.9 billion USD), +79% y/y;
- Edmonton, $6.4 billion CDN ($4.6 billion USD), +69% y/y;
- Vancouver, $5.2 billion CDN ($3.8 billion USD), -9% y/y;
- Calgary, $2.7 billion CDN ($1.9 billion USD), -41% y/y;
- Ottawa-Gatineau, $1.9 billion CDN ($1.4 billion USD), -15% y/y.
If they had been included in Table 1, Toronto and Montreal would have appeared among 2018’s Top 15.


Recent Comments